Abstract
Summary: Genome evolution underpins all of biology, yet its principles can be difficult to communicate to the non-specialist. To facilitate broader understanding of genome evolution, we have designed an interactive 3D environment that enables visualization of diverse genome evolution processes. The system can intuitively and interactively animate mutation histories involving genome rearrangement, point mutation, recombination, insertion and deletion. Multiple organisms related by a phylogeny can be visualized simultaneously. As methods to infer evolutionary histories of genomes become increasingly complex, visualization of the evolutionary process will not only be useful for communication, but will also serve as an exploratory tool for discovering new patterns of genome evolution.
Availability: The software is licensed under the GNU GPL and available for download from http://seevolution.org.
Contact: aarondarling@ucdavis.edu
1 INTRODUCTION
As genomes evolve, they undergo mutational processes that can alter not only individual nucleotides but also the large-scale structure of chromosomes. Although genome sequencing has helped to characterize the rates and patterns of such chromosomal evolution, communicating findings to a broad audience can be challenging.
Modern inference methods can reconstruct likely evolutionary histories using genome sequence data alone. Methods such as GRAPPA (Tang and Moret, 2003) can infer inversion histories and phylogenies on single chromosomes, while GRIMM/MGR (Tesler, 2002) can be applied to multi-chromosomal genomes. Yet another method, BADGER (Larget et al., 2005), implements a Bayesian framework to sample likely phylogenetic inversion histories and can report the uncertainty in individual reconstructions (Darling et al., 2008). Bayesian methods have also been developed to sample histories of inversions and transposition (Miklos, 2003), duplications (Zhang, 2008), gene gain and loss and gene conversion and nucleotide substitution (Didelot and Falush, 2007). Similar methods have been applied to mammals (Blanchette et al., 2008). All of these inference methods are typically predicated on a multiple-genome alignment (Darling et al., 2004). Although no method currently infers mutation histories under a single model incorporating all these mutation types, inferences from each method can potentially be integrated into a single reconstruction.
Output from the programs listed above usually consists of a text file containing the complete history for the mutation type and genomes of interest. The textual representation is not always easy to interpret, especially for complex histories. An appropriate visualization has the potential to substantially aid interpretation.
To this end we introduce Seevolution, a novel system for visualizing complex histories of chromosomal evolution. Seevolution displays single- and multi-species phylogenies, animating the inferred series of events that occurred in the history of the organisms. Mutations such as inversion, transposition, deletion, insertion, nucleotide substitution and gene conversion can all be visualized.
Other programs offer some visualization of rearrangements, for example, the GRIMM web server (Tesler, 2002) and PEGR (Fremez et al., 2007). However, to our knowledge no other software visualizes the range of events implemented in Seevolution.
2 METHODS
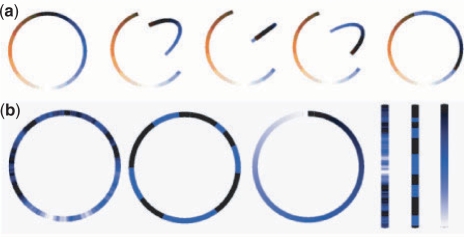
Seevolution utilizes Java3D to render animations of evolutionary events in chromosomes. Java3D implements a scene graph-based rendering paradigm. In Seevolution, a chromosome is represented visually as either a cylinder (linear chromosomes) or torus (circular chromosomes). In the scene graph, each chromosome is composed of an arbitrary number of segments, each of which is also a cylinder. Thus, a circular chromosome is a composite of many small cylindrical segments each rotated around a center point in x, y, z space. The segments are themselves composed of numerous triangular surfaces. Each segment can be assigned a color and a texture, and Seevolution uses these colors to communicate information about breakpoints of rearrangement, spatial organization of the chromosome such as distance from the origin of replication and other features (Fig. 1).
Fig. 1.
(a) Snapshots of inversion animation on a circular chromosome. (b) Heatmap view of chromosomes. Seevolution can load user-defined heatmaps that can represent, for example, GC-skew, local repeat abundance or gene expression levels. Heatmaps are simply a list of real-valued numbers in [0, 1].
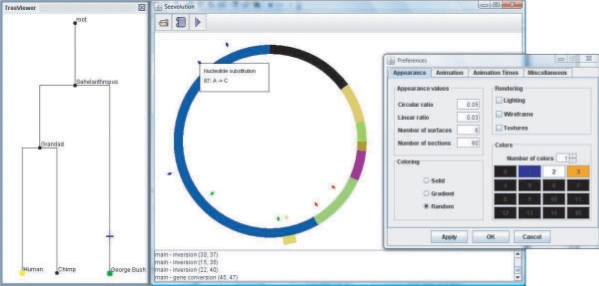
Seevolution takes as input a history of genome mutations in XML format. Upon reading the file, the program processes the list of events to identify the locations of breakpoints, and thus identify regions free from rearrangement Locally Collinear Blocks (LCB). In the viewer, each LCB can be assigned a distinct color. Events such as inversions and transpositions often affect a large portion of the chromosome and for these Seevolution portrays a dramatic animation of the event (Fig. 1). Insertions, deletions and nucleotide substitutions are typically too small to be appreciated at the genome scale, since 1 nt is much smaller than 1 pixel in our rendering (although zooming in is possible). To portray such mutations, Seevolution draws small markers at the mutation site (Fig. 2, middle). By exploiting Java3D's picking feature, Seevolution allows the user to display the actual nucleotides gained, lost or mutated by clicking on the mutation marker.
Fig. 2.
Phylogeny of three organisms (left). A circular chromosome colored by rearrangement breakpoints (middle). Blue tick marks indicate nucleotide substitutions, green are insertions, red are deletions and yellow/gold are gene conversions, with one currently being animated at the bottom of the chromosome. Configuration panel for color schemes and animations (right).
Seevolution also displays the tree topology relating the genomes (Fig. 2, left), and allows the user to jump to the chromosomal configuration at arbitrary positions in the tree simply by clicking. At that point, Seevolution can animate the series of mutation events in either forward or reverse time.
Seevolution has a modular software architecture that lends itself to other visual extensions by independent software modules. Seevolution includes an event-based API to which other Java programs can subscribe. Seevolution sends information regarding the progress of mutation animation to event listeners. For example, a viewer with gene annotation information could display feedback when genes of interest suffer mutations.
3 RESULTS
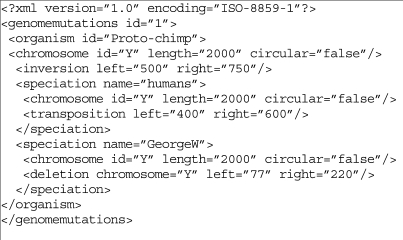
The described viewer has been implemented as a Java Web Start application available from http://seevolution.org. The application takes as input an XML file listing the history of evolutionary events. We designed the XML format to represent chromosome evolution in the simplest possible way (Fig. 3). The following mutation types are currently supported: substitutions, inversions, gene conversions, insertions and deletions. The XML can also represent genealogical trees relating the organisms of interest. Example XML and a tutorial are available online. Future work visualizing mutation histories might include means to summarize the uncertainty inherent in most reconstructions. Substantial ambiguity exists in mutation event ordering, as orderings are often informed only by branching events in the tree.
Fig. 3.
Seevolution XML to represent a genome that has undergone an inversion, then a speciation, and then a transposition in one of the lineages. The other lineage has suffered a deletion.
Funding: This work was supported by National Science Foundation (DBI-0630765 to A.E.D.); Australian Research Council (CE0348221 to M.A.R.).
Conflict of Interest: none declared.
References
- Blanchette M, et al. Computational Reconstruction of Ancestral DNA Sequences. Phylogenomics. Vol. 422. Totowa, NJ: Humana Press; 2008. pp. 171–184. [DOI] [PubMed] [Google Scholar]
- Darling ACE, et al. Mauve: multiple alignment of conserved genomic sequence with rearrangements. Genome Res. 2004;14:1394–1403. doi: 10.1101/gr.2289704. [DOI] [PMC free article] [PubMed] [Google Scholar]
- Darling AE, et al. Dynamics of genome rearrangement in bacterial populations. PLoS Genet. 2008;4:e1000128. doi: 10.1371/journal.pgen.1000128. [DOI] [PMC free article] [PubMed] [Google Scholar]
- Didelot X, Falush D. Inference of bacterial microevolution using multilocus sequence data. Genetics. 2007;175:1251–1266. doi: 10.1534/genetics.106.063305. [DOI] [PMC free article] [PubMed] [Google Scholar]
- Fremez R, et al. Phylogenetic exploration of bacterial genomic rearrangements. Bioinformatics. 2007;23:1172–1174. doi: 10.1093/bioinformatics/btm070. [DOI] [PubMed] [Google Scholar]
- Larget B, et al. Bayesian analysis of metazoan mitochondrial genome arrangements. Mol. Biol. Evol. 2005;22:486–495. doi: 10.1093/molbev/msi032. [DOI] [PubMed] [Google Scholar]
- Miklós I. MCMC genome rearrangement. Bioinformatics. 2003;19(Suppl. 2):ii130–ii137. doi: 10.1093/bioinformatics/btg1070. [DOI] [PubMed] [Google Scholar]
- Tang J, Moret BME. Scaling up accurate phylogenetic reconstruction from gene-order data. Bioinformatics. 2003;19(Suppl. 1):i305–i312. doi: 10.1093/bioinformatics/btg1042. [DOI] [PubMed] [Google Scholar]
- Tesler G. GRIMM: genome rearrangements web server. Boinformatics. 2002;18:492–493. doi: 10.1093/bioinformatics/18.3.492. [DOI] [PubMed] [Google Scholar]
- Zhang Y, et al. Reconstructing the Evolutionary History of Complex Human Gene Clusters. LNCS 4955. Berlin, Germany: Springer; 2008. pp. 29–49. [Google Scholar]


