Abstract
Studies in rodents suggest that the adipocytokine resistin causes insulin resistance via impairing normal insulin signaling. However, in humans, resistin may play a more important role in inflammation than in insulin resistance. Whether resistin contributes to inflammation in rodents is unclear. Therefore, the purpose of the present study was to determine the effect of resistin exposure on the basal and stimulated [lipopolysaccharide (LPS)] inflammatory response in mouse liver in vivo. Resistin alone had no major effects on hepatic expression of insulin-responsive genes, either in the presence or absence of LPS. Although it had no effect alone, resistin significantly enhanced hepatic inflammation and necrosis caused by LPS. Resistin increased expression of proinflammatory genes, e.g., plasminogen activator inhibitor (PAI)-1, and activity of mitogen-activated protein (MAP) kinase, extracellular signal-regulated kinase 1/2, caused by LPS, but had little effect on anti-inflammatory gene expression. Resistin also enhanced fibrin deposition (an index of hemostasis) caused by LPS. The increase in PAI-1 expression, fibrin deposition, and liver damage caused by LPS + resistin was almost completely prevented either by inhibiting the coagulation cascade, hirudin, or by blocking MAP kinase signaling, U0126 [1,4-diamino-2,3-dicyano-1,4-bis(2-aminophenylthio) butadiene], indicating that these pathways play a causal role in observed enhanced liver damage caused by resistin. Taken together, the augmentation of LPS-induced liver damage caused by resistin seems to involve, at least in part, up-regulation of hepatic inflammation via mechanisms most likely involving the coagulation cascade and fibrin accumulation. These data also suggest that resistin may have proinflammatory roles in mouse liver independent of its effects on insulin signaling, analogous to previous work in humans.
Hepatic disease (e.g., nonalcoholic steatohepatitis) is a common complication of insulin resistance and type II diabetes and is mediated, at least in part, by enhanced systemic and local inflammation (Hotamisligil et al., 1993). Inflammation during insulin resistance has often correlated with overproduction of local proinflammatory cytokines, such as TNFα (Lehrke et al., 2004). Furthermore, recent work has indicated that some adipokines, whose release from adipose tissue is altered during insulin resistance (i.e., leptin and adiponectin), also directly coordinate the local inflammatory response in liver (Tsochatzis et al., 2006). However, mechanisms by which adipokines modulate hepatic inflammation and the possible role of other adipokines in this process are unclear.
Resistin, also known as FIZZ3 and adipocyte-derived secretory factor (Holcomb et al., 2000; Steppan et al., 2001b; Rajala et al., 2002), is a 12.5-kDa polypeptide synthesized and secreted by adipocytes. In rodents, serum levels of resistin were elevated in models of obesity, and high-dose resistin altered glucose metabolism through impairment of insulin action, particularly in the liver (Steppan et al., 2001a; McTernan et al., 2006). Furthermore, mice lacking resistin have decreased fasted glucose levels (Banerjee et al., 2004). Coupled with the observation that plasma resistin levels are also elevated in humans with type 2 diabetes (Youn et al., 2004), it was speculated that the role of resistin in mammalian species is to regulate insulin signaling and subsequent glucose metabolism.
More recent studies in humans have challenged the assumed function of resistin in vivo, at least in this species. In particular, resistin is robustly expressed in human monocytes (instead of only in adipocytes; e.g., Kaser et al., 2003; McTernan et al., 2006), and serum levels in humans correlate more with inflammation rather than with insulin resistance (e.g., Bokarewa et al., 2005). The results of these studies have led to the speculation that there are interspecies differences in resistin and its effects, with the adipokine mediating predominantly proinflammatory effects in humans (Bertolani et al., 2006; Haluzik and Haluzikova, 2006). However, whether or not resistin also contributes to hepatic inflammation in rodents (independent of insulin resistance) has not been delineated. The purpose of the current study was to determine the effect of acute resistin on hepatic inflammation and damage caused by the model hepatotoxicant, lipopolysaccharide (LPS).
Materials and Methods
Animals and Treatments
Four-week-old male C57BL/6J mice were purchased from The Jackson Laboratory (Bar Harbor, ME). Mice were housed in a pathogen-free barrier facility accredited by the Association for Assessment and Accreditation of Laboratory Animal Care, and procedures were approved by the local Institutional Animal Care and Use Committee. Food and tap water were allowed ad libitum. Animals received injections with recombinant murine resistin (EMD Biosciences, San Diego, CA; 0.33 mg/kg i.p.) and/or LPS (Escherichia coli, serotype 055:B5, batch 075K4038; Sigma-Aldrich, St Louis, MO; 10 mg/kg i.p.) or saline vehicle. The dose of resistin is based on preliminary studies and is within the range of studies published by other groups (e.g., Ort et al., 2005). The dose of LPS was determined by preliminary range-finding experiments to cause moderate liver damage. With this dose, animals are ataxic and show signs of stress (e.g., raised hair) but remain conscious and show no signs of toxicity to other target organs (e.g., plasma CK-MB activity was not significantly increased). Contamination of the resistin stock solution with LPS was below detectable limits of the limulus amebocyte lysate assay, determined with a commercially available kit (Lonza Walkersville, Inc., Walkersville, MD). Hirudin (Refludan; Berlex, Montville, NJ; 1 mg/kg s.c.) or vehicle (saline) was given 30, 150, and 270 min after LPS. U0126 (Calbiochem, La Jolla, CA; 10 mg/kg i.p.) or vehicle (dimethyl sulfoxide) was administered 60 min after LPS. Mice were anesthetized with ketamine/xylazine (100/15 mg/kg i.m.) 1, 8, and 24 h after receiving injections with LPS. Blood was collected from the vena cava just before sacrifice by ex-sanguination, and citrated plasma was stored at −80°C for further analysis. Portions of liver tissue were snap-frozen in liquid nitrogen, frozen-fixed in OCT-Compound (Sakura Finetek, Torrance, CA), or were fixed in 10% neutral buffered formalin for subsequent sectioning and mounting on microscope slides.
Clinical Analyses and Histology
Plasma levels of aminotransferases [alanine aminotransferase (ALT) and aspartate aminotransferase (AST)] were determined using standard kits (Thermotrace, Melbourne, Australia). Plasma insulin was quantitated using an ELISA kit purchased from ALPCO Diagnostics (Windham, NH). Plasma levels of resistin were determined using an ELISA kit purchased from Bio Vendor (Candler, NC). Plasma levels of glucose were determined using a glucose assay kit purchased from BioAssay Systems (Hayward, CA). Plasma TNFα was quantitated using an ELISA kit purchased from R&D Systems (Minneapolis, MN). Neutrophil accumulation in livers was assessed by chloroacetate esterase (CAE) staining as described previously (Guo et al., 2004). Paraffin-embedded sections were stained for terminal deoxynucleotidyl transferase dUTP nick-end labeling (TUNEL) using a commercially available kit (Millipore Bioscience Research Reagents, Temecula, CA). CAE and TUNEL staining were analyzed by counting CAE and TUNEL-positive cells per 1000 hepatocytes. Pathology was scored in a blinded manner by a trained pathologist; the number of necrotic or inflammatory foci (involving > 5 cells) was determined in 10 400 × fields.
Immunofluorescent Detection of Fibrin Accumulation
For immunofluorescent detection of fibrin deposition, sections of frozen liver (6-µm thick) were fixed in 10% buffered formalin containing 2% acetic acid for 30 min at room temperature; this acid step solubilizes all but cross-linked fibrin. Sections were blocked with PBS containing 10% horse serum (Pierce, Rockford, IL) for 30 min, followed by incubation overnight at 4°C with affinity purified rabbit anti-human fibrinogen IgG (Dako North America, Inc., Carpinteria, CA) diluted in blocking solution. Sections were washed three times for 5 min each with PBS and incubated for 3 h with donkey anti-rabbit antibody conjugated to Alexa 488 (Invitrogen, Carlsbad, CA). Sections were washed with PBS and visualized using a confocal microscope (Zeiss Axiovert 100 LSM 510; Carl Zeiss Inc., Thornwood, NY) and LSM 510 software. No staining was observed in controls for which the primary or secondary antibody was excluded from the staining protocol. Liver sections from all treatment groups were stained at the same time.
RNA Isolation and Real-Time RT-Polymerase Chain Reaction
RNA extraction and real-time RT-PCR were performed as described previously (Bergheim et al., 2006a). PCR primers and probes were designed using Primer 3 (Whitehead Institute for Biomedical Research, Cambridge, MA). Primers were designed to cross introns to ensure that only cDNA and not genomic DNA was amplified (Table 1). Primers and probes for GLUT-1, GLUT-4, and intercellular adhesion molecule-1 were purchased as a kit (Applied Biosystems, Foster City, CA). The amplification reactions were carried out in the ABI Prism 7700 sequence detection system (Applied Biosystems). The comparative CT method was used to determine -fold differences between samples and the calibrator gene (β-actin), and purity of PCR products was verified by gel electrophoresis. The comparative CT method determines the amount of target, normalized to an endogenous reference (β-actin) and relative to a calibrator (2−ΔΔCt).
Table 1.
Primers and probes used for real-time RT-PCR detection of expression
| Forward (3′–5′) | Reverse (3′–5′) | Probe (3′–5′) | |
|---|---|---|---|
| PAI-1 | CACCAACATTTTGGACGCTGA | TCAGTCATGCCCAGCTTCTCC | CCAGGCTGCCCCGCCTCCTC |
| TNFα | CATCTTCTCAAAATTCGAGTGACAA | CCTCCACTTGGTGGTTTGCT | CCTGTAGCCCACGTC |
| Inducible nitric-oxide synthase | GAGATTGGAGGCCTTGTGTCA | TCAAGCACCTCCAGGAACGT | ACTGGAAGTTCAGCAAC |
| PCK-1 | CAAGGCGCTCAGCGATCT | GGAACTCTGCTCCCACCTTTC | TGATCCAGACCTTCCAA |
| G6Pase | GGAGTCTTGTCAGGCATTGCT | TGTAGATGCCCCGGATGTG | GGCTGAAACTTTCA |
| GK | CAAGCTGCACCCGAGCTT | TGTCAGCCTGCGCACACT | AGGAGCGGTTTCAC |
| β-Actin | GGCTCCCAGCACCATGAA | AGCCACCGATCCACACAGA | AAGATCATTGCTCCTCCTGAGCGCAAGTA |
Immunoblots
Liver samples were homogenized in radioimmuno-precipitation assay buffer [20 mM Tris/Cl, pH 7.5, 150 mM NaCl, 1 mM EDTA, 1 mM EGTA, 1% (w/v) Triton X-100], containing protease and phosphatase inhibitor cocktails purchased from Sigma-Aldrich. Appropriate volumes of SDS-polyacrylamide gel electrophoresis sample buffer were added to protein extracts. Samples were loaded onto SDS-poly acrylamide gels of 10% (w/v) acrylamide, followed by electrophoresis and Western blotting onto polyvinylidene difluoride membranes (Hybond P; GE Healthcare, Chalfont St. Giles, UK). Primary antibodies against phosphorylated and total ERK1/2 and JNK were used (Cell Signaling Technology Inc., Danvers, MA). Bands were visualized using an ECL kit (Pierce) and Hyperfilm (GE Healthcare). Densitometric analysis was performed using ImageQuant (GE Healthcare) software, and ratios of phosphorylated to total protein were calculated.
Statistical Analyses
Results are reported as means ± S.E.M. (n = 4–6). Analysis of variance with Bonferroni’s post hoc test or Mann-Whitney Rank Sum test was used for the determination of statistical significance among treatment groups, as appropriate. A p value less than 0.05 was selected before the study as the level of significance.
Results
Effect of Resistin on Liver Damage Caused by LPS
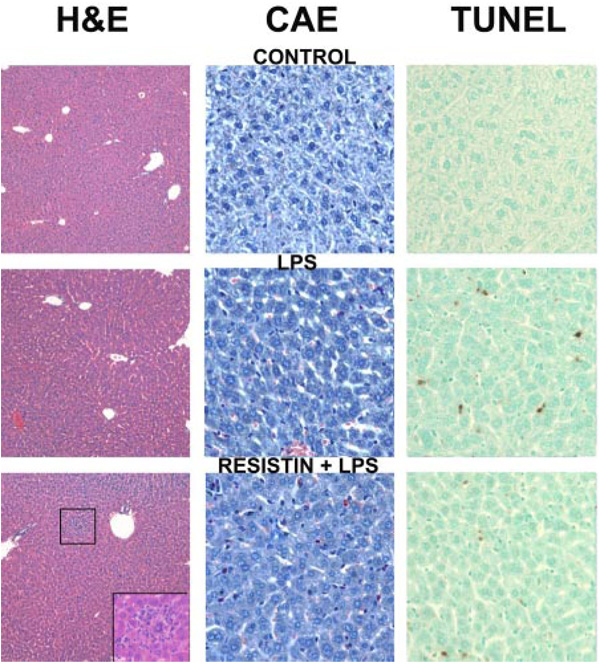
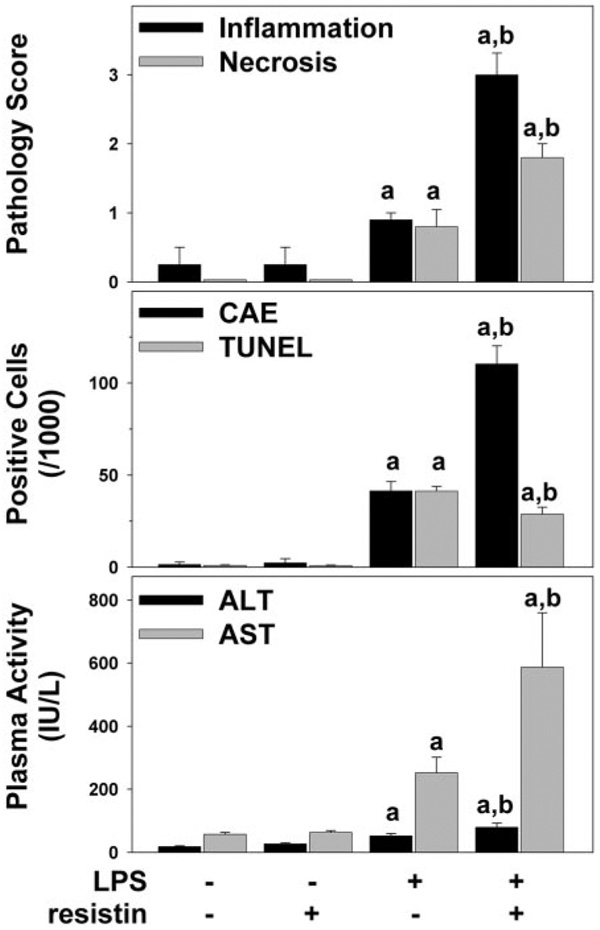
Figure 1 shows representative photomicrographs depicting liver pathology (hematoxylin and eosin stain, left column), neutrophil accumulation (chloroacetate esterase stain, center column) and indices for apoptosis (TUNEL stain, right column) 24 h after injection of LPS ± resistin. No pathological changes were observed in liver tissue after injection with saline or resistin alone, and livers from mice that received saline injections are shown to represent both groups (Fig. 1, top). LPS at this dose caused no macroscopic changes to liver (Fig. 1, left column, middle) but caused a small, but significant (Fig. 2, top panel), increase in oncotic and/or inflammatory foci; these lesions were located predominantly in the midzonal region and encompassed small areas (<10 cells). LPS injection also increased the number of infiltrating neutrophils (Fig. 1, middle column, middle) ~40-fold (Fig. 2, middle). The combined injection of resistin with LPS increased hepatic damage in liver, with necroinflammatory foci now detectable macroscopically (Fig. 1, bottom left, inset). Resistin also significantly enhanced the effect of LPS on the recruitment of neutrophils to the liver ~2.5-fold (Fig. 2, middle). This effect is also in line with the observed increase in the pathology scores under these conditions (Fig. 2, top panel). Livers were stained for TUNEL-positive cells (see Materials and Methods) as an index of apoptosis (Fig. 1, right column). Few TUNEL-positive cells were observed in liver tissue after injection with saline or resistin alone (Fig. 1, right column, top). As expected, LPS alone caused a robust (~40-fold, Fig. 2, middle) increase in TUNEL-positive cells in liver (Fig. 1, right column, middle). Resistin significantly attenuated the increase in TUNEL-positive cells caused by LPS (Fig. 1, right column, bottom) by ~30% (Fig. 2, middle).
Fig. 1.
Photomicrographs of livers 24 h after LPS and/or resistin injection. Representative photomicrographs of hematoxylin and eosin (H&E), 200× (left); CAE, 400× (center); and TUNEL, 400× (right) stains are shown. Livers from mice that received saline injections are shown to represent both saline- and resistin-treated animals. Inset, bottom left, necroinflammatory area in the resistin/LPS group.
Fig. 2.
Plasma transaminase levels and quantitation of histological changes 24 h after LPS and/or resistin injection. Mice were treated as described under Materials and Methods. Pathology was scored (top panel) as described under Materials and Methods. CAE-positive cells (middle, black bars) and TUNEL-positive cells (middle, gray bars) were quantitated as described under Materials and Methods. ALT (bottom, black bars) and AST (bottom, gray bars) were determined in plasma samples for the 24-h time point. Data are means ± S.E.M. (n = 4–6) and are reported as -fold of control values. a, p < 0.05 compared with the absence of LPS; b, p < 0.05 compared with the absence of resistin.
Plasma levels of indices of liver damage (AST, ALT) were within normal ranges in saline-treated mice (Fig. 2, bottom). Resistin alone did not alter AST and ALT levels compared with sham-treated animals at any time point. LPS injection alone significantly increased the plasma transaminases activity 8 (AST, 88 ± 12 IU/liter) and 24 (Fig. 2, bottom) h after injection. In contrast to TUNEL staining, concomitant injection of resistin significantly enhanced the increase in plasma ALT and AST caused by LPS at the 24-h time point (Fig. 2, bottom) but not at earlier time points.
Effect of Resistin on the Induction of Pro- and Anti-Inflammatory Genes Caused by LPS
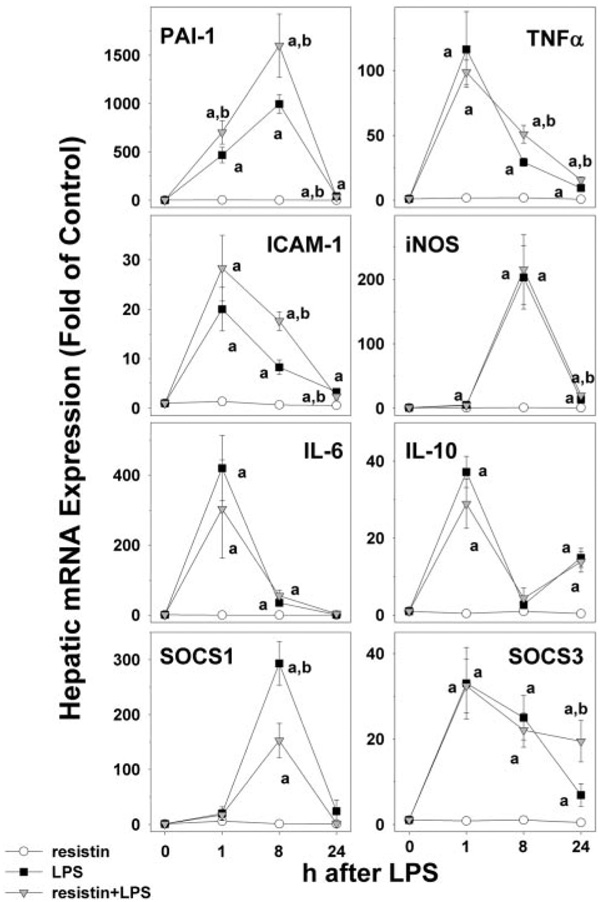
Because resistin enhanced recruitment of inflammatory cells caused by LPS (Fig. 1 and Fig. 2), its effect on hepatic expression of key proinflammatory and anti-inflammatory genes was determined by real-time RT-PCR (Fig. 3). LPS alone significantly induced the hepatic expression for all of these variables, as early as 1 h after injection, and was still elevated after 8 h. Twenty-four hours after LPS injection, the expression of these genes was returning to baseline. Although it had no significant effect in the absence of LPS, resistin significantly enhanced the increase in expression of some of these genes. For example, resistin significantly increased the induction of PAI-1 as early as 1 h after injection (Fig. 3, top left panel). Although it had no significant effect on the peak expression caused by LPS (1 h), resistin coexposure blunted the rate at which expression returned to baseline for TNFα (Fig. 3, top right) and intercellular adhesion molecule-1 (second row, left). In contrast to the above-mentioned genes, resistin coexposure had no significant effect on the increase in expression of inducible nitric oxide synthase and interleukin-6 caused by LPS. Resistin alone had no significant effect on the expression of interleukin-10, SOCS1, and SOCS3 in liver (Fig. 3). Analogous to the induction of proinflammatory genes, LPS alone also significantly increased hepatic expression of these anti-inflammatory genes. Resistin altered the expression of SOCS1 (Fig. 3, bottom left) under these conditions, halving the peak in expression observed 8 h after LPS (Fig. 3, bottom left). Furthermore, expression levels of SOCS3 were ~3-fold higher in livers from resistin/LPS compared with LPS alone (Fig. 3, bottom left).
Fig. 3.
Effect of resistin and LPS on the expression of proinflammatory and antiinflammatory genes in mouse liver. Real-Time RT-PCR results for the 0-, 1-, 8-, and 24-h time points were normalized to β-actin. Data represent means ± S.E.M. (n = 4–6). a, p < 0.05 compared with the absence of LPS; b, p < 0.05 compared with the absence of resistin.
Effect of LPS and Resistin on the Activation of ERK and JNK
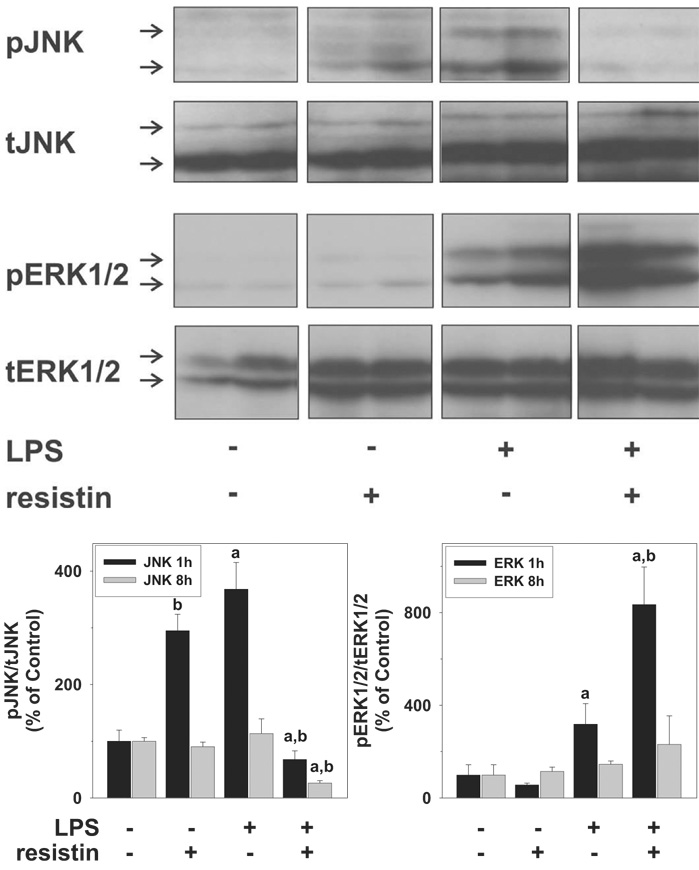
Mitogen-activated protein kinase signaling cascades are involved in cellular proliferation, inflammation, as well as apoptotic cell death (Shaw and Xu, 2003). Furthermore, JNK and ERK1/2 are known upstream inducers of PAI-1 (Vayalil et al., 2007; Wickert et al., 2007). The effects of LPS and resistin on the phosphorylation (activation) status of JNK (p46/p54) and ERK (p42/p44) were therefore performed; representative blots (1 h) and image analysis (1 and 8 h) are shown in Fig. 4. Resistin alone significantly enhanced the phosphorylation status of JNK ~3-fold but returned to baseline values after 8 h. LPS alone caused a similar pattern of JNK phosphorylation as resistin alone. In contrast to the effects of resistin or LPS alone, the combination of these two compounds caused a significant inhibition of JNK phosphorylation, both 1 and 8 h after LPS. Resistin alone did not significantly enhance ERK phosphorylation at any time point. However, the increase in ERK phosphorylation caused by LPS (at 1 h) was robustly enhanced by injection of resistin. The activation status of JNK and ERK at the 24-h time point was not significantly different from baseline, regardless of treatment group (data not shown).
Fig. 4.
Effect of resistin and LPS on the activation of mitogen-activated protein kinases ERK1/2 and JNK in mouse liver. The top panels depict representative bands from the same blot of ERK1/2 (p42/p44) and JNK (p46/p54) of the 1-h time point, and the bottom panel summarizes densitometric analysis of the 1- and 8-h time points. Data are means ± S.E.M. (n = 4–6) and are reported as -fold of control values. a, p < 0.05 compared with the absence of LPS;b, p < 0.05 compared with the absence of resistin.
Effect of Resistin and LPS on the Expression of Glucose Metabolism Regulatory Genes in Mice
One mechanism by which resistin may alter the hepatic response to LPS is by causing insulin resistance (Steppan et al., 2001b). Therefore, the effect of resistin on insulin-responsive genes involved in carbohydrate metabolism (GLUT-4, GK, PCK-1, G6Pase) was determined in mice via real-time RT-PCR (Table 2). With the exception of a slight decrease in PCK-1 expression 24 h after injection (Table 2), resistin alone had no significant effect on the expression of these genes. LPS injection significantly down-regulated the expression of all of these genes, with this effect initiating as early as 8 h after injection. With the exception of a transient increase in GK expression at the 1-h time point (Table 2), resistin did not significantly affect the changes in expression caused by LPS.
Table 2. Effect of LPS and resistin on the expression of key insulin-responsive genes.
Animals and treatments are described under Materials and Methods. Real-time RT-PCR was performed as described under Materials and Methods, and results were normalized to (β-actin. Data are means ± S.E.M. (n = 4–6) and are reported as -fold of control values.
| 1 h after Injection |
8 h after Injection |
24 h after Injection |
|||||||
|---|---|---|---|---|---|---|---|---|---|
| R | LPS | R + LPS | R | LPS | R + LPS | R | LPS | R + LPS | |
| GLUT-4 | 0.9 ± 0.2 | 0.7 ± 0.3 | 1.0 ± 0.2 | 2.3 ± 1.0 | 0.3 ± 0.2a | 0.2 ± 0.1a | 1.0 ± 0.1 | 0.2 ± 0.04a | 0.2 ± 0.03a |
| GK | 0.6 ± 0.1 | 1.2 ± 0.5 | 2.6 ± 0.6ab | 0.7 ± 0.2 | 0.03 ± 0.01a | 0.04 ± 0.01a | 0.6 ± 0.06 | 0.1 ± 0.03a | 0.1 ± 0.02a |
| PCK-1 | 0.8 ± 0.2 | 2.6 ± 0.7a | 2.8 ± 0.7a | 1.1 ± 0.2 | 0.3 ± 0.1a | 0.5 ± 0.1a | 0.5 ± 0.1 | 1.7 ± 0.3a | 1.8 ± 0.7a |
| G6Pase | 1.3 ± 0.2 | 2.3 ± 0.6a | 1.3 ± 0.5 | 0.9 ± 0.3 | 0.02 ± 0.01a | 0.04 ± 0.1a | 1.6 ± 0.5 | 0.4 ± 0.1a | 0.3 ± 0.07a |
R, resistin.
p < 0.05 compared with the absence of LPS.
p < 0.05 compared with the absence of resistin.
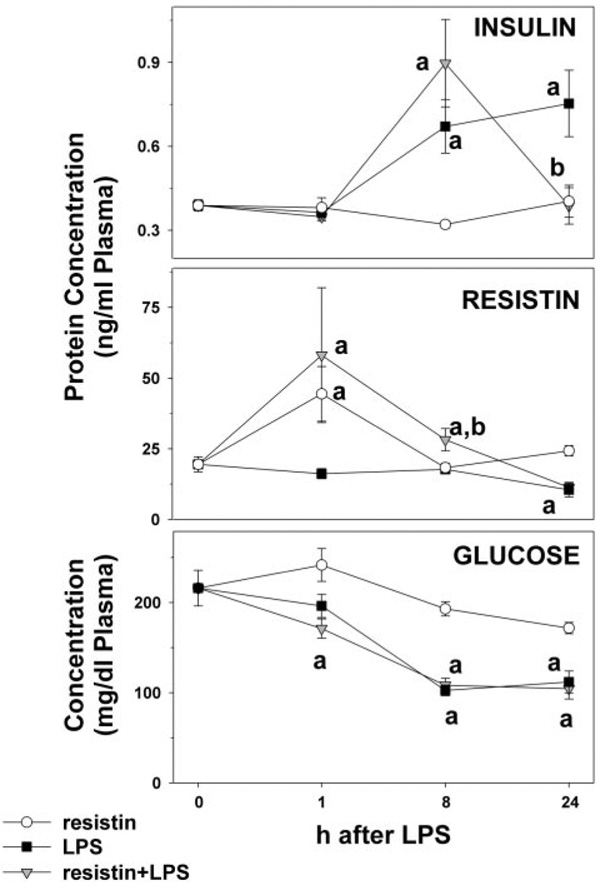
In addition to determining the expression level of insulin-responsive genes, plasma levels of insulin, resistin, and glucose were determined (Fig. 5). No significant changes in plasma insulin levels were observed 1 h after injection. Resistin alone did not alter plasma insulin levels. Injection of LPS caused an increase in the plasma levels of insulin after 8 and 24 h; this increase caused by LPS was significantly blunted by resistin at the 24-h time point. LPS alone caused a significant 2-fold decrease in plasma resistin levels 24 h after injection. Resistin levels in animals administered exogenous resistin were significantly elevated 1 h after injection, which probably represents the exogenous protein rather than de novo synthesis. Although plasma resistin levels were not significantly affected by injection of LPS, the combination of LPS and resistin caused a ~50% increase in resistin levels 8 h after injection. Resistin did not alter the effect of LPS at the 24-h time point (Fig. 5). Resistin alone did not alter plasma glucose levels. LPS alone decreased plasma glucose levels ~50% 8 h after injection. Coadministration of LPS and resistin did not significantly alter the decrease in glucose caused by LPS alone.
Fig. 5.
Effect of LPS and resistin on plasma levels of insulin and resistin. Mice received injections with resistin, resistin + LPS, or saline as described under Materials and Methods. Protein concentrations of insulin (top panel) and resistin (middle) as well as plasma glucose (bottom) were determined. Assays were performed as described under Materials and Methods. Data are means ± S.E.M. (n = 4–6). a, p < 0.05 compared with the absence of LPS; b, p < 0.05 compared with the absence of resistin.
Effect of LPS and Resistin on Hepatic Fibrin Deposition
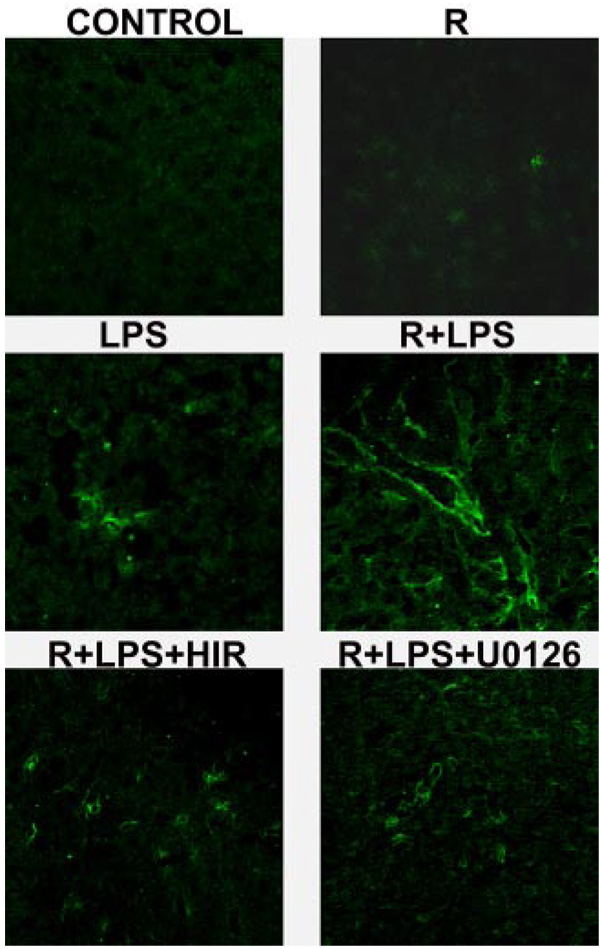
The earliest gene whose expression to LPS was enhanced by resistin was PAI-1 (Fig. 3, top left), and this effect was coupled with an increase in ERK1/2 phosphorylation (Fig. 4), a known upstream inducer of PAI-1 (Hamaguchi et al., 2003). Previous studies have shown that induction of PAI-1 expression can cause fibrin accumulation under conditions in which the coagulation cascade is already activated (e.g., after LPS injection); the resulting hemostasis could exacerbate liver damage (Hewett and Roth, 1995; Bergheim et al., 2006b). The effect of LPS and resistin on hepatic fibrin deposition was therefore determined by confocal microscopy (Fig. 6). LPS alone caused fibrin deposition in sinusoidal spaces of the liver lobule (Fig. 6, middle left). Injection with resistin alone caused a small increase in fibrin deposition. Resistin injection dramatically exacerbated deposition of fibrin caused by LPS (Fig. 6, middle right).
Fig. 6.
Effect of resistin and LPS on fibrin deposition 24 h after injection. Representative confocal photomicrographs (400×) depicting immunofluorescent detection of hepatic fibrin are shown.
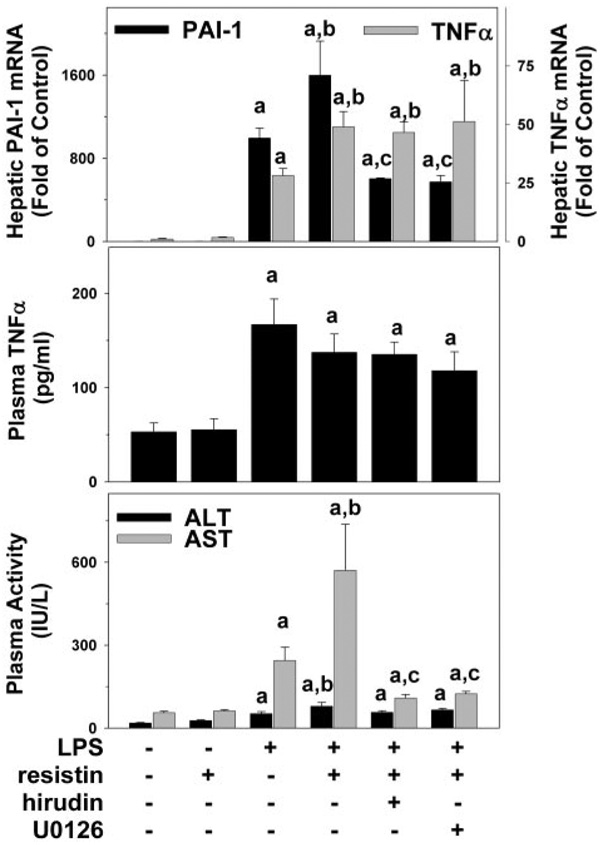
Blocking of the coagulation cascade with the selective thrombin inhibitor hirudin completely prevented the increase in fibrin accumulation (Fig. 6, bottom left panel) and liver damage caused by resistin after LPS injection, with transaminases values similar to that of LPS alone (Fig. 7, bottom panel). Likewise, coadministration of the MEK inhibitor, U0126, blocked fibrin accumulation and liver damage caused by resistin in the presence of LPS (Fig. 6 and Fig. 7, bottom panel) at the 24-h time point. Furthermore, hirudin and U0126 prevented the increase in PAI-1 expression caused by resistin in the presence of LPS at the peak time point (8 h; Fig. 7, top panel). In contrast, hepatic expression of TNFα (Fig. 7, top panel) was not affected by U0126 or hirudin at this time point.
Fig. 7.
Effect of Hirudin and U0126 on resistin and LPS-induced PAI-1 expression and liver damage. Mice received injections with resistin, resistin + LPS, or saline as described under Materials and Methods. Realtime RT-PCR (top panel), ELISA for TNFα protein (middle), and spectrophotometric determination of ALT/AST were performed as described under Materials and Methods. Data are means ± S.E.M. (n = 4–6). PCR data are reported as -fold of control values. a, p < 0.05 compared with the absence of LPS; b, p < 0.05 compared with the absence of resistin;c, p < 0.05 compared with the absence of hirudin or U0126. PAI-1 data for control, LPS, and resistin + LPS are derived from Fig. 3 and shown here for comparison. Transaminase data for control, LPS, and resistin + LPS are derived from Fig. 2 and shown here for comparison.
Discussion
Resistin Enhances Inflammatory Damage in Mouse Liver
The major findings of this study indicate that resistin enhances inflammation and liver injury because of a bolus injection of LPS. In particular, it was shown that resistin enhances inflammatory cell recruitment and liver damage caused by LPS (Fig. 1 and Fig. 2). Exposure of the liver to low levels of LPS is common and occurs through multiple means, including increased LPS translocation from the intestinal lumen into the portal venous blood (Ganey and Roth, 2001). LPS administration is also an experimental model of infection and inflammation, which also induces insulin resistance in rodents (Virkamaki and Yki-Jarvinen, 1994; Rajala et al., 2002; Sugita et al., 2002). This model was therefore selected to test our hypotheses because it combines both inflammation and insulin resistance. Inflammatory responses triggered by small doses of LPS are typically noninjurious, but physiological/biochemical changes that are alone pathologically inert can synergistically enhance the hepatotoxic response to a subsequent stimulus. For example, simple steatosis greatly enhances liver damage caused by a subsequent LPS injection (Yang et al., 1997).
As mentioned in the Introduction, resistin has been proposed to potentially enhance inflammation in humans, but the mechanisms by which it mediates these effects are unclear. In rodents, the primary effect of resistin has been to cause insulin resistance. However, whether or not resistin mediates species-specific effects is unclear; indeed, whether or not resistin is proinflammatory in rodents has not been specifically tested. Therefore, the effect of resistin alone and in combination with LPS on key mediators of these processes was determined. Acute bolus exposure of resistin was therefore used to here to avoid secondary effects of the peptide in vivo (e.g., via insulin resistance) and to focus on primary effects. Chronic resistin treatment would probably exacerbate the effects seen under acute conditions. Although acute resistin had no effect on inflammatory gene expression in the absence of LPS, the expression induced by LPS for many of these genes was enhanced by resistin (Fig. 3). Resistin also attenuated the increase in expression of the anti-inflammatory mediator SOCS1 caused by LPS (Fig. 3). However, most of the genes affected by resistin under these conditions had a delayed response, peaking 8 to 24 h after LPS. Therefore, it is unclear whether these effects of resistin are primary or secondary to earlier changes. However, resistin did enhance the increase in PAI-1 expression caused by LPS as early as 1 h after injection (Fig. 3); this effect was coupled with enhanced activation of ERK1/2 (Fig. 4), a known upstream inducer of PAI-1 (Hamaguchi et al., 2003). Although JNK is also a mediator of the induction of PAI-1 expression, its activation by LPS injection was actually inhibited by resistin under these conditions (Fig. 4); therefore, this early induction of PAI-1 is unlikely to be mediated by the JNK pathway. PAI-1 induction may contribute to the indirect increase in the other proinflammatory genes under these conditions by inducing hemostasis (see below).
An interesting finding in this study was that although liver cell death (as determined by transaminases production; Fig. 2) because of LPS was enhanced by resistin, TUNEL staining (an index of apoptosis; Fig. 1) was actually decreased under these conditions. Indices of death via apoptosis and via necrosis often increase in tandem in models of liver damage, indicative that both mechanisms of cell death are induced. However, biochemical changes within the cell may favor one mechanism of cell death over another. For example, the activation of JNK (Xia et al., 1995; Verheij et al., 1996) caused by LPS was profoundly inhibited by resistin (see Fig. 4), which may blunt cell death via apoptosis. Second, even when early stages of apoptotic signaling are not impaired, low cellular energy levels may prevent the completion of the apoptotic signaling cascade, resulting in secondary necrosis (sometimes coined “necroptosis”; Malhi et al., 2006). A similar imbalance between increases in apoptosis and necrosis was observed by Koteish et al. (2002) in a model of enhanced LPS-induced liver damage caused by chronic ethanol exposure. In particular, the authors of that study found that ethanol enhances LPS-induced necrosis but blunts apoptosis (Fig. 1), concomitant with inhibition of JNK (Fig. 4) activation. Such an effect is often the hallmark of frank (or oncotic) necrosis (for review, see Malhi et al., 2006).
Resistin Enhances LPS-induced Liver Damage Independent of Changes in Glucose Metabolism
In contrast to the effect of resistin on genes mediating inflammation, the expression of genes involved in glucose metabolism (Table 2) was largely unaltered by resistin. These genes (Glut-4, GK, PCK-1, and G6Pase) are all regulated by insulin, and alterations in the pattern of expression of these genes serve as surrogate markers of insulin signaling. Furthermore, with the exception of blunting the increase in plasma insulin levels caused by LPS at the 24-h time point, resistin had no significant effect on insulin or glucose under these conditions. This is in line with previous work by others in which no alteration in plasma insulin or glucose levels was observed after giving mice injections with 0.1 to 20 mg/kg resistin (Ort et al., 2005). Taken together, these results suggest that the effect of resistin on liver damage caused by LPS is unlikely to be mediated by insulin resistance per se. Previous studies have shown that administration of resistin (or transgenic overexpression) induces insulin resistance (Holcomb et al., 2000; Steppan et al., 2001b); the difference between those studies and the current work may be explained by the differences in the length of exposure to resistin. In previous work, cultured monocytes/macrophages exposed to LPS increased their expression of resistin (Lu et al., 2002; Kaser et al., 2003). LPS here caused no detectable increase in circulating resistin in the mouse. This apparent discrepancy may be because of differences in the models employed, such as the relative dose of LPS or the dilution of the resistin signal by the circulation, rather than mechanistic differences, per se. Future studies should address these points.
Does Resistin Enhance Hemostasis Caused by LPS?
Previous studies have shown that the coagulation system is activated by LPS (Hewett and Roth, 1995) and that fibrin accumulates in the liver (Takeuchi et al., 1994). In addition to activating fibrin deposition, lipopolysaccharide also induces expression of inhibitors of fibrinolysis (e.g., PAI-1; Fig. 3). Elevated PAI-1 and hepatic fibrin have been correlated with enhanced LPS-induced liver damage in other models, such as idiosyncratic drug toxicity (Luyendyk et al., 2004) or surgical resection (Bergheim et al., 2006b). It has been hypothesized that increased fibrin deposition because of a PAI-1-induced decrease in fibrinolysis causes hemostasis and microregional hypoxia, leading to hepatocellular death (Ganey et al., 2004). The “classic” role of PAI-1 in impairing fibrinolysis may also contribute to inflammation. For example, fibrin matrices have been shown to be permissive to chemotaxis and activation of monocytes and leukocytes (Holdsworth et al., 1979; Loike et al., 1995).
It is proposed here that a similar mechanism is responsible, at least in part, for enhanced LPS-induced liver damage caused by resistin. In general, the enhancement by resistin on the expression of PAI-1 caused by LPS was significantly attenuated (~3-fold) with hirudin or with U0126 administration (Fig. 6). The protective effect of these drugs on PAI-1 expression was also mirrored by prevention of fibrin accumulation (Fig. 7) and liver damage (Fig. 6) under these conditions, which supports the hypothesis that exacerbated LPS-induced liver injury caused by resistin is because of increased fibrin deposition. Both hirudin and U0126 may also decrease PAI-1 via other means. For example, ERK1/2 is known to be critical for TNFα expression after LPS; thus, U0126 may blunt PAI-1 expression by inhibiting the expression of TNFα, which is a known potent inducer of PAI-1. The finding that U0126 and hirudin did not significantly alter TNFα expression or plasma protein (Fig. 7) partially alleviates this concern. It nevertheless cannot be completely ruled out that other mediators that are blunted by U0126 or hirudin may play a role in the protective effects observed here.
Taken together, the results of this study identify a new potential mechanism by which the adipocytokine resistin may contribute to inflammatory liver damage. In general, via enhancing the induction of PAI-1 and thereby impairing fibrinolysis, resistin exacerbates inflammatory liver damage caused by LPS. Although an effect of resistin on insulin signaling cannot be completely dismissed under these conditions, many of the changes caused by resistin occurred before any significant alterations in the expression of insulin-responsive genes. Given the fact that insulin resistance is known to indirectly cause inflammation via numerous mechanisms potentially independent of resistin (e.g., oxidative stress, glucose toxicity, etc.), the inflammation observed here acutely would probably be exacerbated under chronic conditions of insulin resistance. Previous work by others has identified that resistin is proinflammatory in a mouse model of arthritis (Bokarewa et al., 2005). The results of the current study support the hypothesis that resistin may also mediate hepatic inflammation independent of its effect on insulin signaling, analogous to its proposed function in humans.
Acknowledgments
This study was supported by a grant from the National Institute of Alcohol Abuse and Alcoholism. J.P.K. was supported by Predoctoral Fellowship F31 from the National Institute of Alcohol Abuse and Alcoholism.
ABBREVIATIONS
- TNF
tumor necrosis factor
- LPS
lipopolysaccharide
- U0126
1,4-diamino-2,3-dicyano-1,4-bis(2-aminophenylthio) butadiene
- ALT
alanine aminotransferase
- AST
aspartate aminotransferase
- ELISA
enzyme-linked immunosorbent assay
- CAE
chloroacetate esterase
- TUNEL
terminal deoxynucleotidyl transferase dUTP nick-end labeling
- PBS
phosphate-buffered saline
- RT
reverse transcription
- PCR
polymerase chain reaction
- GLUT
glucose transporter
- CT
threshold cycle
- ERK
extracellular signal-regulated kinase
- JNK
c-Jun NH2-terminal kinase
- PAI
plasminogen activator inhibitor
- SOCS
suppressor of cytokine signaling
- PCK
phosphoenolpyruvate carboxykinase
- G6Pase
glucose-6-phosphatase
- GK
glucokinase
References
- Banerjee RR, Rangwala SM, Shapiro JS, Rich AS, Rhoades B, Qi Y, Wang J, Rajala MW, Pocai A, Scherer PE, et al. Regulation of fasted blood glucose by resistin. Science. 2004;303:1195–1198. doi: 10.1126/science.1092341. [DOI] [PubMed] [Google Scholar]
- Bergheim I, Guo L, Davis MA, Lambert JC, Beier JI, Duveau I, Luyendyk JP, Roth RA, Arteel GE. Metformin prevents alcohol-induced liver injury in the mouse: critical role of plasminogen activator inhibitor-1. Gastroenterology. 2006a;130:2099–2112. doi: 10.1053/j.gastro.2006.03.020. [DOI] [PMC free article] [PubMed] [Google Scholar]
- Bergheim I, Luyendyk JP, Steele C, Russell GK, Guo L, Roth RA, Arteel GE. Metformin prevents endotoxin-induced liver injury after partial hepatectomy. J Pharmacol Exp Ther. 2006b;316:1053–1061. doi: 10.1124/jpet.105.092122. [DOI] [PubMed] [Google Scholar]
- Bertolani C, Sancho-Bru P, Failli P, Bataller R, Aleffi S, DeFranco R, Mazzinghi B, Romagnani P, Milani S, Gines P, et al. Resistin as an intrahepatic cytokine: overexpression during chronic injury and induction of proinflammatory actions in hepatic stellate cells. Am J Pathol. 2006;169:2042–2053. doi: 10.2353/ajpath.2006.060081. [DOI] [PMC free article] [PubMed] [Google Scholar]
- Bokarewa M, Nagaev I, Dahlberg L, Smith U, Tarkowski A. Resistin, an adipokine with potent proinflammatory properties. J Immunol. 2005;174:5789–5795. doi: 10.4049/jimmunol.174.9.5789. [DOI] [PubMed] [Google Scholar]
- Ganey PE, Luyendyk JP, Maddox JF, Roth RA. Adverse hepatic drug reactions: inflammatory episodes as consequence and contributor. Chem Biol Interact. 2004;150:35–51. doi: 10.1016/j.cbi.2004.09.002. [DOI] [PubMed] [Google Scholar]
- Ganey PE, Roth RA. Concurrent inflammation as a determinant of susceptibility to toxicity from xenobiotic agents. Toxicology. 2001;169:195–208. doi: 10.1016/s0300-483x(01)00523-6. [DOI] [PubMed] [Google Scholar]
- Guo L, Richardson KS, Tucker LM, Doll MA, Hein DW, Arteel GE. Role of the renin-angiotensin system in hepatic ischemia reperfusion injury in rats. Hepatology. 2004;40:583–589. doi: 10.1002/hep.20369. [DOI] [PubMed] [Google Scholar]
- Haluzik M, Haluzikova D. The role of resistin in obesity-induced insulin resistance. Curr Opin Investig Drugs. 2006;7:306–311. [PubMed] [Google Scholar]
- Hamaguchi E, Takamura T, Shimizu A, Nagai Y. Tumor necrosis factor-alpha and troglitazone regulate plasminogen activator inhibitor type 1 production through extracellular signal-regulated kinase- and nuclear factor-kappaB-dependent pathways in cultured human umbilical vein endothelial cells. J Pharmacol Exp Ther. 2003;307:987–994. doi: 10.1124/jpet.103.054346. [DOI] [PubMed] [Google Scholar]
- Hewett JA, Roth RA. The coagulation system, but not circulating fibrinogen, contributes to liver injury in rats exposed to lipopolysaccharide from gramnegative bacteria. J Pharmacol Exp Ther. 1995;272:53–62. [PubMed] [Google Scholar]
- Holcomb IN, Kabakoff RC, Chan B, Baker TW, Gurney A, Henzel W, Nelson C, Lowman HB, Wright BD, Skelton NJ, et al. FIZZ1, a novel cysteine-rich secreted protein associated with pulmonary inflammation, defines a new gene family. EMBO J. 2000;19:4046–4055. doi: 10.1093/emboj/19.15.4046. [DOI] [PMC free article] [PubMed] [Google Scholar]
- Holdsworth SR, Thomson NM, Glasgow EF, Atkins RC. The effect of defibrination on macrophage participation in rabbit nephrotoxic nephritis: studies using glomerular culture and electronmicroscopy. Clin Exp Immunol. 1979;37:38–43. [PMC free article] [PubMed] [Google Scholar]
- Hotamisligil GS, Shargill NS, Spiegelman BM. Adipose expression of tumor necrosis factor-alpha: direct role in obesity-linked insulin resistance. Science. 1993;259:87–91. doi: 10.1126/science.7678183. [DOI] [PubMed] [Google Scholar]
- Kaser S, Kaser A, Sandhofer A, Ebenbichler CF, Tilg H, Patsch JR. Resistin messenger-RNA expression is increased by proinflammatory cytokines in vitro. Biochem Biophys Res Commun. 2003;309:286–290. doi: 10.1016/j.bbrc.2003.07.003. [DOI] [PubMed] [Google Scholar]
- Koteish A, Yang S, Lin H, Huang X, Diehl AM. Chronic ethanol exposure potentiates lipopolysaccharide liver injury despite inhibiting Jun N-terminal kinase and caspase 3 activation. J Biol Chem. 2002;277:13037–13044. doi: 10.1074/jbc.M101632200. [DOI] [PubMed] [Google Scholar]
- Lehrke M, Reilly MP, Millington SC, Iqbal N, Rader DJ, Lazar MA. An inflammatory cascade leading to hyperresistinemia in humans. PLoS Med. 2004;1:161–168. doi: 10.1371/journal.pmed.0010045. [DOI] [PMC free article] [PubMed] [Google Scholar]
- Loike JD, el Khoury J, Cao L, Richards CP, Rascoff H, Mandeville JT, Maxfield FR, Silverstein SC. Fibrin regulates neutrophil migration in response to interleukin 8, leukotriene B4, tumor necrosis factor, and formyl-methionyl-leucyl-phenylalanine. J Exp Med. 1995;181:1763–1772. doi: 10.1084/jem.181.5.1763. [DOI] [PMC free article] [PubMed] [Google Scholar]
- Lu SC, Shieh WY, Chen CY, Hsu SC, Chen HL. Lipopolysaccharide increases resistin gene expression in vivo and in vitro. FEBS Lett. 2002;530:158–162. doi: 10.1016/s0014-5793(02)03450-6. [DOI] [PubMed] [Google Scholar]
- Luyendyk JP, Maddox JF, Green CD, Ganey PE, Roth RA. Role of hepatic fibrin in idiosyncrasy-like liver injury from lipopolysaccharide-ranitidine coexposure in rats. Hepatology. 2004;40:1342–1351. doi: 10.1002/hep.20492. [DOI] [PubMed] [Google Scholar]
- Malhi H, Gores GJ, Lemasters JJ. Apoptosis and necrosis in the liver: a tale of two deaths? Hepatology. 2006;43:S31–S44. doi: 10.1002/hep.21062. [DOI] [PubMed] [Google Scholar]
- McTernan PG, Kusminski CM, Kumar S. Resistin. Curr Opin Lipidol. 2006;17:170–175. doi: 10.1097/01.mol.0000217899.59820.9a. [DOI] [PubMed] [Google Scholar]
- Ort T, Arjona AA, MacDougall JR, Nelson PJ, Rothenberg Me, Wu F, Eisen A, Halvorsen YD. Recombinant human FIZZ3/resistin stimulates lipolysis in cultured human adipocytes, mouse adipose explants, and normal mice. Endocrinology. 2005;146:2200–2209. doi: 10.1210/en.2004-1421. [DOI] [PubMed] [Google Scholar]
- Rajala MW, Lin Y, Ranalletta M, Yang XM, Qian H, Gingerich R, Barzilai N, Scherer PE, et al. Cell type-specific expression and coregulation of murine resistin and resistin-like molecule-alpha in adipose tissue. Mol Endocrinol. 2002;16:1920–1930. doi: 10.1210/me.2002-0048. [DOI] [PubMed] [Google Scholar]
- Shaw A, Xu Q. Biomechanical stress-induced signaling in smooth muscle cells: an update. Curr Vase Pharmacol. 2003;1:41–58. doi: 10.2174/1570161033386745. [DOI] [PubMed] [Google Scholar]
- Steppan CM, Bailey ST, Bhat S, Brown EJ, Banerjee RR, Wright CM, Patel HR, Ahima RS, Lazar MA. The hormone resistin links obesity to diabetes. Nature. 2001a;409:307–312. doi: 10.1038/35053000. [DOI] [PubMed] [Google Scholar]
- Steppan CM, Brown EJ, Wright CM, Bhat S, Banerjee RR, Dai CY, Enders GH, Silberg DG, Wen X, Wu GD, et al. A family of tissue-specific resistin-like molecules. Proc Natl Acad Sci USA. 2001b;98:502–506. doi: 10.1073/pnas.98.2.502. [DOI] [PMC free article] [PubMed] [Google Scholar]
- Sugita H, Kaneki M, Tokunaga E, Sugita M, Koike C, Yasuhara S, Tompkins RG, Martyn JA. Inducible nitric oxide synthase plays a role in LPS-induced hyperglycemia and insulin resistance. Am J Physiol Endocrinol Metab. 2002;282:E386–E394. doi: 10.1152/ajpendo.00087.2001. [DOI] [PubMed] [Google Scholar]
- Takeuchi M, Nakashima Y, Miura Y, Nakagawa K, Uragoh K, Iwanaga S, Hori Y, Sueishi K. The localization of lipopolysaccharide in an endotoxemic rat liver and its relation to sinusoidal thrombogenesis: light and electron microscopic studies. Pathol Res Pract. 1994;190:1123–1133. doi: 10.1016/S0344-0338(11)80438-3. [DOI] [PubMed] [Google Scholar]
- Tsochatzis E, Papatheodoridis GV, Archimandritis AJ. The evolving role of leptin and adiponectin in chronic liver diseases. Am J Gastroenterol. 2006;101:2629–2640. doi: 10.1111/j.1572-0241.2006.00848.x. [DOI] [PubMed] [Google Scholar]
- Vayalil PK, lies KE, Choi J, Yi AK, Postlethwait EM, Liu RM. Glutathione suppresses TGF-beta-induced PAI-1 expression by inhibiting p38 and JNK MAPK and the binding of AP-1, SP-1, and Smad to the PAI-1 promoter. Am J Physiol Lung Cell Mol Physiol. 2007;293:L1281–L1292. doi: 10.1152/ajplung.00128.2007. [DOI] [PMC free article] [PubMed] [Google Scholar]
- Verheij M, Bose R, Lin XH, Yao B, Jarvis WD, Grant S, Birrer MJ, Szabo E, Zon LI, Kyriakis JM, et al. Requirement for ceramide-initiated SAPK/JNK signalling in stress-induced apoptosis. Nature. 1996;380:75–79. doi: 10.1038/380075a0. [DOI] [PubMed] [Google Scholar]
- VirkamäkiA, Yki-Jarvinen H. Mechanisms of insulin resistance during acute endotoxemia. Endocrinology. 1994;134:2072–2078. doi: 10.1210/endo.134.5.8156907. [DOI] [PubMed] [Google Scholar]
- Wickert L, Chatain N, Kruschinsky K, Gressner AM. Glucocorticoids activate TGF-beta induced PAI-1 and CTGF expression in rat hepatocytes. Comp Hepatol. 2007;6:5. doi: 10.1186/1476-5926-6-5. [DOI] [PMC free article] [PubMed] [Google Scholar]
- Xia Z, Dickens M, Raingeaud J, Davis RJ, Greenberg ME. Opposing effects of ERK and JNK-p38 MAP kinases on apoptosis. Science. 1995;270:1326–1331. doi: 10.1126/science.270.5240.1326. [DOI] [PubMed] [Google Scholar]
- Yang SQ, Lin HZ, Lane MD, Clemens M, Diehl AM. Obesity increases sensitivity to endotoxin liver injury: implications for the pathogenesis of steatohepatitis. Proc Natl Acad Sci U S A. 1997;94:2557–2562. doi: 10.1073/pnas.94.6.2557. [DOI] [PMC free article] [PubMed] [Google Scholar]
- Youn BS, Yu KY, Park HJ, Lee NS, Min SS, Youn MY, Cho YM, Park YJ, Kim SY, Lee HK, et al. Plasma resistin concentrations measured by enzyme-linked immunosorbent assay using a newly developed monoclonal antibody are elevated in individuals with type 2 diabetes mellitus. J Clin Endocrinol Metab. 2004;89:150–156. doi: 10.1210/jc.2003-031121. [DOI] [PubMed] [Google Scholar]


