Abstract
Rationale and Objectives
Our previous scan regularized reconstruction (PSRR) method is proposed to reduce radiation dose and applied for lung perfusion studies. The normal and ultra-low dose lung CT perfusion studies are compared in terms of estimation accuracy of pulmonary functional parameters.
Materials and Methods
A sequences of sheep lung scans were performed in three prone, anesthetized sheep at normal and ultra-low doses. A scan protocol was developed for the ultra-low dose studies with ECG gating - time point one for a normal x-ray dose scan (100kV/150mAs) and time points 2–21 for low dose scans (80kV/17mAs). A nonlinear diffusion-based post-filtering (NDPF) method was applied to the difference images between the low-dose images and the high-quality reference image. The final images at 20 time points were generated by fusing the reference image with the filtered difference images.
Results
The power spectra of perfusion images and coherences with the normal scans show a great improvement in image quality of the ultra-low dose scans with PSRR relative to that without RSRR. The Gamma variate-fitting and the repeatability of the measurements of the mean transit time demonstrate that the key parameters of lung functions can be reliably accessed using PSRR. The variability of the ultra-low dose scan results obtained using PSRR is not substantially different from that between two normal dose scans.
Conclusions
Our studies have shown that a ~90% reduction in radiation dose is achievable using PSRR without compromising the quantitative CT measurements of regional lung functions.
Keywords: Dose reduction, ultra-low dose, lung CT perfusion, previous scan regularized reconstruction (PSRR), diffusion-based post-filtering
I. Introduction
Worldwide there are growing concerns on radiation induced genetic, cancerous and other diseases [1–3]. CT is considered as a radiation-intensive procedure, yet becoming more and more common. In the mid-1990s, CT scans only accounted for 4% of the total x-ray procedures but they contributed 40% of the collective dose [4]. The introduction of helical, multi-slice and cone-beam technologies have increased and continue increasing the usage of CT. In US, the number of CT examinations performed has been estimated to be as high as nearly 60 million, and account for 15% of imaging procedures and 75% of the radiation exposure in 2002 [4]. As much as 30% of individuals undergoing one CT will have a total of at least 3 examinations, and over 90% of abdominal/pelvic CT studies use 2 or more CT scans [5]. A British study has quantified the cancer risk from diagnostic x-rays, in which radiation from medical and dental scans is thought to cause about 700 cases of cancer per year in Britain and more than 5,600 cases in US [2]. On June 19, 2007, the New York Times reported that “the per-capita dose of ionizing radiation from clinical imaging exams in the U.S. increased almost 600% from 1980 to 2006”. More recently, in a high-profile article on the rapid growth in CT use and its associated radiation risks [3], Brenner et al. estimated that “on the basis of such risk estimates and data on CT use from 1991 through 1996, it was estimated that about 0.4% of all cancers in the United States may be attributable to the radiation from CT studies. By adjusting this estimate for current CT use, this estimate might now be in the range of 1.5 to 2.0%.”
Facing the increasing radiation risk, the well-known ALARA (As Low As Reasonably Achievable) principle is widely accepted in the medical community. While eliminating unnecessary CT examinations and optimizing CT protocols are important steps in minimizing radiation exposure, a number of dose reduction techniques have been developed. These include mAs reduction methods, tube current modulation schemes [6, 7], and a highly constrained backprojection (HYPR) reconstruction method [8, 9]. Operator-specified mAs reduction for small patients is prone to errors, which could conceivably increase patient dose if a study is repeated. More importantly, radiologists dislike CT images with increased noise due to reduced mAs. The tube current modulation approach uses information from either a scout view or a current scan view to change the tube current dynamically during the scan, reducing the mAs for thin body sections and increasing mAs for thick sections. This strategy allows dose reduction up to 30–40% for typical elliptical body sections. However, the gain diminishes for circular body sections. The HYPR method is a new technique for reconstruction of sparse, highly-undersampled time-resolved image data. This method originally was developed for magnetic resonance imaging and now is adapted for CT [8, 9]. To our best knowledge, all the current low dose algorithms were developed to extract as much information as possible only from a low dose dataset of a patient/animal [10, 11], without utilization of detailed prior knowledge in a previous scan of the same patient/animal.
As the number of CT applications is exponentially growing, there are several major scenarios for ultra-low dose scans: mass screening of diseases with high mortality (such as coronary artery disease, lung and colon cancers), pathology analysis and treatment monitoring over long time, as well as functional imaging (blood flow, ventilation and regional mechanics). The CT screening results usually lead to follow-up exams to assess features in detail and changes in suspicious lesions. In a cancer screening program, up to 70% of the individuals will have nodules found which must be followed since 1–5% of them will suffer from malignant nodules. Also, CT is used for comprehensive assessment of the cardiac and lung functions using a combination of scanning protocols. For example, retrospective cardiac CT methods [12, 13] require reduction of pitch down to as low as 0.1 from a typical 1.0–2.0 range. In the case of micro-CT, in addition to the low-dose reasons for medical CT, low dose micro-CT datasets are necessarily generated for in-vivo studies because of the flux limitation. Up to now, the performances of image reconstruction algorithms for low-dose CT have been fundamentally restricted by the inherent limitations of low-dose data themselves.
Here we propose an innovative approach for CT/micro-CT of a patient/animal to improve image quality dramatically at ultra-low dose by utilizing a previously acquired CT/micro-CT scan of the same patient/animal, which is called the previous scan regularized reconstruction (PSRR) method in this paper. The major idea of PSRR is to identify and keep any substantial changes in an ultra-low dose dataset as well as extract and use unchanged features in the previously acquired normal dose dataset. This method can reduce radiation dose significantly for CT studies which require repeated scans such as in the aforementioned scenarios. Different from the existing methods, our approach allows regularization with individualized knowledge at a detailed level.
II. Methods
2.1. Algorithm Description
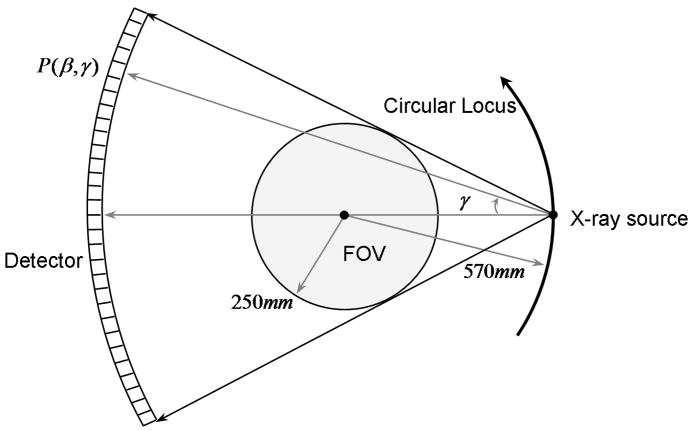
Our PSRR approach is a universally applicable strategy. Generally speaking, an ultra-low dose scan can be acquired by reducing mAs, decreasing kVp, and even lowering the number of projections as compared to a previous normal dose scan. Here we will describe a PSRR procedure in the context of a Siemens SOMATOM Sensation 16 scanner in the circular scanning mode. After the acquisition of an ultra-low dose circular scan by reducing mAs, we apply a cosine correction to convert the narrow cone-angle multi-slice dataset to a stack of fan-beam sinograms, each of which is associated with one horizontal z-slice. Once the fan-beam sinograms from the ultra-low dose scan are generated, our PSRR is performed for each z-slice in the 2D fan-beam geometry as illustrated in Figure 1. The equi-angular fan-beam sinogram can be represented as P(β, γ), where β is an angle for the source position, and γ the fan-angle for the detector location. For a full scan dataset from the Siemens SOMATOM Sensation 16 scanner, β is discretized as βi with i = 1, 2, ···1160, and γ as γj with j = 1, 2,···672. Note that the number of projections 1160 for β may be decreased for dose reduction, such as into a quarter-scan scheme in our experiment design in the next section. As shown in Figure 2, our PSRR method is performed in the image domain, and it consists of the three major components: image reconstruction, image registration and nonlinear filtering. In the following, we will describe each step in detail.
Figure 1.
Fan-beam geometry of the Siemens SOMATOM Sensation 16 scanner associated with the rotational angle β.
Figure 2.
Flowcharts for the proposed PSRR performed in the image domain.
Image Reconstruction
Let the current ultra-low dose and previous normal dose projection datasets of the same image slice be P(β,γ) and PP (β,γ), where the subscript “P” indicates the previous scan. Once P(β,γ) or PP (β, γ) are available, image reconstruction can be performed in the equi-angular fan-beam geometry as shown in Figure 1. This can be done by either the conventional filtered backprojection (FBP) algorithm or the recently developed backprojection filtration (BPF) formula [14, 15]. The reconstructed images are respectively denoted as I (x) and IP (x), where x represents an arbitrary pixel in 2D coordinates. In practice, x is sampled at grid points (xm, yn), m = 1, 2,···M and n = 1, 2, ···N. Note that the previous normal dose projection data PP(β, γ) may be scanned by a scanner different from that used to collect the current ultra-low dose data, although in this paper they are scanned by the same Siemens scanner.
Image Registration
Because the previous normal dose scan and ultra-low dose scan are not acquired simultaneously or even not scanned by the same scanner, the reconstructed images I (x) and IP (x) generally are not the same because of rigid or non-rigid object motion and other differences between the two scans. Hence, we need to register the two reconstructed images before further processing. With the ultra-low dose image I (x) as the reference, we can register the reconstructed IP (x) from the previous normal dose scan to obtain ĪP (x) (see Subsection 2.2 for detail), where the bar indicates the registration procedure. After IP (x) is transformed to ĪP (x) with I (x) as the reference, ĪP (x) and I (x) can be compared directly.
Nonlinear Filtering
The key idea behind our PSRR method is to recognize substantially changed parts in the reconstruction from the ultra-low dose scan, and replace the other parts with the corresponding features in the reconstruction from the previous normal dose scan. After the registration step, for example, we can compute the difference image ID (x) = I (x)−ĪP (x). Then, an appropriate nonlinear filtering operation is performed on ID (x) to remove image noise and identify any substantial changes (see Subsection 2.3 for detail). Assuming that the filtered difference image is ÎD(x), the final PSRR reconstruction IF (x) can be synthesized as IF (x) = ÎD (x) + ĪP (x).
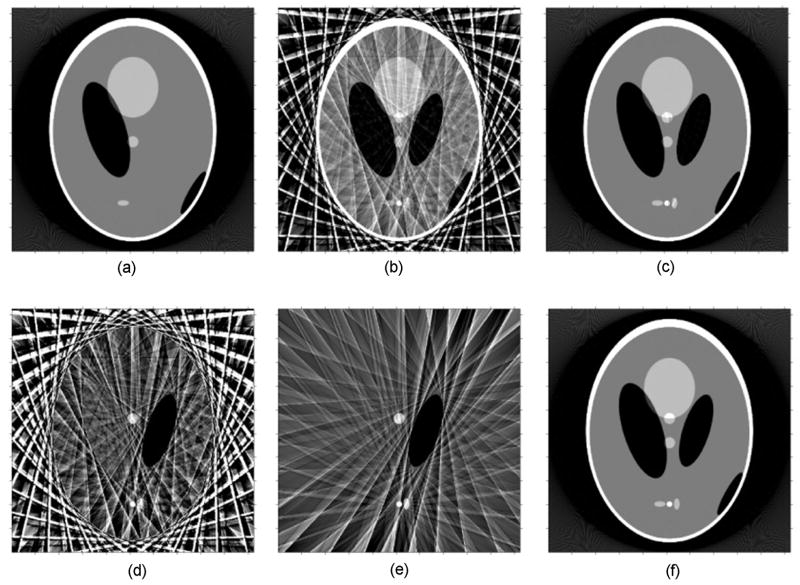
Figure 3 illustrates the basic elements of our PSRR mechanism. Three simulated projection datasets were generated from a modified Shepp-Logan phantom. The corresponding images were reconstructed to show representative intermediate results in Figure 3. Figure 3(a) is the reconstruction of a previous object status from a previous normal dose scan (1160 views and 672 lines per views), while (b) presents the reconstruction from a low-dose scan (29 views only), (c) the reconstruction of the current object status from a current normal dose scan serving as the gold standard, (d) the difference between (a) and (b), (e) the filtered difference image, and finally (f) the image reconstructed using PSRR from the current ultra-low dose scan regularized by (a). It can be observed that the PSRR image (f) (using only 1/40 normal dose) is very close to the normal dose reconstruction (c). This comparison reveals a major advantage of our proposed PSRR approach. Note that the registration component is not included in this illustrative example.
Figure 3.
Demonstration of the PSRR mechanism, (a) A reconstruction from a previous normal dose scan, (b) a counterpart from a current ultra-low dose scan, (c) a normal dose reconstruction of the current object, (d) and (e) differences between the previous normal dose and current ultra-low dose scans in the image domain before and after filtering, and (f) the final PSRR reconstruction.
2.2. Image Registration
Image registration is to establish a geometrical correspondence between two images of the same object acquired at different times and possibly not under the same conditions. In our study, while one image is the reconstructed image IP (x) from the previous normal dose scan, the other image is the reconstructed image I (x) from the current ultra-low dose scan. The relationship between IP (x) and I (x) can be formulated as ĪP (x) = ηIP (TΘ(x)) = I (x) + ε, where TΘ is a spatial transformation depending on a set of parameters Θ, η an intensity mapping, and ε a noise term. That is, after a spatial transform TΘ and an intensity mapping η, IP (x) will arrive at ĪP (x) that is in the same geometry of I (x) subject to noise ε. It should be pointed out that TΘ is a general spatial transform model to represent any rigid or non-rigid spatial transform.
There is a large volume of literature on image registration [16, 17]. Given the background of lung perfusion applications, we propose to use a multi-scale adaptive transformation [18] in the form of with Θ = [V0, V1, ···, VK]. On the lowest scale, V0 (x) = Rω x + b is a global linear transformation describing the overall pose of IP (x) with respect to I (x), where Rω representing the rotation ω and b the translation. Once Vk (x) is computed on a scale level k, a local measure of mismatch (for instance, the gradient of the normalized mutual information [18]) can be applied to minimize any mismatch on the next scale level k + 1. A mismatch region is then decomposed into disjoint sub-regions. A deformation field Vk+1 (x) is computed for each sub-region. By an appropriate registration procedure, we will finally obtain the registered image ĪP (x). At the same time, a global similarity measure is assigned to each mismatch region for further analysis.
2.3. Nonlinear Filtering
The partial differential equation (PDE) based non-linear diffusion technique is an effective way for image denoising [19]. One of the important merits of this technique is that it is capable of extracting all the substantial changes in the difference image ID (x) between the current ultra-low dose reconstruction I (x) and registered previous normal dose reconstruction ĪP (x). In this approach, the filtering parameters can be estimated as a function of the filtered image itself, and the object image is iteratively filtered until the mean energy rate satisfies certain convergence criteria.
Let u(x, t) be an 2D/3D image u(x) at time t with the initial condition u(x,0) = ID (x), where ID (x) is the difference image to be denoised. The general form of the PDE-based diffusion equation can be written as:
| (1) |
where cd (x,t) is the diffusion conductance or diffusivity of the equation, ∇ and ∇ · are respectively the gradient and divergence operators with respect to x [19, 20]. The solution of the above PDE equation leads to a filtered image. A key step of the PDE-based denoising is to choose an appropriate function cd. There are various choices for cd in different applications [19]. If cd is a constant, Eq. (1) becomes a linear diffusion equation. In this case, all the pixels including the edges are smoothed equally. If cd is image-dependent, it becomes a non-linear diffusion equation. Using a function cd constructed based on the derivative of the image at the time t, Perona and Malik were able to control the diffusion near the edges in the image [21]. Note that in the difference image ID (x) we need to keep the features of high absolute grey-levels and suppress interferences of low absolute grey-levels. Hence, we should construct a general cd based on the image grey-level and derivative at time t.
In light of the comparison analysis results of Weeratunga and Kamath [19], here diffusivity cd (x,t) is constructed as the follows:
| (2) |
where the contrast parameter λ defines diffusivity strength, constant parameter q > 1 defines the diffusivity change, and uσ (x,t) is the convolution of the current image u(x,t) with a Gaussian kernel of standard deviation σ. Letting g = ∇uσ (x,t), we can calculate the dependent constant Cq to make the flux ascending for g < λ and descending for g > λ. That is, Cq is the solution of a nonlinear equation 1 − e−x − qxe−x = 0. Once the diffusivity cd (x,t) is determined, u(x,t) can be iteratively computed to arrive at a stable solution.
2.4 Algorithm Implementation
We implemented the PSRR method in MatLab and C++. While the basic platform was constructed in MatLab, all the computationally intensive parts were coded in C++, which was linked via a MEX interface. In this software, we implemented both the FBP and BPF formulas in an equi-angular fan-beam geometry. Because either the FBP or BPF algorithm can reconstruct images exactly, only the FBP algorithm was employed in the following sheep lung perfusion experiments. For the image registration, the implementation details were similar on different scales. Base on extensive experiments, we set the maximum level of registration as K = 0 for the sheep lung perfusion application in this paper, since the sheep were anaesthetized and the scan interval was relatively short between the previous scan and ultra-low dose scans. In the nonlinear filtering procedure, the time t was discretised as tp with an interval T, p = 0,1, 2, ···. Accordingly, the diffusion equation Eq. (1) was discretised as
| (3) |
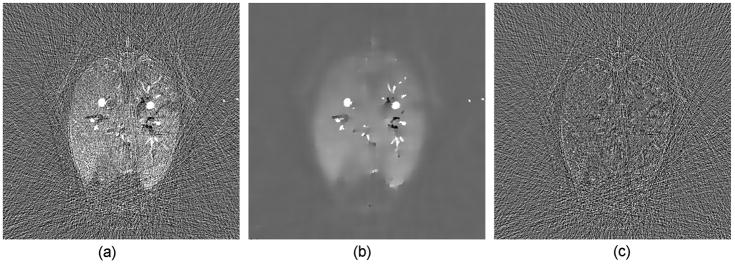
The grid indexes were used as the image coordinates. The time interval was set to T = 1.0. Because the parameters q and λ define the diffusivity change and diffusivity strength respectively, a larger q a sharper diffusivity change while a larger λ a strong perfusion. Meanwhile, a larger Gaussian deviation σ and a larger iteration number p imply greater blurring. In our application, we would like to keep more structural information and reduce noise as much as possible. Hence, based on our extensive experiments we set q = 20 and the maximum iteration number p to be 5. In the first several steps we used larger Gaussian deviations to suppress noise, while in the last several steps we used larger λ for a strong perfusion effect. Therefore, λ and σ were varied as a function of p, as shown in Table 1. Because there is a Gaussian smoothing procedure in the iteration process, subtle intensity changes will be preserved if the areas of the changes are not too small, which was demonstrated in Figure 4.
Table 1.
The values of λ and σ for the iterative procedure.
| p | 0 | 1 | 2 | 3 | 4 | 5 |
|---|---|---|---|---|---|---|
| λ | 0.17 | 0.21 | 0.26 | 0.30 | 0.30 | 0.30 |
| σ | 2.00 | 1.50 | 1.00 | 0.50 | 0.50 | 0.50 |
Figure 4.
Demonstration of the capability for the nonlinear filtering technique, (a) an original difference image in a sheep lung perfusion study; (b) the difference image after nonlinear filtering and (c) the difference between (a) and (b) which is the noise image suppressed by the nonlinear filtering technique.
III. Results
3.1 Sheep Lung Perfusion Experiments
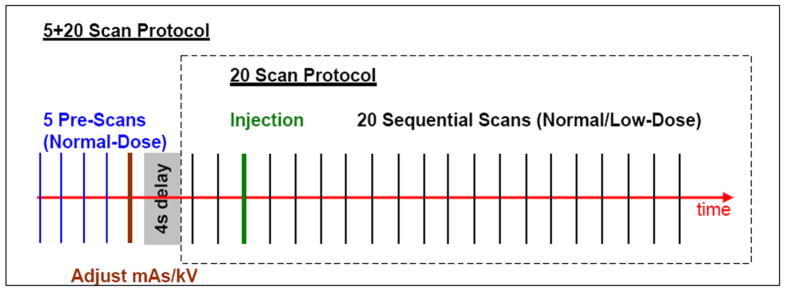
To demonstrate the feasibility of the proposed PSRR approach, we performed several sheep lung perfusion experiments in the Iowa-Comprehensive Lung Imaging Center (iClick), Department of Radiology, University of Iowa. Although one ultra-low dose study would be needed in practical applications, in each of our experiments four studies were performed with a ~40 kg sheep in the order listed in Table 2. Two normal dose studies with 20 scans were designed for testing the repeatability of measurements and serving as the gold standard for our ultra-low dose PSRR reconstruction. Two ultra-low dose studies were done for validating our PSRR technique and evaluating the effects of kVp. Within the ultra-low dose studies, 5 normal dose previous scans were first acquired to serve as prior information, and then a sequence of 20 ultra-low dose scans was taken at the time instants the normal dose studies would otherwise be performed. All the scans were acquired in the axial scanning mode with 1.2×20 mm collimation. The contrast media of Omnipaque™ 350 mg/ML, 15cc/s over 2s, were injected at the beginning of third among 20 scans in each sequence (see Figure 5). Although only one normal dose previous scan was required for the PSRR method, 5 scans at the normal dose were taken for verification that the animal motion was negligible (the animal was anaesthetized with breath being control). The image noise generated by the ultra-low dose scans at 80 kVp was about 45% stronger than that at 100 kVp. In our experiment design, although the previous normal dose data was scanned right before the ultra-low dose scan, it is not necessary so for our general PSRR method to work, and there are many other schemes to utilize much earlier datasets.
Table 2.
Key parameters for the sheep perfusion experiments. (*CTDIvol was calculated based on 1 normal and 20 low-dose scans and its unit is mGy)
| Study | kVp | mAs | #Scans | CTDIvol | Relative Dose |
|---|---|---|---|---|---|
| Normal-Dose I | 100 | 150 | 20 | 108.77 | 100% |
| Low-Dose I | 100 | 17 | 5+20 | 17.90* | 16.5% |
| Low-Dose II | 80 | 17 | 5+20 | 11.89* | 10.9% |
| Normal-Dose II | 100 | 150 | 20 | 108.77 | 100% |
Figure 5.
Sheep lung perfusion protocols for the normal and ultra-low dose scans.
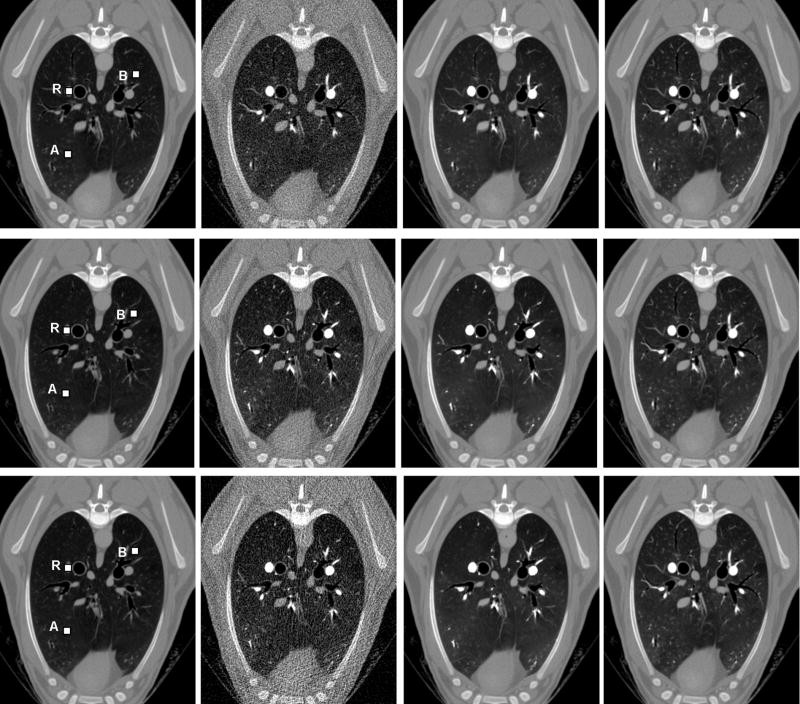
Two sets of CT images in each study were reconstructed using our in-house CT reconstruction and image processing software. The first set was reconstructed from a full dataset to produce each of 20 slices from 1160 views and 672 channels per view, while the second set from the simulated quarter-scan (sparse-scan) with 290 views by taking one from every four contiguous views in the full dataset. Because a quarter-scan was extracted from a full scan, our simulated quarter-scan was equivalent to a real quarter-scan (additional experimental steps were avoided). Additional 3% uniformly distributed Gaussian noise was added to the simulated quarter-scan extracted from the normal dose full-scan dataset to challenge our PSRR method. In each experiment, the nonlinear PDE-based diffusion was applied to the difference images between the degraded current noisy image (obtained from the ultra-low dose or simulated quarter-scan) and the high-quality previous scan image (obtained from the normal dose scan). Finally, the images for 20 phases, corresponding to the 20 scans in the protocol, were generated by combining the images from normal dose previous scan dataset and the filtered difference images. Our PSRR results show that there were no substantial differences between Normal-Dose I and II, as well as that between Low-Dose I and II. Hence, the repeatability of measurements was excellent. As what we have expected, substantial changes, which were obscured in either simulated noise images or ultra-low dose images, have been extracted well by the proposed PSRR method. Specifically, the image quality of the PSRR results from the ultra-low dose studies was comparable with that from the normal dose studies. Figure 6 shows typical PSRR images at slice 11 and phase 6 from the Normal-Dose II and Low-Dose II scans.
Figure 6.
Typical PSRR recontruction results in the sheep lung perfusion studies at slice 11 and phase 6 of Normal-Dose II and Low-Dose II. The first row reconstructed from the quater-scan Normal-Dose II with simulated noise, the second row from Low-Dose II with 89.1% dose reduction, and the third row from the quater-scan Low-Dose II 93.5% dose reduction. The first column lists normal dose previous scan images as prior informatin, the second column reconstructed low dose images, and the third column images reconstructed by our PSRR method. For comparison, the fourth column was reconstructed from the full Normal-Dose II Scan.
3.2 PSRR Performance Analysis
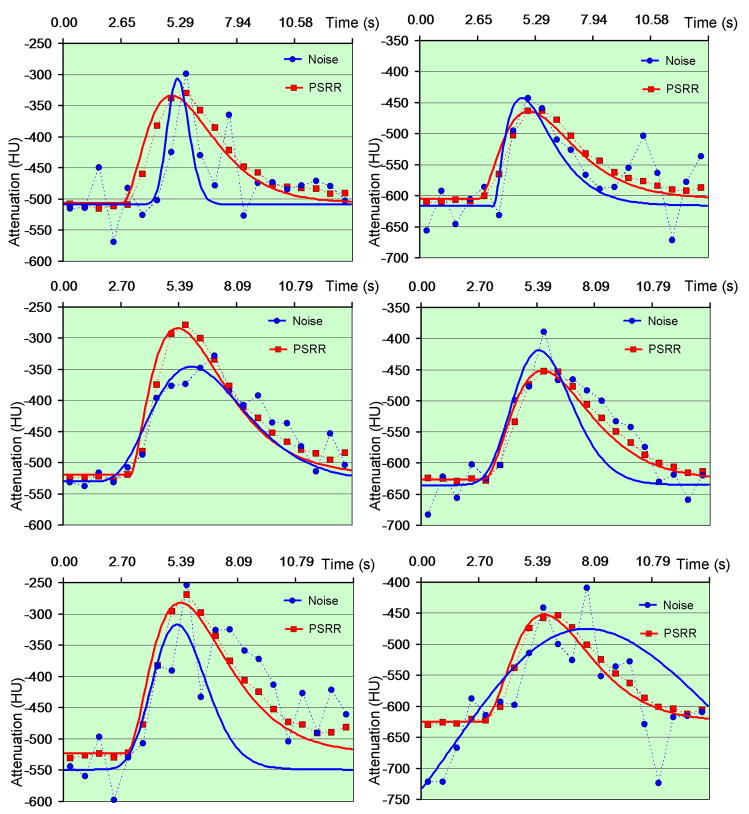
To further demonstrate the merits of our PSRR method, the sheep lung perfusion images were analyzed according to a bolus injection, residue detection model. As shown in the first column of Figure 6, a 5×5 area marked as “R” inside a larger blood cross-section in slice 11 was selected as a reference area, and two 5×5 areas marked as “A” and “B” in the background were selected as ROIs. The CT number was computed by averaging all the voxels in the ROI. Since there were 20 scans (phases), we obtained 20 averaged CT numbers correspondingly. Using our in-house blood flow analysis software, these numbers were fitted to the Gamma Variate function as
| (4) |
where t is the independent time variable, t0 delay time, h0 reference CT number, and A,α, β are free parameters [22, 23]. As shown in Figure 7, the Gamma Variate function fitted from the CT numbers of the reconstructed PSRR images were better than the counterparts without PSRR.
Figure 7.
Fitted Gamma variate curves from the PSRR reconstruction in the sheep lung perfusion study. The left column is for point A while the right column is for point B in Figure 5. The first row shows the result of quarter-scan Normal Dose II with simulated noise, the second row is for Low-Dose II, and the third row for quarter-scan Low-dose II.
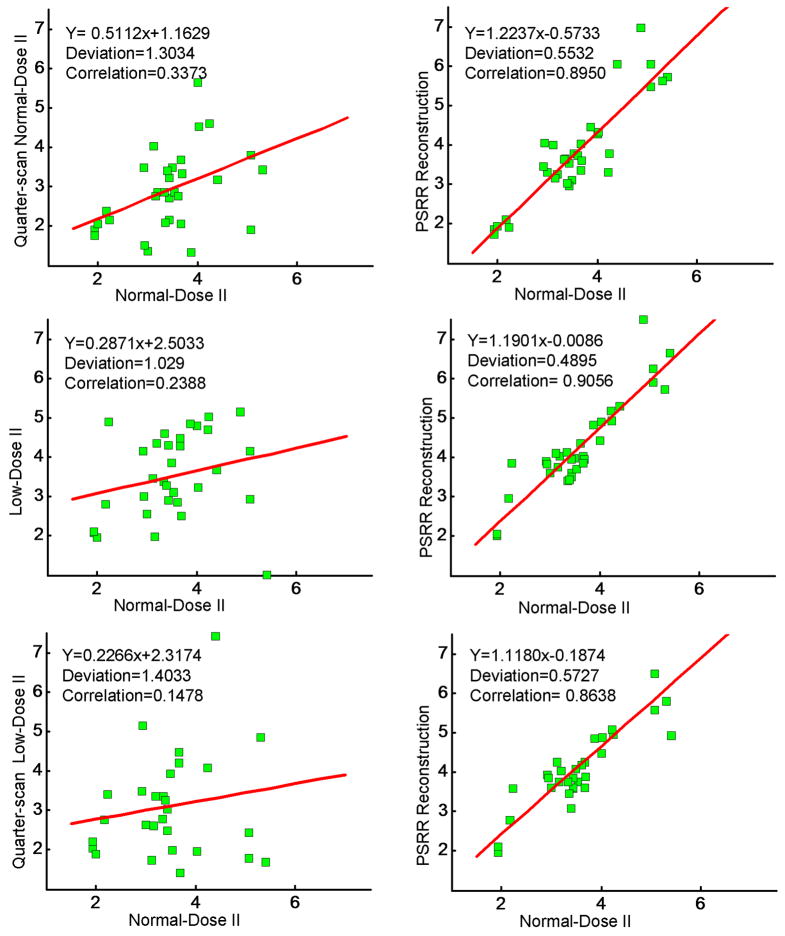
In the lung perfusion application, the mean transit time (MTT) is a key parameter to be measured [24]. To validate the repeatability of MTT, we randomly selected 34 ROIs in the slice 11, each covering a 5×5 area. A MTT was estimated for each ROI from the fitted Gamma variate curve using our in-house software. For the images reconstructed from different scan datasets and/or methods, we measured the repeatability of MTT by compared the correlation among all the MTTs of 34 ROIs. As shown in Figure 8, the correlation coefficient between the PSRR images in the ultra-low dose studies and Normal-Dose II results were larger than that with the ultra-low dose studies without PSRR. This demonstrates that our PSRR method can reduce radiation dose significantly while maintaining the accuracy of the quantitative CT measurements for evaluating regional lung functions.
Figure 8.
MTT repeatability analysis (Unit: second (s)). The left column is the repeatability of the reconstruction without the regulation of a previous scan data, while the right column is with our PSRR method. The first row plots the results of quarter-scan Normal-Dose II with simulated noise, the second row is for Low-Dose II, and the third row for quarter-scan Low-Dose II.
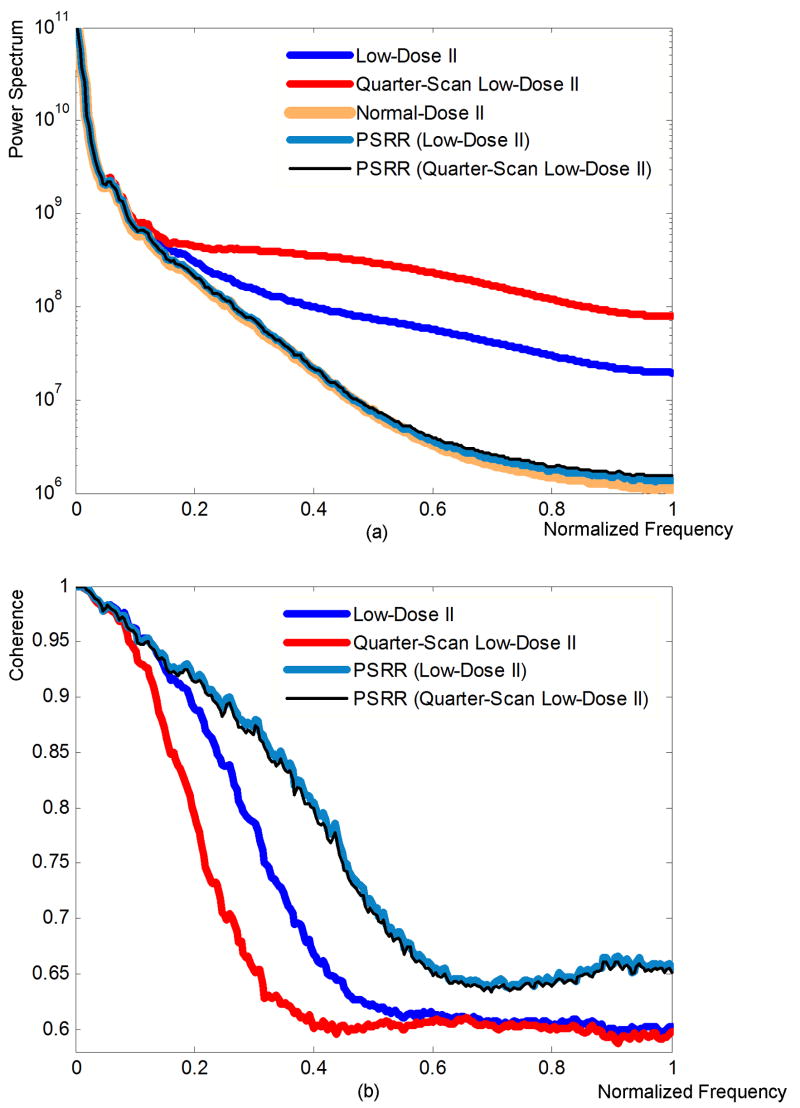
Moreover, we analyzed the power spectra and their coherence (see Appendix). As shown in Figure 9(a), all the images reconstructed using the different methods had similar power spectra at low frequencies while the Low-Dose II and quarter-scan Low-Dose II images were stronger than the Normal-Dose II and our PSRR results at high frequencies. The reason is that the noise in the Low-Dose II and its quarter-scan version had contributed more at the high-frequencies. Note that the nonlinear PDE filtering can depress the noise, our PSRR results gave almost the same power spectrum as the Normal-Dose II images. Also, it is reasonable that the power spectrum of PSRR from the quarter-scan Low-Dose II was slightly larger than that from Low-Dose II, and the power spectrum of PSRR from the Low-Dose II was slightly larger than that from the Normal-Dose II. The coherences between all the reconstructed ultra-low dose images and that of the Normal-Dose II are plotted in Figure 9(b). It is shown that the coherences of the images reconstructed by our PSRR methods were higher than that of the classical reconstruction method without PSRR. This also verifies that our PSRR method can significantly reduce radiation dose without compromising the image quality.
Figure 9.
Spectral and coherence analyses. (a) Power spectra and (b) coherence coefficient of the reconstructed images from the sheep lung perfusion study.
IV. Discussions and Conclusion
Currently, the PSRR image reconstruction is performed in an analytic framework and regularized by typical image post-processing methods (image registration and nonlinear filtering). However, it does not mean that the image post-processing is necessary or the low-dose reconstruction can not be regularized directly. In fact, our PSRR idea can be implemented in an iterative framework. In that case, we can formulate an optimal object function incorporating the previous normal dose dataset and current ultra-low dose dataset, as well as the image segmentation and registration components. Meanwhile, the image registration will be performed in the projection domain, instead of the image domain. More work is needed to compare these two different reconstruction schemes.
The current image registration and nonlinear filtering components need to have appropriate parameters values, such as the number of multiple-scale levels, diffusion coefficient and standard deviation of the Gaussian convolution kernel. In this preliminary study, these values were manually selected. Undoubtedly, optimal parameters must be selected for different applications. An attractive possibility is that the optimal parameters be determined via analyzing filtered images using image processing techniques. Simultaneously, the image registration accuracy affects the overall performance of the proposed method. This is an important issue to be systematically addressed for the optimal performance of our PSRR approach. Since the major purpose of this paper is to demonstrate the feasibility of our PSRR approach, we will not discuss the effect of registration accuracy in detail. More efforts should be made in this direction.
In conclusion, we have proposed an innovative PSRR approach and showcased its application in lung CT perfusion studies. Different from the existing methods, our method seeks to use much more a priori knowledge in the terms of a previous scan of the same patient/animal. The image registration and nonlinear filtering techniques have been used to identify substantial changes between the images reconstructed from the current ultra-low dose and previous normal dose datasets. Our sheep lung perfusion studies have shown that ~90% reduction in radiation dose can be achieved while maintaining the accuracy of the quantitative CT evaluation of regional lung functions in a sheep model.
Appendix: Power Spectrum and Coherence
Assume that the reconstructed images of a certain slice at a normal dose are expressed as IN (xm, yn, tk), the corresponding ultra-low dose images are IL(xm, yn, tk), where tk represent the time series throughout the perfusion procedure. For every image slice, using the Fast Fourier Transform (FFT) method we first compute the Fourier Transforms FN(um, vn, tk), and FL(um, vn, tk) from the normal and ultra-low dose scans respectively. The corresponding power spectra are PN(um, vn, tk) = |FN(um, vn, tk)|2 and PL(um, vn, tk) = |FL(um, vn, tk)|2, and their cross-spectrum is PNL(um, vn, tk) = |FN(um, vn, tk)FL(um, vn, tk). If we omit the phase information, the power spectra can be expressed as
The final power spectra P̄N(wl), P̄L(wl) and P̄NL(wl) are respectively the corresponding averages of PN(wl, tk), PL(wl, tk) and PNL(wl, tk) over time. Finally, the coherence is determined as
which is a normalized coefficient.
Footnotes
Publisher's Disclaimer: This is a PDF file of an unedited manuscript that has been accepted for publication. As a service to our customers we are providing this early version of the manuscript. The manuscript will undergo copyediting, typesetting, and review of the resulting proof before it is published in its final citable form. Please note that during the production process errors may be discovered which could affect the content, and all legal disclaimers that apply to the journal pertain.
Contributor Information
Hengyong Yu, Biomedical Imaging Division, VT-WFU School of Biomedical Engineering, Virginia Tech, Blacksburg, VA 24061, USA, hengyongyu@vt.edu
Shiying Zhao, Department of Mathematics and Computer Science, University of Missouri-St. Louis, St. Louis, MO, 63121, USA, zhao@arch.cs.umsl.edu
Eric A. Hoffman, Division of Physiologic Imaging, Department of Radiology, University of Iowa, Iowa City, Iowa, 52242, USA, eric-hoffman@uiowa.edu
Ge Wang, Biomedical Imaging Division, VT-WFU School of Biomedical Engineering, Virginia Tech, Blacksburg, VA 24061, USA, wangg@vt.edu
References
- 1.Brenner DJ, et al. Estimated risks of radiation-induced fatal cancer from pediatric CT. American Journal Of Roentgenology. 2001;176(2):289–296. doi: 10.2214/ajr.176.2.1760289. [DOI] [PubMed] [Google Scholar]
- 2.Berrington de Gonzalez A, Darby S. Risk of cancer from diagnostic X-rays: estimates for the UK and 14 other countries. Lancet. 2004;363(9406):345–351. doi: 10.1016/S0140-6736(04)15433-0. [DOI] [PubMed] [Google Scholar]
- 3.Brenner DJ, Hall EJ. Current concepts - Computed tomography - An increasing source of radiation exposure. New England Journal of Medicine. 2007;357(22):2277–2284. doi: 10.1056/NEJMra072149. [DOI] [PubMed] [Google Scholar]
- 4.Linto OW, Mattler FAJ. National conference on dose reduction in computed tomography, emphasis on pediatrics. AJR Am J Roentgenol. 2003;181:321–329. doi: 10.2214/ajr.181.2.1810321. [DOI] [PubMed] [Google Scholar]
- 5.Mettler FAJ, et al. CT scanning: patterns of use and dose. J Radiation Protection. 2000;20:353–359. doi: 10.1088/0952-4746/20/4/301. [DOI] [PubMed] [Google Scholar]
- 6.Jakobs TF, et al. Multislice helical CT of the heart with retrospective ECG gating. reduction of radiation exposure by ECG-controlled tube current modulation. European Radiology. 2002;12(5):1081–1086. doi: 10.1007/s00330-001-1278-x. [DOI] [PubMed] [Google Scholar]
- 7.Goo HW, Suh DS. Tube current reduction in pediatric non-ECG-gated heart CT by combined tube current modulation. Pediatric Radiology. 2006;36(4):344–351. doi: 10.1007/s00247-005-0105-y. [DOI] [PubMed] [Google Scholar]
- 8.O’Halloran R, et al. Iterative projection reconstruction of time-resolved images using highly-constrained back-projection (HYPR) Magnetic resonance in medicine. 2008;59(1):132–139. doi: 10.1002/mrm.21439. [DOI] [PubMed] [Google Scholar]
- 9.Supanich M, et al. An acquisition and image reconstruction scheme for reduced x-ray exposure dynamic 3D CTA. Medical Imaging 2008, Proccedings of SPIE; 2008. [Google Scholar]
- 10.Carvalho BA, Herman GT. Low-dose, large-angled cone-beam helical CT data reconstruction using algebraic reconstruction techniques. Image and Vision Computing. 2007;25(1):78–94. [Google Scholar]
- 11.La Riviere PJ. Penalized-likelihood sinogram smoothing for low-dose CT. Medical Physics. 2005;32(6):1676–1683. doi: 10.1118/1.1915015. [DOI] [PubMed] [Google Scholar]
- 12.Wang G, et al. Dynamic reconstruction of lung using multi-slice spiral CT. Radiology. 2000;217P:565. [Google Scholar]
- 13.Kachelriess M, Kalender WA. Electrocardiogram-correlated image reconstruction from subsecond spiral computed tomography scans of the heart. Med Phys. 1998;25(12):2417–2431. doi: 10.1118/1.598453. [DOI] [PubMed] [Google Scholar]
- 14.Noo F, Clackdoyle R, Pack JD. A two-step Hilbert transform method for 2D image reconstruction. Physics In Medicine And Biology. 2004;49(17):3903–3923. doi: 10.1088/0031-9155/49/17/006. [DOI] [PubMed] [Google Scholar]
- 15.Yu H, et al. Data Consistency Based Translational Motion Artifact Reduction in Fan-Beam CT. IEEE Transactions on Medical Imaging. 2006;25(6):792–803. doi: 10.1109/tmi.2006.875424. [DOI] [PubMed] [Google Scholar]
- 16.Zitova B, Flusser J. Image registration methods: a survey. Image and Vision Computing. 2003;21:977–1000. [Google Scholar]
- 17.Hajnal JV, Hill DLG, Hawkes DJ. Medical Image Registration. In: Neuman MR, editor. The Biomedical Engineering Series. CRC Press; Boca Raton: 2001. [Google Scholar]
- 18.Rohde GK, Aldroubi A, Dawant BM. The adaptive bases algorithm for intensity-based nonrigid image registration. IEEE Trans Med Imaging. 2003;22(11):1470–1479. doi: 10.1109/TMI.2003.819299. [DOI] [PubMed] [Google Scholar]
- 19.Weeratunga SK, Kamath C. A comparison of PDE-based non-linear anistropic diffusion techniques for image denoising. Proceedings of SPIE; Image Processing: Algorithms and Systems II; Jan 21–23 2003; Santa Clara, CA, United States. 2003. pp. 201–212. [Google Scholar]
- 20.Weeratunga SK, Kamath C. PDE-based non-linear diffusion techniques for denoising scientific and industrial images: An empirical study. SPIE; Image Processing: Algorithms and Systems; San Jose, CA, United States. 2002. pp. 279–290. [Google Scholar]
- 21.Perona P, Malik J. Scale-Space And Edge-Detection Using Anisotropic Diffusion. Ieee Transactions On Pattern Analysis And Machine Intelligence. 1990;12(7):629–639. [Google Scholar]
- 22.Madsen MT. A simplified formulation of the gamma variate function. Physics In Medicine And Biology. 1992;37(7):1597–1600. [Google Scholar]
- 23.Davenport R. The Derivation Of The Gamma-Variate Relationship For Tracer Dilution Curves. Journal Of Nuclear Medicine. 1983;24(10):945–948. [PubMed] [Google Scholar]
- 24.Won C, et al. CT-based assessment of regional pulmonary microvascular blood flow parameters. J Appl Physiol. 2003;94:2483–2493. doi: 10.1152/japplphysiol.00688.2002. [DOI] [PubMed] [Google Scholar]


