

Abstract
Prostaglandins (PGs) are bioactive lipid mediators released following brain hypoxic-ischemic injury. Clearance and re-uptake of these prostaglandins occur via a transmembrane prostaglandin transporter (PGT), which exchanges PG for lactate. We used western blot analyses to examine the PGT developmental profile and its regional distribution as well as changes in transporter expression during chronic hypoxia. Microsomal preparations from four brain regions (cortex, hippocampus, cerebellum and brainstem/diencephalon) showed gradual increases in prostaglandin transporter expression in all brain regions examined from postnatal day 1 till day 30. There was a significant regional heterogeneity in the prostaglandin transporter expression with highest expression in the cortex, followed by cerebellum and hippocampus, and least expressed in the brainstem-diencephalon. To further delineate the pattern of prostaglandin transporter expression, separate astrocytic and neuronal microsomal preparations were also examined. In contrast to neurons, which had a robust expression of prostaglandin transporters, astrocytes had very little PGT expression under basal conditions. In response to chronic hypoxia, there was a significant decline in PGT expression in vivo and in neurons in vitro, whereas cultured astrocytes increased their PGT expression. This is the first report on PGT expression in the central nervous system (CNS) and our studies suggest that PGTs have 1) a widespread distribution in the CNS; 2) a gradual increase and a differential expression in various regions during brain development; and 3) striking contrast in expression between glia and neurons, especially in response to hypoxia. Since PGTs play a role as prostaglandin-lactate exchangers, we hypothesize that PGTs are important in the CNS during stress such as hypoxia.
Keywords: prostaglandin, transporter, brain, development, protein expression, hypoxia
Introduction
The brain is one of the most sensitive organs to O2 deprivation. As a result, hypoxic injury may have drastic effects on brain development (when the stress is in early life) and function. Prolonged brain hypoxia can cause an increase in cerebral blood flow, glucose metabolism and glycolysis, oxidative stress and altered intracellular production of prostaglandins (Harik et al., 1994; Niwa et al., 2000; Leffler CW and Perfenova H, 1997; Gonzalez-Correa et al., 2004).
Prostaglandins (PGs) are the major lipid mediators that modulate many brain activities under basal conditions and in pathological states. PGs are produced as a result of cyclooxygenase (COX) activity and modulate cerebral blood flow regulation, synaptic transmission, neurotrophin production, angiogenesis, gene expression and can change such biological processes like pain perception, body temperature and sleep/awake cycle (Ahmadi et al., 2002; Kunz et al., 2006; Urade and Hayashi, 1999; Toyomoto et al., 2004; Chen et al., 2002; Chen and Bazan, 2005; Zhu et al., 2006). In addition, many studies have attested to the importance of brain PGs in the development of Alzheimer’s disease, stroke, brain inflammation, traumatic brain injury and neurodegenerative diseases (Bazan et al., 2002; Bazan et al., 1995; Minghetti, 2004). Recent findings have also directly implicated COX-2 derived PGs in glutamate neurotoxicity (Manabe et al., 2004) and in the pathogenesis of stroke (Iadecola and Gorelick, 2005).
PGs are synthesized intracellularly and act as autocrine- or paracrine-signaling molecules. Extracellular PGs exert their major actions via multiple cell surface G-protein coupled receptors (Coleman et al., 1994; Narumiya et al., 1999) and are immediately taken up intracellularly for their inactivation or action via specific nuclear receptors (Zhu et al., 2006). Prostanglandin transport takes place via a prostaglandin transporter (PGT) and this transport plays an important role since, at physiologic pH, PGs exist as charged anions and diffuse poorly across the plasma membrane (Schuster, 1998; Chan et al., 1998). PGT has been identified in various tissues (endothelial cells, liver, kidney, lung, smooth muscle) (Lu et al., 1996) and, in contrast to multiple PG specific receptors and their isoforms (Narumiya et al., 1999), PGT has been shown to have affinity with most major PGs (PGE2=PGF2>PGD2) (Schuster, 1998). In addition, PGT activity depends on a number of factors, including glucose metabolism and glycolysis. Chan et al. (2002) demonstrated that intracellular PG transport is coupled to lactate by a mechanism consistent with lactate-PG exchange. Both glucose and lactate may serve as metabolic substrates for brain energy metabolism; however, brain delivery and utilization of these substrates undergo developmental changes (Vannucci, 1994; Vannucci and Simpson, 2003).
So far little is known about the PGT expression in brain tissue during development in early life or in response to stress, such as hypoxia. In this study we focused on the following questions: 1) Is PGT present in the brain throughout development? 2) are there regional differences in PGT expression? 3) which cell types (neurons or glia) express PGT? and 4) how does PGT expression change under stress (i.e. hypoxia)?. In order to perform these studies, we resorted to a mouse model, as well as to primary neuronal and astrocytic cultures.
Experimental procedures
Animals
Pregnant CD-1 mice were obtained from Charles River (Wilmington, DE). Care was exercised in the handling of these animals and the minimal number of animals that was absolutely required was used in this study. This study was conducted in conformity with the Guiding Principles for Research Involving Animals and Human Beings and was approved by the Albert Einstein Animal Care and Use Committee (IACUC). Animal experiments were carried out in accordance with the National Institute of Health Guide for the Care and Use of Laboratory Animals (NIH Publications No. 80-23), revised 1996.
In vivo Hypoxia Exposure
Post-natal day 2 (P2) CD-1 mouse pups were housed with their dams in isobaric chambers. Litters were culled to eight to ensure adequate nutrition of the pups. Food and water were provided ad libitum within the chamber. The protocols used to expose mice to hypoxia have been previously described (Douglas et al., 2003; Kanaan et al., 2006). In brief, a combination of nitrogen (N2) and oxygen (O2) was injected into the chambers through a network of tubing to achieve selected concentrations of O2. This was controlled by the Oxycycler hydraulic system (Model A44×0, BioSpherix, Redfield, NY) and ANA-Win2 Software (Version 2.4.17, Watlow Anafaze, CA). For chronic constant hypoxia, the O2 level was maintained at 11 ± 0.1% continuously. Normal control mice were kept in the same room and were exposed to the same level of noise and light during the duration of the each experiment. Mice exposed to hypoxia or maintained in normoxia were removed after 7, 14, 21 and 28 days of exposure. The animals were decapitated after halothane anesthesia, and brains were rapidly removed. Four brain regions (cortex, hippocampus, brainstem-diencephalon, and cerebellum) were quickly separated on ice, flash-frozen in liquid nitrogen, and stored in −80°C till use.
Isolation and culture of neocortical neurons
Culture of mouse neocortical neurons was performed using a modification of the method of Brewer (1995). Pregnant (16–17 days of gestation) CD-1 mice (Charles River Laboratories) were anesthetized with isoflurane. Embryos were excised via cesarean section. The cortices were dissected and placed in Hank’s balanced salt solution without Ca2+ and Mg2+ (GIBCO, Gaithersburg, MD, USA) supplemented with 10mM HEPES (GIBCO) at 4° C. The tissues were incubated with 0.05% Trypsin-EDTA (GIBCO) for 15 min and then triturated 10 times using a small-bore pipette. Trypsin activity was inhibited with Hank’s balanced salt solution, 10% fetal bovine serum (FBS) and 10mM HEPES. Cells were centrifuged at 200g for 5 min at 4°C. The supernatant was removed and the pellet was resuspended in Neurobasal medium (GIBCO) supplemented with B27 (GIBCO), 25uM glutamate (SIGMA, St Louis, MO, USA), 0.5 mM glutamine (GIBCO) and 50U/ml penicillin and 50U/ml streptomycin with final cell concentration of 0.3×10⁶ cells/ml. Two ml of the cell suspension solution was placed on poly-D-lysine coated cover slips in 35 mm culture dishes and maintained in an incubator at 37°C with 21% O2, 5% CO2 and balance nitrogen. Every 3–4 days in culture, the medium was half changed with Neurobasal medium supplemented with B27, 0.5 mM glutamine and 50U/ml penicillin (no glutamate).
Isolation and culture of neocortical astrocytes
Culture of neocortical astrocytes was performed using a modification of the method of McCarthy et al. (1985). P2 CD-1 mice (Charles River Laboratories) were anesthetized with isoflurane. The cortices were dissected and placed in Hank’s balanced salt solution without Ca2+ and Mg2+ (GIBCO) supplemented with 10mM HEPES (GIBCO) at 4° C. The tissues were incubated with 0.05% Trypsin-EDTA (GIBCO) for 15 min and then triturated 10 times using a small-bore pipette. Trypsin activity was inhibited with Hanks’ balanced salt solution, 10% FBS and 10mM HEPES. Cells were centrifuged at 200g for 5 min at 4°C. The supernatant was removed and the pellet was resuspended in Dulbecco’s modified Eagle Medium (GIBCO) supplemented with 10% FBS and 50U/ml penicillin and 50U/ml streptomycin to a concentration of 0.2 × 10⁶ cells/ml. Ten ml of suspension were plated on Falcon dishes and maintained in an incubator at 37°C with 21% O2, 5% CO2 and balance nitrogen. The following day, non-adherent cells and debris were removed. Every 3–4 days in culture, the medium was half changed with Dulbecco’s modified Eagle Medium (GIBCO) supplemented with 10% FBS and 50U/ml penicillin and 50U/ml streptomycin.
Hypoxic exposure of neurons
Experiments were performed on neurons grown for 7 days in culture. Following one half change of the media, culture dishes were placed in either 1% O2, 5% CO2, balance nitrogen (hypoxia) or maintained in 21% O2, 5% CO2, balance nitrogen (normoxia). Culture dishes were removed after 24, 48 and 72 hours of hypoxia or normoxia for immunoblot and immunohistochemical analysis.
Hypoxic exposure of astrocytes
Experiments were performed after astrocytes were grown for 14 days in culture. Following one half change of the media, culture dishes were placed in either 1% O2, 5% CO2, balance nitrogen (hypoxia) or maintained in 21% O2, 5% CO2, balance nitrogen (normoxia). Culture dishes were removed after 3, 6, 12 and 24 hours of hypoxia for immunoblot analysis. While most investigators have exposed previously astrocytes to 5% O2, we preferred in this work to maintain astrocytes in similar conditions as neurons. Following 1% O2 exposure, cultured astrocytes underwent rapid death, consistent with results of the other investigators, who demonstrated that astrocytes exposed to hypoxia die within 24h, hence our choice of the time profile to study astrocytes (Chesler, 2005)
Immunoblot analyses
At each time point, 4–5 animals exposed to hypoxia or maintained in normoxia were anesthetized with isoflurane and decapitated. The brains were excised and dissected into cortex, hippocampus, cerebellum, and brain stem/diencephalon. The tissues from each region were weighed, pooled and transferred into lysis buffer (K-HEPES, 200mM mannitol, 41mM KOH, 1uM pepstatin, 1uM leupeptin, 230uM PMSF and 1mM K2EDTA, pH 7.5). Crude microsomes were prepared from each of the brain regions according to the method of Grassl and Aronson (1986). Tissues were homogenized by 10–20 strokes with a Teflon glass homogenizer operating at 2000 r.p.m. (Thomas Scientific, Swedesboro, NJ, USA). The homogenate was then centrifuged at 1000g for 10 min to remove cellular debris. The supernatant was withdrawn and centrifuged at 100,000g at 4°C in a Beckman SW40T rotor for 1 h. The resulting pellet was resuspended in 100–300μl of lysis buffer and stored at −80°C until used.
For cell culture at each time point, 12 × 35mm dishes (for neurons) and 3 × 75cm flasks (for astrocytes) were exposed to hypoxia and normoxia. Cells were collected and maintained in lysis buffer and subsequently centrifuged at 100,000g at 4°C in a Beckman SW40T rotor for 1 h. The resulting pellet was resuspended in 100–300μl of lysis buffer and stored at −80°C until used. Membrane protein concentration was determined using the bicinchoninic acid protein assay kit (Pierce, Rockford, IL). 15mg of protein for each sample was resolved on a 4–12% pre-cast NuPAGE Bis-Tris gel (Invitrogen, Carlsbad, CA, USA). Resolved proteins were then transferred to polyvinylidene fluoride membranes (Immobilin-P, Millipore, Bedford, MA, USA) at 30V at 4°C overnight in a Trans-Blot cell (Bio-Rad, Hercules, CA, USA). The membranes were then incubated overnight at 4°C in 5% non-fat dry milk/PBS containing rabbit anti-rat prostaglandin transporter polyclonal antibody (dilution factor of 1:1000) (Alpha Diagnostic International, San Antonio, TX, USA). Membranes were subsequently rinsed five times for 5 min each in 5% non-fat milk/PBS, and then incubated for 1 h at room temperature in 5% non-fat dry milk/PBS containing a horseradish peroxidase conjugated anti-rabbit secondary antibody at a dilution of 1:2000 (Zymed, San Francisco, CA, USA). Membranes were again rinsed as above and protein signal detection was accomplished using the ECL chemiluminescence system (Amersham, Little Chalfont, UK). The membranes were then stripped according to the manufacturer’s recommendations and re-probed with a mouse monoclonal antibody to actin (Santa Cruz Biotechnology, Inc., Santa Cruz, CA, USA) or to HSC-70 (Stressgen, Victoria, BC, Canada). Hsc-70 antibody was utilized as a loading control in developmental studies, because expression of Hsc-70 is not altered during brain development (D’Souza and Brown, 1998), while actin expression increases throughout brain development (Bryan et al., 1981). Additionally, competition studies of the prostaglandin transporter with synthetic prostaglandin transporter peptide were performed to verify the specificity of this antibody in mouse brain. Scanning densitometry of immunoblot films was performed on a Personal Densitometer SI scanner (Molecular Dynamics, Sunnyvale, CA, USA) and analyzed using the ImageQuaNT image analysis software (Molecular Dynamics, Sunnyvale, CA, USA). Differences in protein expression were quantified by densitometric measurement of the protein to Hsc-70 ratio in developmental studies, while differences in protein expression in adult brain and during hypoxia were quantified by densitometric measurements of protein to actin ratio. The protein-Hsc-70 ratio and protein-actin ratio for each sample was expressed in arbitrary units (AU).
Statistical Analysis
All data were presented as means ± SEM. All data were analyzed using one-way ANOVA and paired Student’s t-test. In all cases statistical significance between means was achieved when p<0.05.
Results
Regional PGT expression in adult mouse CNS
Western blot analysis revealed a heterogeneous regional distribution of PGT in the brain. In P30 mice, the anti-PGT antibody recognized a strong band at 65 kDa (Fig. 1A). Competition studies of the prostaglandin transporter with a synthetic peptide verified the specificity of this antibody (Fig. 1C). Relative expression was quantitated, with the predominant expression of PGT occurring in the cortex, followed by the cerebellum and hippocampus, with the least expression in the brainstem/diencephalon (CX>CB=HC>BD) (Fig. 1B). Average PGT/actin were similar in hippocampus and cerebellum, but there were significant differences between the cortex and the other 3 brain regions (p<0.0001) and between the brainstem/diencephalon and the hippocampus (p<0.0005) and cerebellum (p<0.007).
Figure 1. Prostaglandin Transporter (PGT) expression in different regions of murine CNS.
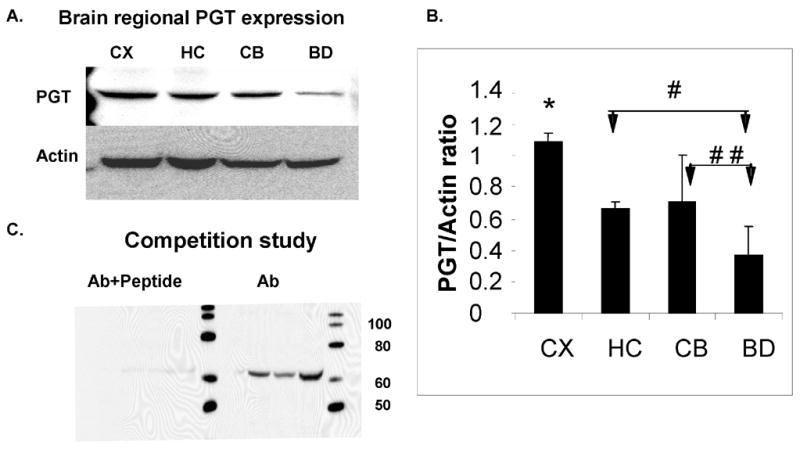
(A). Immunoblot analysis of PGT expression in the CD-1 P30 mouse CNS at P30. Actin serves as a loading control. (B) Densitometric analyses of PGT expression in mouse CNS. Brain regions are plotted on the X axis vs. optical density of PGT to actin on the Y axis. (CX=cortex; HC= hippocampus; CB=cerebellum; BD=brainstem/diencephalon). Values are means ± SE. The asterisk (*) indicates that there are significant differences between the CX and the other 3 regions (HC, CB and BD) (p< 0.0001), the single pound sign (#) indicates that there is a significant difference between the HC and BD (p< 0.0005) and the double pound sign (# #) indicates that there is a significant difference between the CB and BD (p< 0.007). (C). Competition Study: immunoblot analyses of PGT antibody and peptide (left) and antibody alone.
Developmental expression of PGT
There was a faint or undetectable PGT band at P2 in all brain regions studied (cortex, hippocampus, cerebellum and brainstem/diencephalon). The expression of this transporter changed with age, showing that the most significant increase occurs after two weeks of age. For all these regions, this increase averaged between 5- and 30-fold from P2 to P30 (Fig. 2 A–D). These findings suggest that the major role of PGT in the brain is in late postnatal or adult life.
Figure 2. Developmental expression of Prostaglandin Transporter (PGT) in the murine CNS.
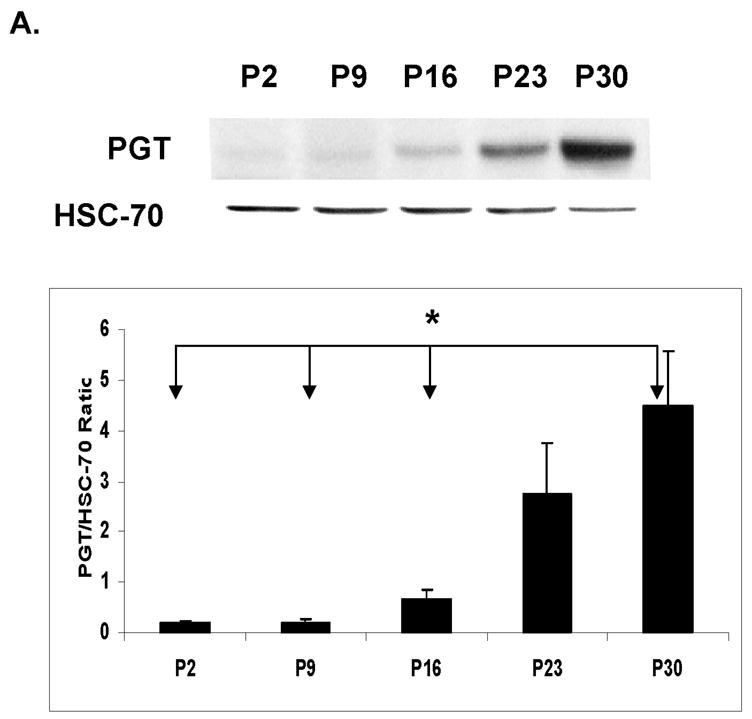
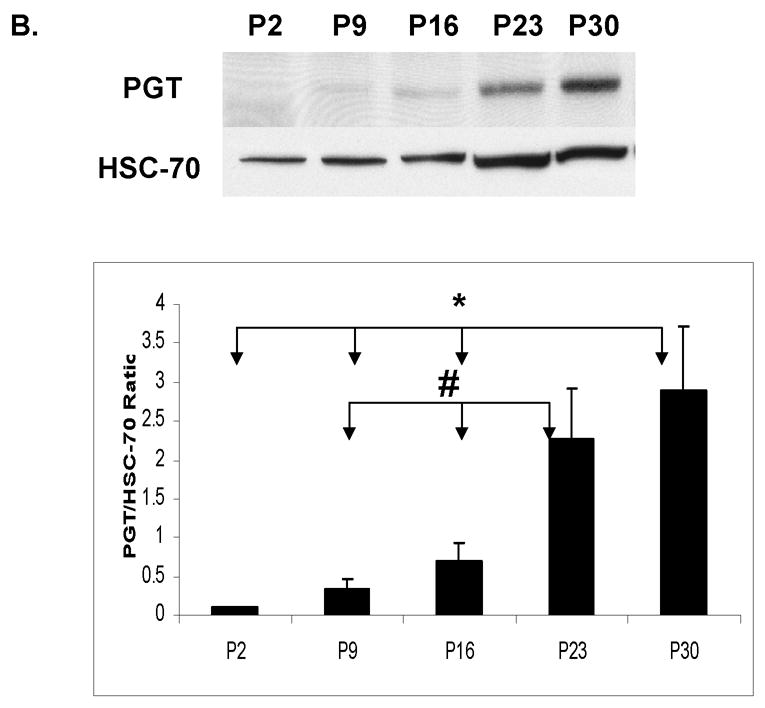
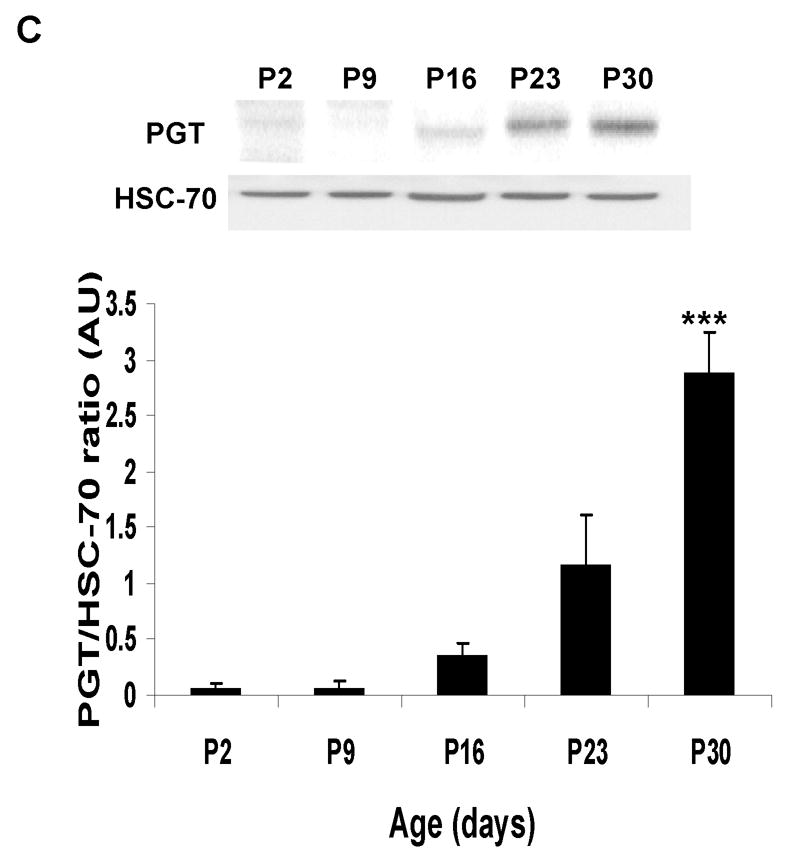
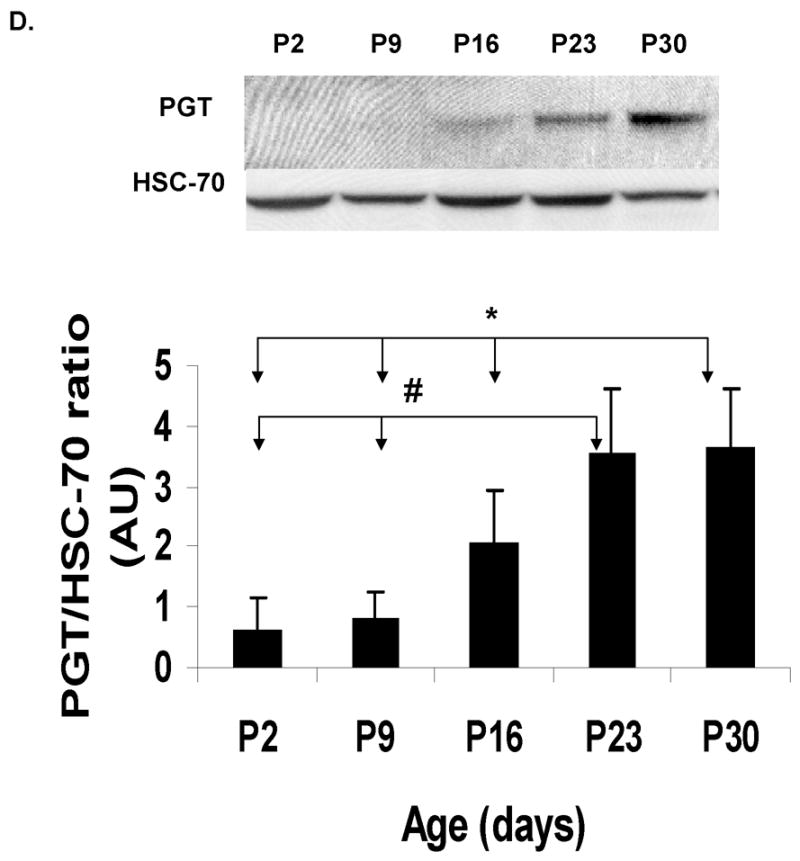
Immunoblot and densitometric analyses of PGT expression during the development in CD- 1 mice from post-natal day (P2) till 30 days of life. HSC-70 served as a loading control. Post- natal age is plotted on the X axis vs. ratio of optical density of PGT/HSC-70 on the Y axis. (A) cortex (CX): The asterisk (*) indicates that there are significant differences between P30 and three of the other ages (P2, P9, and P16 ) (p< 0.0001). (B) hippocampus (HC): The asterisk (*) indicates that there are significant differences between P30 and 3 other ages (P2, P9, and P16) and the pound sign (#) indicates that there are significant differences between P23 and two other ages (P9 and P16). (C) cerebellum (CB): The asterisks (***) indicate that there are significant differences between P30 and the other 4 ages (P2, P9, P16 and P23). (D) brainstem/diencephalon (BD): The asterisk (*) indicates that there are significant differences between P30 and 3 other ages (P2, P9, and P16) and the pound sign indicates that there are significant differences between P23 and two other ages (P2 and P9).
PGT expression during hypoxia
In vivo exposure to chronic hypoxia (11% O2, for 28 days postnatally) induced a decrease in PGT expression in the brain. However, this reduction was not the same in all brain regions. The decline in PGT expression was most pronounced in cortex (44%) (p<0.005) and brainstem (50%) (p<0.05) and did not change significantly in hippocampus (15%) (p >0.1) or in the cerebellum (Fig. 3A).
Figure 3. Prostaglandin Transporter (PGT) expression during hypoxia in vivo and in vitro.
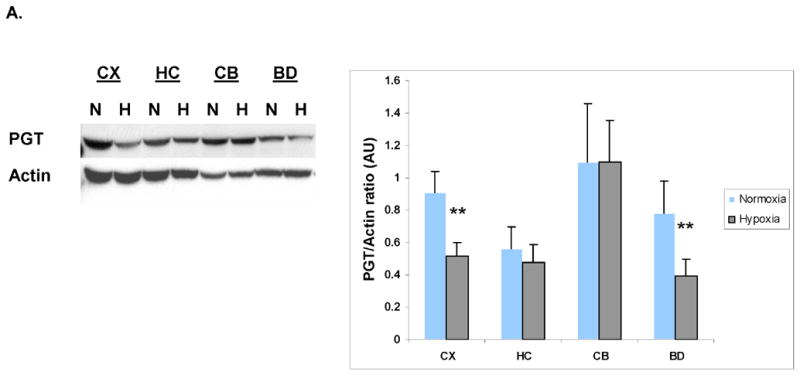

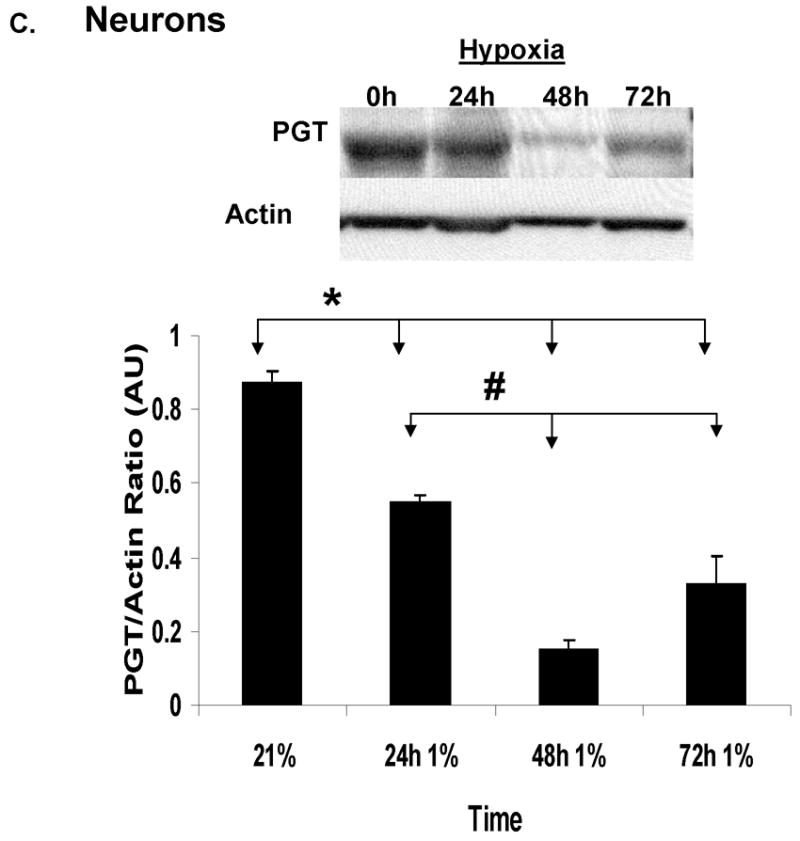
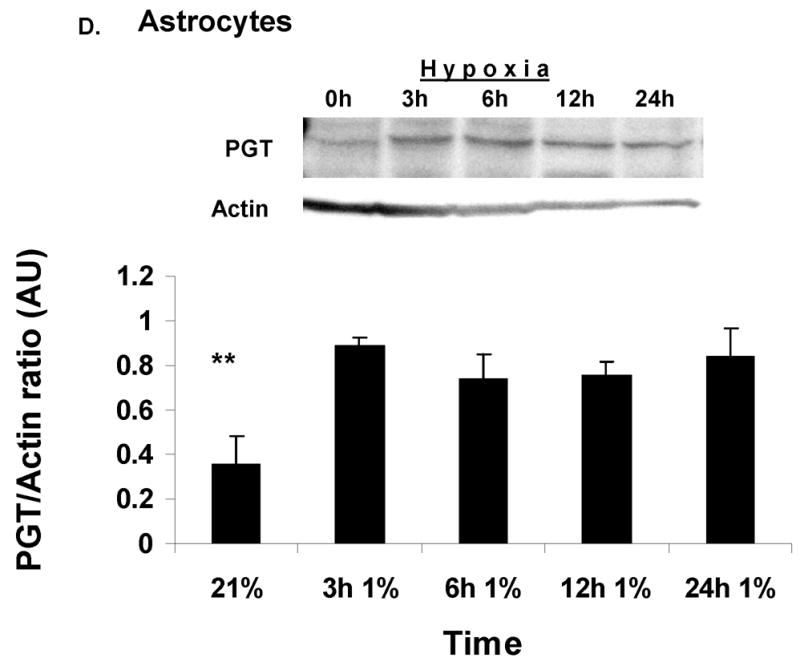
(A). Immunoblot analysis of PGT expression in the CD-1 mouse CNS at P30 in normoxia (N) vs. hypoxia (H). Actin serves as a loading control. Densitometric analyses of PGT expression in mouse CNS in normoxia vs. hypoxia. Brain regions are plotted on the X axis vs. optical density of PGT to actin on the Y axis. (CX=cortex; HC=hippocampus; CB=cerebellum; BD=brainstem/diencephalon). Values are means ± SE. The asterisks (**) indicate that there are significant differences between normoxia and hypoxia in the cortex (CX) and brainstem/diencephalon (BD) (p<0.0001). (B). Immunoblot analysis of PGT expression in the primary culture of astrocytes and neurons during normoxia (21%O2). Actin serves as a loading control. Densitometric analyses of PGT membrane protein expression in cultured astrocytes and neurons. Type of the cell is plotted on the X axis vs. optical density of PGT to actin on the Y axis. Values are means ± SE. The asterisks (**) indicate that there are significant differences between astrocytes and neurons in the basal expression of PGT (p<0.005). (C). Immunoblot and densitometric analysis of PGT expression in neuronal culture during normoxia and hypoxia. Values are means ± SE. The asterisk (*) indicate that there are significant differences between neurons in normoxia (21%) and neurons exposed to hypoxia for 24h, 48h and 72h (p<0.0001) and the pound sign indicates that there are significant differences between neurons in hypoxia for 48h and those in hypoxia for 24h and 72h. (D). Immunoblot and densitometric analysis of PGT expression in astrocytic culture during normoxia and hypoxia. Values are means ± SE. The asterisks (**) indicate that there are significant differences between astrocytes in normoxia (21%) and astrocytes exposed to hypoxia for 3h, 6h, 12h, and 24h (p<0.0001).
PGT expression in primary cultures
In order to find out which cell type expresses PGT, we resorted to in-vitro techniques and performed primary astrocytic and neuronal cultures. Immunoblot analysis of cell cultures raised in normal ambient O2 concentration showed that there was a strong contrast in the expression of PGT between neurons and astrocytes. Neurons expressed 10x more PGT than astrocytes (Fig. 3B). We also used 1% O2 environment for 1–3 days to study the effect of hypoxia on PGT expression in each of the glial and neuronal cultures. PGT expression significantly decreased within the first 24h in cortical neurons (p<0.001) and continued to decline (p<0.0001) subsequently by several fold (Fig 3C). In cultured astrocytes, however, this protein increased significantly, starting as early as 3 hours of exposure to hypoxia (p<0.001) and remained 3 times elevated throughout all the times studied (Fig 3D).
Discussion
In this study we have made a number of salient observations. First, in adult mouse brain, PGT is present in all the regions studied. Second, we used in our experiments microsomal preparations from four different brain regions (cortex, hippocampus, cerebellum and brainstem/diencephalon) and demonstrated that the cortex has the highest expression of PGT in the mouse brain. We would like to note that PGT expression may be highly coordinated with the synthesis and release of prostaglandins since Bao et al. (2002) have shown that PGT expression is limited to cells that synthesize and release prostaglandins. The same investigators have also shown that cyclooxygenase-2 (COX-2) – an inducible enzyme which catalyses PG formation in the brain, as well as PGT, are coordinately induced in Swiss 3T3 cells in-vitro (Schuster, 1998). Third, brain PGT expression seems to take place mostly after the first 2 weeks postnatally in mice and increases with maturation, suggesting that the role of PGT is important after the immediate postnatal life. It is of interest to note that brain prostanoid formation is low at birth and increases during development, reaching nearly adult capacity by postnatal 3–4 weeks of life (Seregi et al., 1986). COX-2 expression in the brain is not detectable early in life, but appears in “juvenile” animals and increases with age (Kaufmann et al., 1996). Fourth, our in-vitro experiments showed that neurons, unlike astrocytes, express high levels of PGT under normoxic conditions, suggesting that PGT is present mostly in neurons.
Stress, such as hypoxia and ischemia, has been shown to upregulate the PGs and PG receptor production in many areas of the brain (Nogawa et al., 1997; Pepicelli et al., 2005; Candelario-Jalil et al., 2005; Li et al., 2003). In contrast, we found that PGT was decreased in all brain regions when mice were exposed to hypoxic stress. While this may be surprising at first, these results suggest that a decrease in PGT expression could promote an increase in the action of PGs on their receptors since less PGs would be taken up intracellularly. Whether this is beneficial to neurons remains to be elucidated.
In in-vitro experiments done to test the response of neurons and astrocytes separately to hypoxia, we found that exposure of cultured neurons to hypoxia decreased PGT expression significantly, as we found in vivo in whole brain. In contrast, the expression of this transporter in astrocytes was upregulated during hypoxia, even within a few hours, and stayed at a similar level for the rest of the experimental period. From our data, it seems also that the decrease in PGT expression during hypoxia in neurons is greater than the increase in PGT expression in glia, indicating that there is a differential expression of PGT in different cell types in the brain as well as a specificity of response to hypoxia.
Is this change in brain PGT expression of potential importance in the brain during hypoxia? Since lactate is a driving force for PG transport by PGT (Chan et al., 2002), there might be a potentially important link between brain glucose metabolism and brain PGT expression. Astrocytes and neurons are tightly associated cellular networks, and it has been suggested by Pellerin and Magistretti (1994) that neuronal activity is coupled to glucose utilization, via an astrocyte-neuron lactate shuttle. Accordingly, glutamate released by neurons is taken up by astrocytes, which in turn activates glucose uptake and subsequent glycolysis by these cells. Lactate produced as a result of glycolysis in astrocytes is exported to and taken up by neurons to serve as a substrate for oxidative phosphorylation in activated neurons. To date, evidence has accumulated that under normoxic conditions atrocytes and neurons have distinct metabolic preferences (McKenna et al., 1993; McKenna et al., 2001; Pellerin et al., 1998). Astrocytes consume glucose and generate large amounts of lactate, whereas neurons preferentially utilize lactate to support their oxidative metabolism (Bouzier-Sore et al., 2006; McKenna et al., 2001). Thus, the presence of PGT in neurons during normoxic baseline conditions is important not only for PG transport but also for metabolic and energy substrate trafficking.
Hypoxia, observed in many pathological states and conditions, is characterized by upregulation of COX-2 (Li et al., 2003) and increased PG production in mature brain (Bazan et al., 2002; Graham and Hickey, 2003). Since hypoxia is characterized by increased glycolysis and elevated lactate production, it is possible that PGT is important for cell survival during hypoxia through activation of the lactate shuttle and clearance of upregulated production of PGs via lactate-PG exchange. For example, astrocytes upregulated PGT expression in hypoxia, thus promoting the extrusion of produced lactate for PG uptake. It also enables the brain to remove PGs from astrocytic end-feet processes into the vasculature, which expresses PGT abundantly (Kis et al., 2006). This exchange by astrocytes is especially important since, unlike other organs, the mature brain lacks the capability to degrade PGs. Indeed, the rate limiting enzyme of prostaglandin catabolism, 15-hydroxy-PG dehydrogenase, is not present during later periods of life (Krunic et al., 2000).
In neurons, in contrast, PGT expression was significantly decreased with hypoxia. During such stress, neurons switch to glucose as a primary metabolic substrate for their metabolism (Ransom and Fern, 1997) and increase glucose uptake (GLUT3) (Vannucci et al., 1997; Zovein et al., 2004) and glycolysis, thus accumulating intracellular lactate. It is possible therefore that the decreased neuronal PGT expression during hypoxia might be the result of a negative feedback to lower the PGTs since lactate would be increased. However, it is also possible that the monocarboxylate transporters (Pierre and Pellerin, 2005; Ullah et al., 2006) could be increased to alleviate the intracellular lactate load. In that case, the explanation for the neuronal decrease in PGTs during hypoxia may not be apparent at present.
This is the first report, demonstrating that 1) PGT has regional and developmental differential expression in the CNS and 2) astrocytes and neurons express PGT differently under basal and hypoxic conditions. Our experiments provide new data about the developmental and cell specific alterations in the brain PGT during normal and low O2.
Acknowledgments
We would like to thank Dr. Victor L. Schuster for suggestions and helpful discussions. Supported by NIH 5P01HD32573 (GGH).
Abbreviations
- PGT
prostaglandin transporter
- PGs
prostaglandins
- CNS
central nervous system
- CX
cortex
- HC
hippocampus
- CB
cerebellum
- BS
brainstem/diencephalon
- P
postnatal
- COX
cyclooxygenase
Footnotes
Publisher's Disclaimer: This is a PDF file of an unedited manuscript that has been accepted for publication. As a service to our customers we are providing this early version of the manuscript. The manuscript will undergo copyediting, typesetting, and review of the resulting proof before it is published in its final citable form. Please note that during the production process errors may be discovered which could affect the content, and all legal disclaimers that apply to the journal pertain.
References
- Ahmadi S, Lippross S, Neuhuber Wl, Zeilhofer HU. PGE(2) selectively blocks inhibitory glycinergic neurotransmission onto rat superficial dorsal horn neurons. Nat Neurosci. 2002;5(1):34–40. doi: 10.1038/nn778. [DOI] [PubMed] [Google Scholar]
- Bao Y, Pucci ML, Chan BS, Lu R, Ito S, Schuster VL. Prostaglandin transporter PGT is expressed in the cell types that synthesize and release prostanoids. AJP- Renal. 2002;282:1103–1110. doi: 10.1152/ajprenal.00152.2001. [DOI] [PubMed] [Google Scholar]
- Bazan NG, Colangelo V, Lukiw WJ. Prostaglandins and other lipid mediators in Alzheimer’s disease. Prostaglandins Other Lipid Mediat. 2002;68–69:197–210. doi: 10.1016/s0090-6980(02)00031-x. [DOI] [PubMed] [Google Scholar]
- Bazan NG, Palacios-Pelaez R, Lukiw WJ. Hypoxia signaling to genes: significance in Alzheimer’s disease. Mol Neurobiol. 2002;26(2–3):283–98. doi: 10.1385/MN:26:2-3:283. [DOI] [PubMed] [Google Scholar]
- Bazan NG, Rodriguez de Turco EB, Allan G. Mediators of injury in neurotrauma: intracellular signal transduction and gene expression. J Neurotrauma. 1995;12(5):791–814. doi: 10.1089/neu.1995.12.791. [DOI] [PubMed] [Google Scholar]
- Bouzier-Sore AK, Voisin P, Bouchaud V, Bezancon E, Franconi JM, Pellerin L. Competition between glucose and lactate as oxidative energy substrates in both neurons and astrocytes: a comparative NMR study. Eur J Neurosci. 2006;24(6):1687–94. doi: 10.1111/j.1460-9568.2006.05056.x. [DOI] [PubMed] [Google Scholar]
- Brewer GJ. Serum-free B27/neurobasal medium supports differentiated growth of neurons from the striatum, substantia nigra, septum, cerebral cortex, cerebellum, and dentate gyrus. J Neurosci Res. 1995;42(5):674–83. doi: 10.1002/jnr.490420510. [DOI] [PubMed] [Google Scholar]
- Bryan RN, Bossinger J, Hayashi M. Tubulin and actin synthesis during brain development. Dev Biol 30. 1981;81(2):349–55. doi: 10.1016/0012-1606(81)90299-2. [DOI] [PubMed] [Google Scholar]
- Candelario-Jalil E, Slawik H, Ridelis I, Waschbisch A, Akundi RS, Hull M, Fiebich BL. Regional distribution of the prostaglandin E2 receptor EP1 in the rat brain: accumulation in Purkinje cells of the cerebellum. J Mol Neurosci. 2005;27(3):303–10. doi: 10.1385/JMN:27:3:303. [DOI] [PubMed] [Google Scholar]
- Chan BS, Endo S, Kanai N, Schuster VL. Identification of lactate as a driving force for prostanoid transport by prostaglandin transporter PGT. Am J Physiol Renal Physiol. 2002;282:F1097–1102. doi: 10.1152/ajprenal.00151.2001. [DOI] [PubMed] [Google Scholar]
- Chan BS, Satriano JA, Pucci M, Schuster VL. Mechanism of prostaglandin E2 transport across the plasma membrane in HeLa cells and Xenopus oocytes expressing the prostaglandin transporter “PGT”. J Biol Chem. 1998;273:6689–6697. doi: 10.1074/jbc.273.12.6689. [DOI] [PubMed] [Google Scholar]
- Chen C, Bazan NG. Lipid signaling: Sleep, synaptic plasticity, and neuroprotection. Prostaglandins Other Lipid Mediat. 2005;77 (1–4):65–76. doi: 10.1016/j.prostaglandins.2005.07.001. [DOI] [PubMed] [Google Scholar]
- Chen C, Magee JC, Bazan NG. Cyclooxygenase-2 regulates prostaglandin E2 signaling in hippocampal long-term synaptic plasticity. J Neurophysiol. 2002;87(6):2851–7. doi: 10.1152/jn.2002.87.6.2851. [DOI] [PubMed] [Google Scholar]
- Chesler M. Failure and function of intracellular pH regulation in acute hypoxic-ischemic injury of astrocytes. Glia. 2005;50(4):398–406. doi: 10.1002/glia.20141. [DOI] [PubMed] [Google Scholar]
- Coleman RA, Smith WL, Narumiya S. International union of pharmacology classification of prostanoid receptors: properties, distribution, and structure of the receptors and their subtypes. Pharmacol Rev. 1994;46:205–229. [PubMed] [Google Scholar]
- Douglas RM, Xue J, Chen JY, Haddad CG, Alper SL, Haddad GG. Chronic intermittent hypoxia decreases the expression of Na/H exchangers and HCO3-dependent transporters in mouse CNS. J Appl Physiol. 2003;95(1):292–9. doi: 10.1152/japplphysiol.01089.2002. [DOI] [PubMed] [Google Scholar]
- D’Souza SM, Brown IR. Constitutive expression of heat shock proteins Hsp90, Hsc70, Hsp70 and Hsp60 in neural and non-neural tissues of the rat during postnatal development. Cell Stress Chaperones. 1998;3(3):188–99. doi: 10.1379/1466-1268(1998)003<0188:ceohsp>2.3.co;2. [DOI] [PMC free article] [PubMed] [Google Scholar]
- Grassl SM, Aronson PS. Na+/HCO3- co-transport in basolateral vesicles isolated from rabbit renal cortex. J Biol Chem. 1986;261:8778–8783. [PubMed] [Google Scholar]
- Gonzalez-Correa JA, Arrebola MM, Urena IM, Guerrero A, Munoz-Marin J, Ruiz-Villafranca D, Sanchez de la Cuesta F, De La Cruz JP. Effects of trifluzal on oxidative stress, prostaglandin production and nitric oxide pathway in a model of anoxia-reoxygenation in rat brain slices. Brain Research. 2004;1011:148–155. doi: 10.1016/j.brainres.2004.02.069. [DOI] [PubMed] [Google Scholar]
- Graham SH, Hickey RW. Cyclooxygenases in central nervous system diseases: a special role for cyclooxygenase 2 in neuronal cell death. Arch Neurol. 2004;60(4):628–30. doi: 10.1001/archneur.60.4.628. [DOI] [PubMed] [Google Scholar]
- Harik SI, Hritz MA, LaManna JC. Hypoxia increases glucose transport at blood-brain barrier in rats. J Appl Physiol. 1994;77:896–901. doi: 10.1152/jappl.1994.77.2.896. [DOI] [PubMed] [Google Scholar]
- Iadecola C, Gorelick PB. The Janus face of cyclooxygenase-2 in ischemic stroke: shifting toward downstream targets. Stroke. 2005;36(2):182–5. doi: 10.1161/01.STR.0000153797.33611.d8. [DOI] [PubMed] [Google Scholar]
- Kanaan A, Farahani R, Douglas RM, Lamanna JC, Haddad GG. Effect of chronic continuous or intermittent hypoxia and reoxygenation on cerebral capillary density and myelination. Am J Physiol Regul Integr Comp Physiol. 2006;290(4):R1105–14. doi: 10.1152/ajpregu.00535.2005. [DOI] [PubMed] [Google Scholar]
- Kaufmann WE, Worley PF, Pegg J, Bremer M, Isakson P. COX-2, a synaptically induced enzyme, is expressed by excitatory neurons at postsynaptic sites in rat cerebral cortex. Proc Natl Acad Sci U S A 19. 1996;93(6):2317–21. doi: 10.1073/pnas.93.6.2317. [DOI] [PMC free article] [PubMed] [Google Scholar]
- Kis B, Isse T, Snipes JA, Chen L, Yamashita H, Ueta Y, Busija DW. Effects of LPS stimulation on the expression of prostaglandin carriers in the cells of the blood-brain and blood-cerebrospinal fluid barriers. J Appl Physiol. 2006;100(4):1392–9. doi: 10.1152/japplphysiol.01259.2005. [DOI] [PubMed] [Google Scholar]
- Krunic N, Adamson SL, Ackerley C, Okita RT, Ciceani F. Perinatal changes in choroidal 15-hydroxyprostglandin dehydrogenase: implications for prostaglandin removal from brain. Brain Res Dev Brain Res. 2000;121:145–155. doi: 10.1016/s0165-3806(00)00033-x. [DOI] [PubMed] [Google Scholar]
- Kunz A, Anrather J, Zhou P, Orio M, Iadecola C. Cyclooxygenase-2 does not contribute to postischemic production of reactive oxygen species. J Cereb Blood Flow Metab. 2006 July 5; doi: 10.1038/sj.jcbfm.9600369. Epub ahead of print. [DOI] [PubMed] [Google Scholar]
- Leffler CW, Parfenova H. Cerebral arteriolar dilatation to hypoxia: role of prostanoids. Am J Physiol. 1997;272(1 Pt 2):H418–24. doi: 10.1152/ajpheart.1997.272.1.H418. [DOI] [PubMed] [Google Scholar]
- Li RC, Row BW, Gozal E, Kheirandish L, Fan Q, Brittian KR, Guo SZ, Sachleben LR, Jr, Gozal D. Cyclooxygenase 2 and intermittent hypoxia-induced spatial deficits in the rat. Am J Respir Crit Care Med. 2003;168(4):469–75. doi: 10.1164/rccm.200211-1264OC. [DOI] [PubMed] [Google Scholar]
- Lu R, Kanai N, Bao Y, Schuster VL. Cloning, in vitro expression, and tissue distribution of a human prostaglandin transporter cDNA(hPGT) J Clin Invest. 1996;98(5):1142–9. doi: 10.1172/JCI118897. [DOI] [PMC free article] [PubMed] [Google Scholar]
- Manabe Y, Anrather J, Kawano T, Niwa K, Zhou P, Ross ME, Iadecola C. Prostanoids, not reactive oxygen species, mediate COX-2-dependent neurotoxicity. Ann Neurol. 2004;55(5):668–75. doi: 10.1002/ana.20078. [DOI] [PubMed] [Google Scholar]
- McCarthy KD, Prime J, Harmon T, Pollenz R. Receptor-mediated phosphorylation of astroglial intermediate filament proteins in cultured astroglia. J Neurochem. 1985;44(3):723–30. doi: 10.1111/j.1471-4159.1985.tb12875.x. [DOI] [PubMed] [Google Scholar]
- McKenna MC, Tildon JT, Stevenson JH, Boatright R, Huang S. Regulation of energy metabolism in synaptic terminals and cultured rat brain astrocytes: differences revealed using aminooxyacetate. Dev Neurosci. 1993;15(3–5):320–9. doi: 10.1159/000111351. [DOI] [PubMed] [Google Scholar]
- McKenna MC, Hopkins IB, Carey A. Alpha-cyano-4-hydroxycinnamate decreases both glucose and lactate metabolism in neurons and astrocytes: implications for lactate as an energy substrate for neurons. J Neurosci Res. 2001;66(5):747–54. doi: 10.1002/jnr.10084. [DOI] [PubMed] [Google Scholar]
- Minghetti L. Cyclooxygenase- 2 (COX-2) in inflammatory and degenerative brain disease. J Neuropathol Exp Neurol. 2004;63(9):901–10. doi: 10.1093/jnen/63.9.901. [DOI] [PubMed] [Google Scholar]
- Narumiya S, Sugimoto Y, Ushikubi F. Prostanoid receptors: structures, properties, and functions. Physiol Rev. 1999;79:1193–1226. doi: 10.1152/physrev.1999.79.4.1193. [DOI] [PubMed] [Google Scholar]
- Niwa K, Araki E, Morham SG, Ross ME, Iadecola C. Cyclooxygenase-2 contributes to functional hyperemia in whisker-barrel cortex. J Neurosci. 2000;20:763–770. doi: 10.1523/JNEUROSCI.20-02-00763.2000. [DOI] [PMC free article] [PubMed] [Google Scholar]
- Nogawa S, Zhang F, Ross ME, Iadecola C. Cyclo-oxygenase-2 gene expression in neurons contributes to ischemic brain damage. J Neurosci. 1997;17(8):2746–55. doi: 10.1523/JNEUROSCI.17-08-02746.1997. [DOI] [PMC free article] [PubMed] [Google Scholar]
- Pellerin L, Magistretti PJ. Glutamate uptake in astrocytes stimulates aerobic glycolysis: a mechanism coupling neuronal activity to glucose utilization. Proc Natl Acad Sci USA. 1994;91:10625–10629. doi: 10.1073/pnas.91.22.10625. [DOI] [PMC free article] [PubMed] [Google Scholar]
- Pellerin L, Pellegri G, Bittar PG, Charnay Y, Bouras C, Martin JL, Stella N, Magistretti PJ. Evidence supporting the existence of an activity-dependent astrocyte-neuron lactate shuttle. Dev Neurosci. 1998;20(4–5):291–9. doi: 10.1159/000017324. [DOI] [PubMed] [Google Scholar]
- Pepicelli O, Fedele E, Berardi M, Raiteri M, Levi G, Greco A, Ajmone-Cat MA, Minghetti L. Cyclo-oxygenase-1 and -2 differently contribute to prostaglandin E2 synthesis and lipid peroxidation after in vivo activation of N-methyl-D-aspartate receptors in rat hippocampus. J Neurochem. 2005;93(6):1561–7. doi: 10.1111/j.1471-4159.2005.03150.x. [DOI] [PubMed] [Google Scholar]
- Pierre K, Pellerin L. Monocarboxylate transporters in the central nervous system: distribution, regulation and function. J Neurochem. 2005;94(1):1–14. doi: 10.1111/j.1471-4159.2005.03168.x. [DOI] [PubMed] [Google Scholar]
- Ransom BR, Fern R. Does astrocytic glycogen benefit axon function and survival in CNS white matter during glucose deprivation? Glia. 1997;21(1):134–41. [PubMed] [Google Scholar]
- Schuster VL. Molecular mechanisms of prostaglandin transport. Annu Rev Physiol. 1998;60:221–242. doi: 10.1146/annurev.physiol.60.1.221. [DOI] [PubMed] [Google Scholar]
- Seregi A, Keller M, Hertting G. Are cerebral prostanoids of astroglial origin? Studies on the prostanoid forming system in developing rat brain and primary cultures of rat astrocytes. Brain Res. 1987;404(1–2):113–20. doi: 10.1016/0006-8993(87)91361-8. [DOI] [PubMed] [Google Scholar]
- Toyomoto M, Ohta M, Okumura K, Yano H, Matsumoto K, Inoue S, Hayashi K, Ikeda K. Prostaglandins are powerful inducers of NGF and BDNF production in mouse astrocyte cultures. FEBS Letters. 2004;562:211–215. doi: 10.1016/S0014-5793(04)00246-7. [DOI] [PubMed] [Google Scholar]
- Ullah MS, Davies AJ, Halestrap AP. The plasma membrane lactate transporter MCT4, but not MCT1, is up-regulated by hypoxia through a HIF-1alpha-dependent mechanism. J Biol Chem. 2006;281(14):9030–7. doi: 10.1074/jbc.M511397200. [DOI] [PubMed] [Google Scholar]
- Urade Y, Hayashi O. Prostaglandin D2 and sleep regulation. Biochem Biophys Acta. 1999;1436(3):606–15. doi: 10.1016/s0005-2760(98)00163-5. [DOI] [PubMed] [Google Scholar]
- Vannucci SJ. Developmental expression of GLUT1 and GLUT3 glucose transporters in rat brain. J Neurochem. 1994;62:240–246. doi: 10.1046/j.1471-4159.1994.62010240.x. [DOI] [PubMed] [Google Scholar]
- Vannucci SJ, Simpson IA. Developmental switch in brain nutrient transporter expression in the rat. AJP-Endo. 2003;285:1127–1134. doi: 10.1152/ajpendo.00187.2003. [DOI] [PubMed] [Google Scholar]
- Vannucci SJ, Seaman LB, Vannucci RC. Effects of hypoxia-ischemia on GLUT1 and GLUT3 glucose transporters in immature rat brain. J Cereb Blood Flow Metab. 1996;16(1):77–81. doi: 10.1097/00004647-199601000-00009. [DOI] [PubMed] [Google Scholar]
- Zhu T, Gobeil F, Vazquez-Tello A, Leduc M, Rihakova L, Bossolasco M, Bkaily G, Peri K, Varma DR, Orvoine R, Chemtob S. Intracrine signaling through lipid mediators and their cognate nuclear G-protein-coupled receptors: a paradigm based on PGE2, PAF, and LPA1 receptors. Can J Physiol Pharmacol. 2006;84(3–4):377–91. doi: 10.1139/y05-147. [DOI] [PubMed] [Google Scholar]
- Zovein A, Flowers-Ziegler J, Thamotharan S, Shin D, Sankar R, Nguyen K, Gambhir S, Devaskar SU. Postnatal hypoxic-ischemic brain injury alters mechanisms mediating neuronal glucose transport. Am J Physiol Regul Integr Comp Physiol. 2004;286(2):R273–82. doi: 10.1152/ajpregu.00160.2003. [DOI] [PubMed] [Google Scholar]