

Abstract
Objectives. Using the risk categories established by the 2006 US surgeon general's report, we estimated medical treatment costs related to exposure to secondhand tobacco smoke (SHS) in the state of Minnesota.
Methods. We estimated the prevalence and costs of treated medical conditions related to SHS exposure in 2003 with data from Blue Cross and Blue Shield (Minnesota's largest insurer), the Current Population Survey, and population attributable risk estimates for these conditions reported in the scientific literature. We adjusted treatment costs to the state level by health insurance category by using the Medical Expenditure Panel Survey.
Results. The total annual cost of treatment in Minnesota for conditions for which the 2006 surgeon general's report found sufficient evidence to conclude a causal link with exposure to SHS was $228.7 million in 2008 dollars—equivalent to $44.58 per Minnesota resident. Sensitivity analyses showed a range from $152.1 million to $330.0 million.
Conclusions. The results present a strong rationale for regulating smoking in public places and were used to support the passage of Minnesota's Freedom to Breathe Act of 2007.
In introductory remarks during the press conference to launch the 2006 report, Health Consequences of Involuntary Exposure to Tobacco Smoke: A Report of the Surgeon General,1 Surgeon General Richard Carmona stated that “the debate is over. The science is clear: secondhand smoke is not a mere annoyance, but a serious health hazard that causes premature death and disease in children and nonsmoking adults.”2 That report brought into public focus the epidemiological and medical evidence that has been accumulating rapidly in recent years about the dangers of secondhand tobacco smoke (SHS)—also known as environmental tobacco smoke, passive smoking, and involuntary smoking.
Knowledge about these dangers has advanced rapidly since the 1972 surgeon general's report first considered the health risks of SHS.3–5 The 1986 surgeon general's report, The Health Consequences of Involuntary Smoking, found evidence that exposure to SHS is linked to important medical conditions—including coronary heart disease, heart attacks, and chronic respiratory symptoms.1 In 1992, the Environmental Protection Agency classified SHS as a carcinogen6; more than 50 carcinogens have now been identified as components of SHS.1,7–9
The 2006 surgeon general's report found sufficient evidence to infer a causal relationship between exposure to SHS and both lung cancer and coronary heart disease. For infants and children, the evidence is sufficient to infer causality for low birthweight, sudden infant death syndrome (SIDS), lower-respiratory illness, otitis media, and asthma.1 Each year in the United States there are an estimated 3400 lung cancer deaths, 46 000 deaths from heart disease and heart attacks, and 430 cases of SIDS resulting from SHS exposure.10
However, the economic impact of SHS—and of efforts to limit smoking in public places—is still debated. Peer-reviewed studies have found that “smoke-free” laws have no adverse effects on hospitality industry sales and employment.11 For example, in the 9 months following the March 2003 implementation of a “smoke-free” policy for restaurants and bars in New York City, employment in restaurants and bars increased by 10 600 jobs and taxable receipts rose by 9%.12
The impact of SHS on health care costs is less well understood. In the United States, a study in Marion County, Indiana, identified $53.9 million in costs related to health care and premature loss of life attributable to SHS exposure—equivalent to $62.68 per capita annually.9 A study in New York City calculated annual costs of $99 million related to infants' developmental delays caused by prenatal exposure to SHS.13 A 2005 report from the American Society of Actuaries calculated that $2.6 billion was spent for medical care in the United States for lung cancer and heart disease (including heart attacks) in nonsmokers, caused by exposure to SHS. The report calculated an additional $3.2 billion in economic losses—including lost wages, benefits, and household services—caused by exposure to SHS. On a per-capita basis, this is equivalent to $9.02 for medical care and $11.10 for additional economic losses.14,15
These studies have not used standardized methodologies or data sources, and only a few unpublished studies of the medical economic costs of SHS provide state-level findings. Because many of the policy decisions to ban smoking in public places are made at the state level, the detailed analysis presented here will be relevant to the remaining half of the states contemplating such regulations.
In our study of costs related to exposure to SHS in the state of Minnesota, we used a large dataset of administrative claims data—from Blue Cross and Blue Shield of Minnesota (Blue Cross), the state's largest insurer—to estimate both the prevalence of treated medical conditions related to exposure to SHS and the costs of that treatment. These data on prevalence and costs drew on the epidemiological evidence compiled in the recent, definitive 2006 surgeon general's report of the health consequences of SHS exposure. With concepts from health services research, epidemiology, economics, and accounting, these data were extrapolated to estimate the annual health care costs of SHS to the state of Minnesota.
All calculations were based on data for the year 2003, the most recent year for which all necessary epidemiological, medical, and financial data were available. The state's population that year was 5.1 million people, and the adult smoking prevalence was 18.0%.16 In 2003, 65.3% of adult Minnesotans reported any exposure to SHS in the past 7 days.17 Among nonsmokers—the population that was the focus of this study—the rate of exposure to SHS was 59%.
METHODS
We used 5 main steps to generate our prevalence and cost estimates, (1) identify health conditions caused by secondhand smoke exposure, (2) determine the prevalence for each condition among Blue Cross members, (3) adjust the treated prevalence to the state level, (4) determine the number of episodes attributable to secondhand smoke, and (5) determine the cost per episode.
Health Conditions Caused by Secondhand Smoke Exposure
The 2006 surgeon general's report provides a list of health conditions for which there is sufficient evidence currently available to draw a causal link with exposure to SHS.1 For children, these conditions include low birthweight—defined as a weight of less than 2.5 kg at birth (because of maternal exposure to SHS); SIDS; acute lower respiratory illnesses (children aged 0–4 years); and otitis media, middle ear effusion, asthma, and wheeze illness (children aged 0–17 years). For adults 18 years and older, there are 2 conditions for which there is sufficient evidence of a causal link with exposure to SHS—lung cancer and coronary heart disease.
We mapped these conditions to Blue Cross claims data with the assistance of claims coding specialists at Blue Cross. The final disease list excluded a small number of subconditions related to these conditions—such as “cough, phlegm, wheeze, and breathlessness among school children” and “lower level of lung function during childhood”—because these could not be clearly mapped to coded medical conditions with administrative claims data. We did not include SIDS because it leads to immediate mortality instead of treatment. We also excluded conditions the surgeon general identified as having a “suggestive but not sufficient” causal link with exposure to SHS.
Treated Prevalence for Each Condition Among Blue Cross Members
The term “treated prevalence” used here indicates episodes of each SHS-related condition that actually received treatment and, thus, incurred medical costs. We used episode treatment group (ETG) codes, applied to administrative claims data from Blue Cross, to identify individuals with an episode—and the average cost per episode—for each of these conditions for calendar year 2003. The ETG methodology is a widely used episode-building system that draws on administrative claims data.
The ETG codes use diagnosis information submitted by physicians and other health care providers on insurance claims to identify the start of treatment of a given condition, and then aggregate subsequent treatment events and costs that pertain to the index condition, including professional services; inpatient and outpatient hospital services; laboratory, radiology, and pathology services; and prescribed pharmaceuticals. The ETG codes were designed to provide a consistent and clinically homogeneous set of categories that could serve as an analytical unit with which to measure the treatment patterns of patients across time.18 Because ETG codes group all claims related to a single clinical episode of illness, they offer a useful method to establish the treated prevalence of disease and to accurately assess related costs.
Using ETG codes, we calculated the treated prevalence of conditions among the 1.3 million Blue Cross members in Minnesota. These members belonged to 3 broad insurance groups: private commercial insurance, MinnesotaCare, and the Prepaid Medical Assistance Program. MinnesotaCare is a subsidized health care program for low-income Minnesota residents offered by Blue Cross and other insurers in the state; it is credited with contributing to reducing Minnesota's level of uninsured persons to among the lowest in the nation.19 It is funded by premiums, a tax on health care providers, the state, and federal matching dollars. MinnesotaCare is run as a prepaid health maintenance organization offered through a network.
The Prepaid Medical Assistance Program is a Medicaid managed-care program paid for by the state and the federal governments. (In addition, the state's General Assistance Medical Care program provides medical care for a monthly average of 37 000 low-income Minnesotans who do not qualify for Medical Assistance and other state and federal programs—primarily low-income adults aged 21 to 64 years who do not have any dependent children.) These 3 categories represent 3 of the 6 major insurance-status categories for the state. Through these 3 programs, Blue Cross insures 26% of Minnesota's population, including 23% of the population younger than 18 years and 32% of the working population aged 19 to 64 years.
Adjust Treated Prevalence to the State Level
By definition, the Blue Cross member population does not include uninsured persons and has only partial data for additional broad categories of insured persons—including private insurance, military insurance, Medicaid, and Medicare. To project the treated prevalence among Blue Cross members to the full population in the state, we used the Blue Cross claims data, the Current Population Survey,20 Minnesota Department of Health data, and Medicare data—as described in the following paragraphs.
The Current Population Survey provides the distribution of Minnesota's population into 6 different insurance-status groups, by age and gender (Table 1). Because the Current Population Survey systematically underestimates the number of individuals in Medicaid programs,24,25 we also used data from the Minnesota Health Access Survey,21 the Minnesota Department of Health, and the Minnesota Department of Human Services to categorize the population of Minnesota by health insurance status in 2003. For the Medicare population, the Center for Medicaid and Medicare Services provides Minnesota-specific data.22
TABLE 1.
Health Insurance Status of Minnesota's Population, by Age: 2003
| Primary Type of Health Insurance | Aged 0–17 Years | Aged 18–64 Years | Aged ≥ 65 Years | No. (%) |
| Private | 871 285 | 2 562 162 | 28 926 | 3 462 373 (67.5) |
| GAMC and Medical Assistance | 226 059 | 175 174 | 0a | 401 233 (7.8) |
| MinnesotaCare | 57 920 | 96 972 | 0a | 154 892 (3.0) |
| Military (Tricare) | 6 047 | 47 062 | 21 027 | 74 136 (1.4) |
| Medicare | 9 593 | 71 944 | 594 619 | 676 156 (13.2) |
| None | 58 945 | 300 302 | 1 244 | 360 490 (7.0) |
| Total | 1 229 849 | 3 253 616 | 645 816 | 5 129 281 (100) |
Note. GAMC = General Assistance Medical Care (a small state-funded program for low-income persons who do not qualify for medical assistance).
Source. Data were from the Current Population Survey,20 Minnesota Health Access Survey,21 Center for Medicaid and Medicare Services administrative count data,22 and Minnesota Department of Human Services.23
Individuals with dual eligibility for Medicaid or MinnesotaCare and Medicare were categorized as Medicare.
We calculated a weighted treated prevalence for each of the state's main insurance categories, by applying the treated prevalence of each condition in the Blue Cross populations to other state populations, with adjustments for age group and gender where appropriate.
First, we projected the treated prevalence for the insurance categories that directly correspond to the Blue Cross insurance categories. Next, the Blue Cross treated prevalence ratios were applied to the military group and the group with no insurance coverage. For military insurance, treated prevalence rates for Blue Cross private insurance served as a proxy, because the Tricare military insurance program is run as a private entity. To represent the uninsured group, we used the treated prevalence rates for Blue Cross Prepaid Medical Assistance Program members. For conditions affecting adults, separate treated prevalence rates were calculated and applied for the 2 different age groups, 18 to 64 years and 65 years and older.
There are 2 exceptions to this method of calculating the weighted treated prevalence of conditions linked to SHS. First, the prevalence of low birthweight was derived directly from data from the Minnesota Department of Health for calendar year 2003 because vital records data for the whole state are directly available, making extrapolation unnecessary.26 For low birthweight, we applied separate rates for male and female children for each of the insurance categories. Secondly, data from the American Cancer Society and the Agency for Health Care Research and Quality provide separate estimates of treated prevalence for the Medicare population.12,27 As a secondary Medicare payer through supplementary policies, Blue Cross does not have complete claims data for this population.
Determine Number of Episodes Attributable to Secondhand Smoke
The next step was to estimate the proportion of the episodes for each condition that can in fact be causally attributed to exposure to SHS by using the most recent valid estimates of the population attributable risk (PAR). The PAR is defined as the proportion of disease occurring in the total population that is attributable to the exposure.28
We used the most recent valid estimates in the published literature of the PAR for lung cancer, coronary heart disease, low birthweight, acute lower respiratory illnesses, and otitis media and middle ear effusion.9,10,29–31 In each of these cases, the setting was relevant for our study in Minnesota. For asthma, for which we have solid prevalence data—and for which there is no scientifically sound estimate in the published literature—we calculated the PAR from the relative risk estimates reported in the 2006 surgeon general's report and prevalence data from the Minnesota Department of Health.32 The formula for calculating the PAR in this way is as follows:
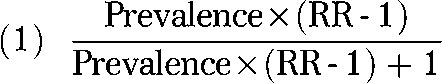 |
For each condition, the number of Minnesotans with episodes is multiplied by the applicable PAR to calculate the number of cases of each condition in Minnesota that can be attributed to exposure to SHS. We also carried out sensitivity analysis for the PAR estimates.
Determine Cost per Episode
For all conditions except for low birthweight, we analyzed 2003 Blue Cross claims data—stratified by age, gender, and insurance group—to calculate the average cost to treat a single episode of each disease for private insurance, including costs from all sites of service and billing sources. For low birthweight cost, we used recent estimates of the per-episode cost from the literature. (A recent study in California provides the best estimate of the costs of care for low birthweight children and their mothers. For all low birthweight births, the mean costs were $33 970 for care for the infant and an additional $7820 for care for the mother—for a total cost of $41 790.33) We then used the 2003 Medical Expenditure Panel Survey (MEPS) to determine the ratio of the average costs in each insurance-status category to the category of private insurance.34 We used the MEPS data for the Midwest region because there is not a sufficiently large sample at the state level for separate estimates for each insurance category.
Table 2 shows the ratios of average medical expenditures, with a comparison of different types of insurance to private commercial insurance coverage. We then used these ratios to adjust the average cost per case calculated from Blue Cross commercial insurance to determine the average cost for each condition and insurance category. Dollar values from 2003 were converted to 2008 dollars using the US Consumer Price Index for medical services.36
TABLE 2.
Health Insurance Status of Minnesota's Population in 2003 and Ratios of Average Total Medical Expenditures in the Midwest: Medical Expenditure Panel Survey, 2003
| Primary Health Insurance Status | Distribution, % | Average Total Medical Expenses, 2003 $ | Ratioa |
| Private | 66.8 | 2337 | 1.00 |
| Medicaid | 9.2 | 3201 | 1.37 |
| Medicare | 13.5 | 8631 | 3.69 |
| Military (Tricare) | 0.8 | 4255 | 1.82 |
| Uninsured | 9.7 | 1028 | 0.44 |
| Total | 100 | 3176 |
Source. Medical Expenditure Panel Survey.35
Compared with private commercial insurance coverage.
RESULTS
Table 3 shows the results for the calculations of the susceptible populations for each of the conditions that are causally related to exposure to SHS, the weighted treated prevalence of these conditions, and the resulting number of Minnesotans estimated to have suffered from these conditions in 2003. These results are displayed by age groups because of the difference in SHS-related diseases between adults and children and the difference in prevalence and cost data sources for adults aged 18 to 64 years and those aged 65 years and older.
TABLE 3.
Treated Prevalence of Conditions Causally Related to Secondhand Tobacco Smoke Exposure: Minnesota, 2003
| Conditions | Minnesota Susceptible Population in 2003a | Weighted Treated Prevalence | No. With Episodes of These Conditions |
| Minnesota population aged 0–17 yb | |||
| Low birthweightc | 70 053d | 0.06308 | 4419 |
| Acute lower respiratory illnesses | 273 300e | 0.11692 | 31 953 |
| Otitis media and middle-ear effusion | 1 229 849 | 0.19135 | 235 333 |
| Asthma, wheeze illness | 1 229 849 | 0.04077 | 50 135 |
| Minnesota population aged 18–64 yb | |||
| Lung cancer | 3 253 616 | 0.00107 | 34 66 |
| Coronary heart disease | 3 253 616 | 0.02272 | 73 914 |
| Minnesota population aged ≥ 65 yf | |||
| Lung cancer | 615 816 | 0.00689 | 4450 |
| Coronary heart disease | 615 816 | 0.04341 | 28 033 |
Population Data were from the Current Population Survey.15
Treated prevalence data were from Blue Cross claims data for adults aged 18–64 years and for children—with the exception of low birthweight, which is reported by the Minnesota Department of Health vital records.26
Defined as less than 2500 g.
All births.
Population younger than 4 years.
Table 4 displays the results of the process described in steps 4 and 5 of the “Methods” section—in which we used the PAR to calculate the percentage of each disease in the population that resulted from SHS exposure and then adjusted the average cost per episode for each age and insurance coverage group with the MEPS expenditure ratios. We used these data to calculate a weighted average for the average annual treatment costs for individuals with these conditions. Table 4 shows the weighted average cost for each condition and age group from step 5, as well as the estimated number of Minnesotans with an episode of each type of condition, and the total costs calculated in 2003 and 2008 dollars.
TABLE 4.
Costs of Conditions Attributable to Secondhand Tobacco Smoke (SHS), by Age Group: Minnesota, 2003
| No. With Episodes | PAR, % | No. of Episodes Attributable to SHS | Cost per Episode, 2003 $ | Total Cost, Millions of 2003 $ | Total Cost, Millions of 2008 $ | |
| Aged 0–17 ya | ||||||
| Low birthweight | 4 413 | 18.0 | 794 | 41 790 | 33.2 | 40.3 |
| Acute lower-respiratory illnesses | 31 953 | 25.0 | 7 988 | 848 | 6.8 | 8.2 |
| Otitis media and middle-ear effusion | 235 333 | 14.0 | 32 947 | 521 | 17.2 | 20.9 |
| Asthma, wheeze illness | 50 135 | 35.0 | 17 547 | 1 052 | 18.5 | 22.4 |
| Aged 18–64 yb | ||||||
| Lung cancer | 3 466 | 4.9 | 170 | 23 200 | 3.9 | 4.8 |
| Coronary heart disease | 73 914 | 6.9 | 5 100 | 9 650 | 49.2 | 59.7 |
| Aged ≥ 65 yb | ||||||
| Lung cancer | 4 450 | 4.9 | 218 | 58 303 | 12.7 | 15.4 |
| Coronary heart disease | 28 033 | 6.9 | 1 934 | 24 252 | 46.9 | 56.9 |
| Grand total | 228.7 |
Note. PAR = population attributable risk.
PAR for asthma and wheeze illness were calculated from the 2006 surgeon general's report1 and prevalence data from the Minnesota Department of Health32; PAR for low birthweight, acute lower respiratory illnesses, otitis media, and middle-ear effusion were calculated from Zollinger et al.9
PAR for lung cancer and coronary heart disease calculated from Zollinger et al.9 and Woodward and Laugesen.29 The California Environmental Protection Agency 2005 report Proposed Identification of Environmental Tobacco Smoke as a Toxic Air Contaminant10 includes a review of scientific studies in the United States and finds PARs in the range of 2.2% to 5.6% for lung cancer and 2.5% to 8.0% for coronary heart disease.
We carried out 2-way sensitivity analyses for both the PAR estimates and the ratios used from the MEPS to calculate the cost adjustments—simultaneously varying the PAR by 25%, and the cost estimates by 15%, both upward and downward. The results showed a range from a total of $152.1 million to $330.6 million.
DISCUSSION
We found substantial costs associated with exposure to SHS in the state of Minnesota. For calendar year 2003, the total cost of treatment of conditions for which the 2006 surgeon general's report found that there was sufficient evidence to make a causal link with exposure to SHS was $228.7 million, adjusted to 2008 dollars. This is equivalent to $44.58 per Minnesota resident.
We took advantage of a unique data source—claims data from Blue Cross and Blue Shield of Minnesota, the largest insurer in the state—as well as the evidence compiled by the 2006 surgeon general's report, to calculate the most detailed and methodologically rigorous estimate to date of the economic costs of SHS exposure.
We relied on Blue Cross data to estimate both the treated prevalence and the costs of medical conditions caused by exposure to SHS. Because Blue Cross is the largest insurer in the state, with a range of programs including coverage for low-income populations (Prepaid Medical Assistance Program) and commercial private insurance, the Blue Cross claims data represent the single best estimate of these costs. Wherever available, reliable outside sources supplemented the treated prevalence data.
In this study, we assumed that Blue Cross prevalence rates and average treatment costs could be applied to the remainder of the state's population. The prevalence and cost estimates were both adjusted—by using the Current Population Survey and the MEPS, respectively—to take account of differences in age and gender across different insurance coverage groups. There is likely to be a level of imprecision in these adjustments. Estimates of treated prevalence for the elderly population were based on data from the American Cancer Society (for lung cancer) and Medicare data from Agency for Health Care Research and Quality (for heart disease and stroke). In both cases, the data were specific to Minnesota.
The attribution of causality—that specific proportions of the medical conditions cited were caused by exposure to SHS—was a key step in our methods and one that was sensitive to the parameters used. To attribute causality to exposure to SHS, we used PAR estimates from the peer-reviewed literature—except for asthma, which was calculated directly from the relative risk estimates in the 2006 surgeon general's report.
By definition, the PAR is sensitive to the overall prevalence of the condition in question; estimates of the PAR can only be transferred from one setting to another if the prevalence of the condition is similar. Our results are also sensitive to calculations that compare the cost of medical care for population groups not insured by Blue Cross and Blue Shield—particularly the Medicare population and the uninsured—to the costs for groups that are. We therefore carried out 2-way sensitivity analysis for both the PAR estimates and the ratios used from the MEPS to calculate the cost adjustments—simultaneously varying the PAR by 25% and costs by 15%, both upward and downward.
It is important to note that the disease list we used in this study included only those medical conditions identified in the surgeon general's report as having sufficient evidence of a causal link with exposure to SHS, and did not include those considered to have a suggestive but not sufficient link. Long-term care costs, a large category, were not included, because it was beyond the scope of this study to attribute long-term care costs to specific conditions related to SHS. Indirect costs related to the opportunity cost of time lost because of illness and obtaining associated medical care—potential income or other benefits lost because of illness—were likewise not included. Similarly, the psychological costs of the negative effects of SHS, such as pain and suffering, were not calculated. Together, these costs could be substantial. Additionally, we used a 1-year time frame and did not take account of any costs that would occur in future years.
The 2003 Minnesota Adult Tobacco Survey estimated that 18.0% of adults in the state were smokers and that 65.3% of adults were exposed to SHS in any location in the 7 days prior to the survey.38 The results of this study have already provided justification to policymakers in that state for statewide legislation to restrict smoking in all workplaces, including restaurants and bars. The Minnesota Freedom to Breathe Act of 2007, which came into effect on October 1, 2007, prohibits smoking in public transportation, indoor public places, and places of employment, including bars, restaurants, private clubs, offices, and stores.
State-level medical cost data may be particularly valuable for policymakers in states that have not passed such statewide smoking bans. Across the United States, the rising cost of health care has created a crisis for state legislators. Connecting SHS exposure to rising medical costs could provide justification for passing these laws.
Acknowledgments
This study was made possible through financial support provided by Blue Cross and Blue Shield of Minnesota.
The authors would like to thank the following people for their assistance with extracting Blue Cross data, providing access to other data sources, and interpreting those data for use in this study: Philip Ailiff and Derek Pederson from Blue Cross and Blue Shield of Minnesota, Michael Davern from the University of Minnesota, Pete Rode and Stefan Gildemeister from the Minnesota Department of Health, and George Hoffman from the Minnesota Department of Human Services. We would also like to thank Patricia Bland for her comments on an earlier draft.
Human Participant Protection
No protocol approval was required—only secondary, aggregated, and deidentified data were used for this study.
References
- 1.The Health Consequences of Involuntary Exposure to Tobacco Smoke: A Report of the Surgeon General. Atlanta, GA: Office on Smoking and Health, Centers for Disease Control and Prevention; 2006 [PubMed] [Google Scholar]
- 2.Carmona RH. Remarks at press conference to launch Health Consequences of Involuntary Exposure to Tobacco Smoke: A Report of the Surgeon General. June 27, 2006 Available at: http://www.surgeongeneral.gov/news/speeches/06272006a.html. Accessed July 1, 2006
- 3.The Health Consequences of Smoking. Washington, DC: Public Health Service, Office of the Surgeon General; 1972 [Google Scholar]
- 4.Population Based Smoking Cessation: Proceedings of a Conference on What Works to Influence Cessation in the General Population. Bethesda, MD: National Cancer Institute; 2000. Smoking and tobacco control monograph no. 12 [Google Scholar]
- 5.Gerlach KK, Shopland DR, Hartman AM, Gibson JT, Pechacek TF. Workplace smoking policies in the United States: results from a national survey of more than 100,000 workers. Tob Control 1997;6:199–206 [DOI] [PMC free article] [PubMed] [Google Scholar]
- 6.Respiratory Health Effects of Passive Smoking: Lung Cancer and Other Disorders. Washington, DC: US Environmental Protection Agency; 1992 [Google Scholar]
- 7.US Department of Health and Human Services 9th Report on Carcinogens, Revised January 2001. Washington, DC: National Toxicology Program; 2001 [Google Scholar]
- 8.Aligne CA, Stoddard JJ. Tobacco and children. An economic evaluation of the medical effects of parental smoking. Arch Pediatr Adolesc Med 1997;151:648–653 [DOI] [PubMed] [Google Scholar]
- 9.Zollinger TW, Saywell RM, Jr, Overgaard AD, Jay SJ, Holloway AM, Cummings SF. Estimating the economic impact of secondhand smoke on the health of a community. Am J Health Promot 2004;18:232–238 [DOI] [PubMed] [Google Scholar]
- 10.Proposed Identification of Environmental Tobacco Smoke as a Toxic Air Contaminant. Part B: Health Effects. Sacramento: Office of Environmental Health Hazard Assessment, California Environmental Protection Agency; 2005 [Google Scholar]
- 11.Scollo M, Lal A, Hyland A, Glantz S. Review of the quality of studies on the economic effects of smoke-free policies on the hospitality industry. Tob Control 2003;12:13–20 [DOI] [PMC free article] [PubMed] [Google Scholar]
- 12.American Cancer Society Enacting Strong Smoke-Free Laws: The Advocate's Guide to Legislative Strategies. 2006. Available at: http://strategyguides.globalink.org/pdfs/Legislative_Strategies.pdf. Accessed October 1, 2006
- 13.Miller T, Rauh VA, Glied SA, et al. The economic impact of early life environmental tobacco smoke exposure: early intervention for developmental delay. Environ Health Perspect 2006;114:1585–1588 [DOI] [PMC free article] [PubMed] [Google Scholar]
- 14.Behan DF, Eriksen MP, Lin Y. Economic Effects of Environmental Tobacco Smoke. Schaumburg, IL: Society of Actuaries; 2005. Available at: http://www.soa.org/ccm/content/areas-of-practice/life-insurance/research/economic-effects-of-environmentaltobacco-smoke-SOA. Accessed October 1, 2006 [Google Scholar]
- 15.US Census Bureau Current Population Survey for 2004. Available at: http://www.census.gov/hhes/www/cpstc/cps_table_creator.html. Accessed October 1, 2006
- 16.Quitting Smoking, 1999–2003: Nicotine Addiction in Minnesota. Minneapolis: Blue Cross and Blue Shield of Minnesota, Minnesota Department of Health, Minnesota Partnership for Action Against Tobacco, and University of Minnesota; 2004 [Google Scholar]
- 17.Secondhand Smoke in Minnesota 1999–2003. Minneapolis: Minnesota Partnership for Action Against Tobacco, Blue Cross and Blue Shield of Minnesota, Minnesota Department of Health, and University of Minnesota; 2005 [Google Scholar]
- 18.Forthman MT, Dove HG, Wooster LD. Episode Treatment Groups (ETGs): a patient classification system for measuring outcomes performance by episode of illness. Top Health Inf Manage 2000;21:51–61 Available at: http://www.symmetry-health.com/products/product_SETG.php. Accessed September 1, 2006 [PubMed] [Google Scholar]
- 19.Minnesota Department of Human Services Prepaid Medical Assistance Program eligibility conditions. Available at: http://www.dhs.state.mn.us/main/idcplg?IdcService=GET_DYNAMIC_CONVERSION&RevisionSelectionMethod=LatestReleased&dDocName=dhs16_136855. Accessed November 1, 2006
- 20.Bureau of Labor Statistics, Bureau of the Census Current Population Survey. March 2004 demographic supplement. Available at: http://www.bls.census.gov/cps/datamain.htm. Accessed October 1, 2006
- 21.Todd-Malmlov A, Oftelie A, Call K, Ziegenfuss J. Health Insurance Coverage in Minnesota: Trends from 2001 to 2004. Minneapolis: Health Economics Program of the Minnesota Department of Health, University of Minnesota School of Public Health; 2006 [Google Scholar]
- 22.Cubanski J, Voris M, Kitchman M, Neuman T, Potetz L. Medicare Chart Book. Menlo Park, CA: Kaiser Family Foundation; 2005. Available at: http://www.kff.org/medicare/upload/Medicare-Chart-Book-3rd-Edition-Summer-2005-Report.pdf. Accessed November 1, 2006 [Google Scholar]
- 23.Minnesota Department of Health and Health Economics Program of the Minnesota School of Public Health Health Insurance Coverage in Minnesota, 2001 vs. 2004. Available at: http://www.health.state.mn.us/divs/hpsc/hep/index.html. Accessed November 5, 2008
- 24.Call KT, Davidson G, Davern M, Nyman R. Medicaid undercount and bias to estimates of uninsurance: new estimates and existing evidence. Health Serv Res 2008;43:901–914 [DOI] [PMC free article] [PubMed] [Google Scholar]
- 25.State Health Access Data Assistance Center and University of Minnesota School of Public Health Do national surveys overestimate the number of uninsured? Findings from the Medicaid Undercount Experiment in Minnesota. Translating Research to Policy 2004;9 [Google Scholar]
- 26.Minnesota Department of Health Live births statistics from 2003 Minnesota Health Statistics Annual Summary. Live births – Table 4 – Live births by birth weight group by live birth order and by sex – Minnesota residents. Available at: http://www.health.state.mn.us/divs/chs/03annsum/births.pdf. Accessed November 1, 2006
- 27.Agency for Health Care Research and Quality Procedures in US Hospitals, 2003. Healthcare Cost and Utilization Project. Available at: http://www.ahrq.gov/data/hcup. Accessed December 1, 2006
- 28.Mausner JS, Kramer S, Gann P, Bowen GS, Morton R, eds. Epidemiology—An Introductory Text. Philadelphia, PA: WB Saunders Co; 1985 [Google Scholar]
- 29.Woodward A, Laugesen M. How many deaths are caused by second hand cigarette smoke? Tob Control 2001;10:383–388 [DOI] [PMC free article] [PubMed] [Google Scholar]
- 30.Behan DF, Eriksen MP, Lin Y. Economic Effects of Environmental Tobacco Smoke. Schaumburg, IL: Society of Actuaries; 2005 [Google Scholar]
- 31.Office of Environmental Health Hazard Assessment Health Effects of Exposure to Environmental Tobacco Smoke. Berkeley: California Environmental Protection Agency; 1997 [Google Scholar]
- 32.Asthma in Minnesota. 2005 Epidemiology Report. Minneapolis: Minnesota Department of Health; 2005. Available at: http://www.health.state.mn.us/divs/hpcd/cdee/asthma/documents/epi2005.pdf. Accessed October 1, 2006 [Google Scholar]
- 33.Schmitt SK. Costs of newborn care in California: a population-based study. Pediatrics 2006;117:154–160 [DOI] [PMC free article] [PubMed] [Google Scholar]
- 34.Medical Expenditure Panel Survey—What Is MEPS? Rockville, MD: Agency for Healthcare Research and Quality; 2005 [Google Scholar]
- 35.Medical Expenditure Panel Survey Rockville, MD: Agency for Healthcare Research and Quality; Available at: http://www.meps.ahrq.gov/mepsweb. Accessed October 2006 [PubMed] [Google Scholar]
- 36.US Department of Labor, Bureau of Labor Statistics Consumer Price Indexes. Available at: http://www.bls.gov/cpi. Accessed November 2006
- 37.National Cancer Institute Surveillance Epidemiology and End Results (SEER) Cancer Statistics Review 1975–2003 [US complete prevalence counts, invasive cancers only, January 1, 2003, by age and prevalence]. Available at: http://seer.cancer.gov/csr/1975_2003/results_merged/topic_prevcounts.pdf. Accessed September 1, 2006
- 38.Minnesota Partnership for Action Against Tobacco, Blue Cross and Blue Shield of Minnesota, Minnesota Department of Health, and University of Minnesota. Secondhand Smoke in Minnesota, 1999–2003. Available at: http://www.health.state.mn.us/divs/hpcd/tpc/reports/secondhand2003.pdf. Accessed September 1, 2006