

Abstract
Background and Purpose:
Evolution of intracranial aneurysmal disease is known to be related to hemodynamic forces acting on the vessel wall. Low Wall Shear Stress (WSS) has been reported to have a negative effect on endothelial cells normal physiology and may be an important contributor to local remodeling of the arterial wall and to aneurysm growth and rupture.
Methods:
Seven patient-specific models of intracranial aneurysms were constructed using MR angiography data acquired at two different time points (mean 16.4 +/− 7.4 months between the two time points). Numerical simulations of the flow in the base-line geometries were performed to compute WSS distributions. The lumenal geometries constructed from the two time points were manually co-registered and the radial displacement of the wall was calculated on a pixel-by-pixel basis. This displacement, corresponding to the local growth of the aneurysm, was compared to the time-averaged wall shear stress (WSSTA) through the cardiac cycle at that location. For statistical analysis, radial displacement was considered to be significant if it was larger than half of the MR pixel resolution (0.3 mm).
Results:
Mean WSSTA values obtained for the areas with a displacement smaller and greater than 0.3 mm were 2.55 +/− 3.6 and 0.76 +/− 1.5 Pa respectively (p<0.001). A linear correlation analysis demonstrated a significant relationship between WSSTA and surface displacement (p<0.001).
Conclusions:
These results indicate that aneurysm growth is likely to occur in regions where the endothelial layer lining the vessel wall is exposed to abnormally low wall shear stress.
Keywords: Magnetic Resonance, Aneurysm, Hemodynamics, Endothelium
INTRODUCTION
With the development of non-invasive cerebrovascular imaging techniques, the frequency of diagnosis of unruptured cerebral aneurysms has increased since the incidence of those aneurysms in the general population is thought to be as high as 4.1%1. Intracranial aneurysms present a major threat to a patient's life because of the risk of rupture, thrombo-emboli, or compression of adjacent tissue. Most aneurysms, however, remain asymptomatic. Finding an unrupted intracranial aneurysm often leads to difficulties in the choice of treatment because of limited diagnostic criteria by which to predict the risk of rupture of the untreated aneurysm, or the risks of surgical intervention itself. Determining accurate criteria for predicting aneurysm growth and rupture would be important for therapeutic decision-making (e.g. medical follow-up, endovascular treatment, or surgery) as well as for planning of the specific surgical intervention to be employed. In this context, studying intra-aneurysmal hemodynamic forces, particularly wall shear stress (WSS) which is the tangential force produced by blood moving across the endothelial surface, is of great interest as there is increasing evidence that it plays a role in the evolution of aneurysmal disease. This stress acts on endothelial cell function and gene expression as well as on cell shape and structure. High WSS has recently been demonstrated to initiate aneurysm formation2, whereas low WSS leads to spatial disorganization of endothelial cells and a disregulation of anti-oxidant and anti-inflammatory mediators resulting in arterial wall remodeling3. This factor could be a major contributor to arterial aneurysm growth, since slow, recirculating flow leading to large regions of low WSS is observed in most aneurysms4-6.
The aim of this study is to determine the relationship between low WSS and local aneurysm growth in intracranial aneurysms, using Computational Fluid Dynamics (CFD) simulations based on patient-specific models obtained from serial in vivo MRI studies.
MATERIALS AND METHODS
Population
Seven patients were included in this study and IRB approval and informed consent were obtained for each patient. They were selected from an ongoing prospective study involving fourteen patients presenting with intracranial arterial aneurysms unsuitable for direct surgical treatment, such as clipping or coiling, because of an unfavorable anatomy or high operative risk. All patients were monitored with repeated MRI studies scheduled at 6 to 12 months intervals. For each of the patients selected for our analysis, the initial and most recent study were included resulting in a mean value of 16.4 +/− 7.4 months between the two time points. In order to be sure that the shear stress is applied directly to endothelium that abuts the arterial wall, five patients who were shown to have substantial intra-aneurysmal thrombus (assessed by MRI, see below) were excluded. Two other patients were excluded from analysis because their vascular anatomy did not permit a meaningful CFD simulation. One of these patients had a proximal lesion that was so stenotic that it prevented MR visualization of the residual lumen. The other patient had multiple branch vessels emanating from the body of the aneurysm and it was not possible to determine the flow boundary conditions for this anatomy. The seven included patients and their aneurysm data are summarized in table 1.
Table 1.
Patients and aneurysms data. Location of the aneurysms is Basilar artery, Internal Carotid Artery (ICA) or Middle Cerebral Artery (MCA). Change in volume between the two considered time points is in percentage.
| ID | Age (years) |
Location | Volume (mm3) (baseline) |
Volume (mm3) (follow-up) |
Change in volume(%) |
Time between examinations (months) |
|---|---|---|---|---|---|---|
| 1 | 67 | Basilar | 1933 | 1933 | 0 | 12 |
| 2 | 73 | Basilar | 2771 | 3445 | 24.3 | 11 |
| 3 | 60 | Basilar | 2002 | 1975 | −1.3 | 15 |
| 4 | 44 | ICA | 1195 | 1274 | 6.6 | 22 |
| 5 | 40 | ICA | 669 | 693 | 3.7 | 12 |
| 6 | 58 | ICA | 476 | 485 | 1.9 | 12 |
| 7 | 66 | MCA | 2877 | 3273 | 13.8 | 31 |
MR protocol and modeling of the aneurysm
MR studies were performed on a 1.5-Tesla scanner (Intera®, Philips Medical Systems, Best, The Netherlands). A three-step imaging protocol was used.
First, the absence of thrombus was confirmed using a 3D balanced Fast Field Echo (bFFE) sequence with TR=6ms, TE=2ms, flip angle=60°, number of averages=3, field of view=220mm, matrix=256×256, slice thickness=1mm, image resolution=0.86mm × 0.86mm × 1mm=0.74mm3, number of partitions=50, and acquisition time of about 4 minutes.
Then a contrast-enhanced MR angiography (CE-MRA) was performed using a 3D slab covering the vessels of interest with an injection of 18 ml GdDTPA followed by 15 ml of saline all delivered at 2 ml/s. The CE-MRA sequence used elliptic-centric phase reordering, and data were acquired using parallel imaging with an acceleration factor of 2. Imaging parameters included: TR/TE/flip angle=5/2/30°. Images were acquired from a 54 mm para-coronal slab, with an FOV of 240mm and an acquisition matrix of 400×380×45 zero-filled to 512×512×90. The resultant images had a resolution of 0.6mm × 0.6mm × 1.2mm=0.43mm3 and were interpolated to 0.47mm × 0.47mm × 0.6 mm=0.13mm3. Total acquisition time was of the order of 35 s.
Finally, in order to measure the aneurysm inlet flowrate for CFD modeling, through-plane phase-contrast MRI was performed transverse to the artery that supplied flow to the aneurysm. The MR angiogram was examined to determine a level where the proximal artery or arteries had a relatively straight course. The image slice was then placed perpendicular to the artery of interest on two orthogonal long-axis views. In the case of basilar artery aneurysms, this was performed separately for each vertebral. In addition, all imaging planes were chosen so that there were no branch vessels between the level where flow was determined, and the aneurysmal segment. Acquisition parameters were as follows: slice thickness=5 mm, field of view=150 mm, in-plane pixel size=1.1×1.1 mm, velocity-encoding level=50 cm/s. Approximately fifteen time points were acquired through the cardiac cycle, providing the time-varying inlet boundary conditions required for the pulsatile flow simulations. Images were examined following acquisition to ensure that there was no aliasing.
Model construction and numerical simulations
For each patient, CE-MRA data files obtained at the two time points were transferred to custom-built software to form three-dimensional isosurfaces7. In order to obtain these isosurfaces, a threshold intensity value was selected that defined the intra-lumenal volume of the vessels. For the first, or base-line time point, a threshold was selected and the resulting lumenal surface was superimposed on the native MR gray scale images. The threshold value was then incrementally adjusted until the generated lumenal surface visually matched the lumenal boundary of the MR gray-scale data. This method has been found to be highly reproducible with variations in estimates of the lumenal volume that are less than 3 %. In order to provide consistent threshholding from baseline to follow-up, we identified on the baseline study a reference healthy vessel segment that was assumed to remain unchanged over time (e. g. disease free segment of internal carotid). For the second or follow-up time point, subsequent thresholding was then constrained to produce identical volume measurements on that reference segment.
The obtained surfaces were then transferred into a 3D modeling software, Rapidform (INUS Technology, Seoul, South Korea), where the background noise and smaller vessels were removed from the main vessels of interest and a polygonal surface was formed. Remaining singularities and spikes were then removed, holes in the surface were filled, and Laplacian smoothing, which conserves global volume, was applied to make the surfaces continuous and regular. In the final stage, the surfaces were manually divided into rectangular patches, to be used as boundaries for the computational mesh. Total volume of the aneurysm was recorded for each time point7.
In order to determine the role of WSS in aneurysmal disease progression, numerical simulations of the flow in the base-line geometry were carried out for each patient. Although flow patterns evolve over time as the geometry changes, differences in velocity fields and therefore WSS distribution for base-line geometries and follow-up geometries were found to be extremely small, even for the subject with the greatest interval growth. A finite-volume package, Fluent (Fluent Inc., Lebanon, NH), was used to solve the governing Navier-Stokes equations. This solver has been successfully used in various biological fluid dynamics applications and has been extensively validated with experimental data6, 8, 9. For each patient, the base-line surface was imported into the Fluent pre-processor, Gambit, to generate the computational mesh. All patient models included extended sections of the parent vessels (with lengths that were more than several diameters long) as the aneurysmal flow is strongly dependent on the proximal geometry10. An unstructured mesh with a nominal resolution of 0.3 mm was generated on the domain, resulting in approximately half a million computational cells in each aneurysm model. In order to ensure that the calculated results did not depend on the resolution of the mesh, the numerical solution was repeated with increasingly refined meshes. The finest resolution below which results remained constant was then used for all patients as the aneurysm sizes were of the same order.
The flow was assumed to be laminar and Newtonian, which are good assumptions regarding the size of the studied intracranial vessels11. The waveform at each of the inlet vessels was specified from the MR phase velocity measurements at the corresponding location12. The arterial walls were assumed rigid consistent with our observations from cine-mode studies that there was no observable pulsatile displacement of the aneurysm wall in our subjects. The unsteady flow simulations were performed through three pulsatile cycles to eliminate the influence of initial transients. The WSS distribution was computed for each phase of the cardiac cycle and the results were exported in a generic format commonly used in postprocessing and computational software (Ensight, Computational Engineering International, Cary, NC).
In order to assess the local aneurysm growth for each patient, manual co-registration of aneurysmal geometries obtained from two consecutive time points (baseline and follow-up) was performed. Co-registration was performed using internal fiducial markers, the most important being vessel bifurcations and vessel junctions. Confirmation that co-registration had been achieved was provided by noting that there was excellent matching of surfaces in non-aneurysmal vessel segments. For each cell of the baseline surface mesh, a normal vector was generated. A ray was then extended in two directions along the length of this vector, starting from the iso-center of the considered cell and ending at the intersection with the surface of the lumen from the follow-up time point. The distance between these starting and ending points, corresponds to the so-called radial wall displacement. The sign of the radial displacement was positive (aneurysm expansion) if the follow-up surface was outside the baseline or negative (aneurysm contraction) if the follow-up surface was inside the baseline. Computing this radial wall displacement for all the cells resulted in a displacement map that could be displayed on the surface of the base-line aneurysm. As the displacement map and the corresponding WSS distribution map obtained from CFD results were generated as data sets on separate unstructured grids, we transformed them into the same structured grid at a reduced resolution so that data display and comparison could be readily performed (Figure 1). These results were simultaneously displayed for each cardiac phase in order to visualize the relationship between the descriptors (Figure 2).
Figure 1.

Displacement map: The baseline shape (blue, left) is co-registered with the shape at the follow-up time point (green, middle). The displacement map is then generated (right): red indicates larger displacement; blue corresponds to an unchanged surface from one time point to the next.
Figure 2.

Visual comparison of WSS map (left) and displacement map (right). Areas with low WSS (blue, left) match with areas of larger displacement (red, right). Similarly, areas of high WSS (red, left) correspond to no growth regions (blue, right).
Finally, in order to obtain a quantitative comparison between radial wall displacement and WSS, regular, discrete patches (approximately 100 patches per aneurysm) were distributed over the aneurysm surface and the radial displacement and WSS at the location of each patch was calculated. The size of each patch was 1 mm2 which corresponds to about 1000 endothelial cells13. The proximal and distal vessels were excluded from the analysis and the patches were considered only for the aneurysmal segment (Figure 3).
Figure 3.
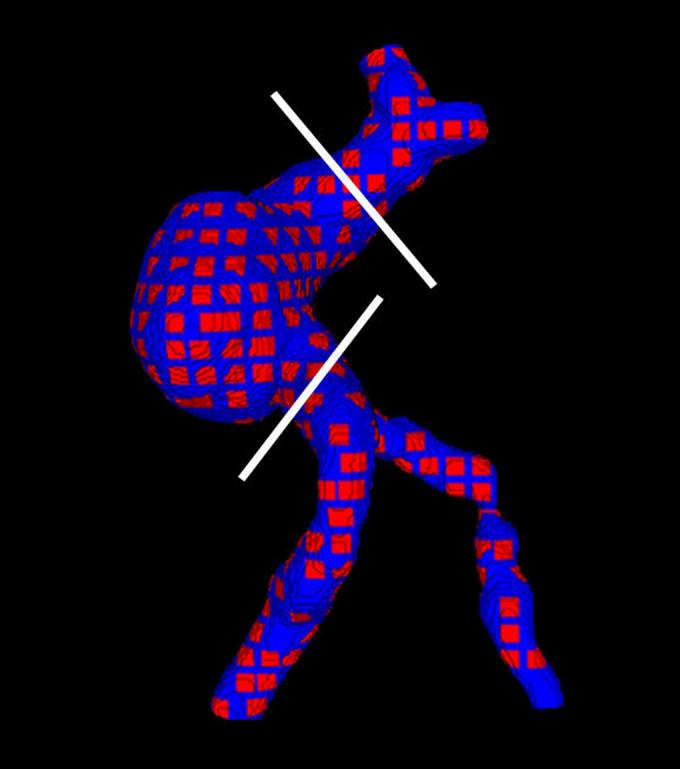
Sampling on the aneurysm: Patches are placed at regular intervals over the surface. White lines indicate the cut planes. Only the body of the aneurysm is taken into account in the statistical analysis.
The whole process, including: the extraction of aneurysmal geometry at follow-up; registration with the baseline geometry; calculation of radial displacement and calculation of total volume was repeated. The values of aneurysmal volumes and radial displacement expressed in the result section correspond to the mean values of these two registration measurements. In addition, the whole process was also repeated for the reference vessel in order to assess the variability of the method.
Statistical analysis
For each surface patch, the mean value of the radial wall displacement, and the mean value of the WSS at different heart phases were recorded. The time-averaged WSS (WSSTA) was then calculated for each patch as the average of WSS values through the cardiac cycle.
The mean local displacement for each patch was plotted as a function of the inverse of the WSSTA together with the LOWESS curves and a linear regression line. The LOWESS curve is useful to establish an overview of the relationship between the two parameters and unlike the linear regression line is not biased by outliers. A generalized estimating equation regression with robust standard errors was used to account for clustering by patient and to test the statistical significance of the association between displacement and inverse WSSTA. Displacement was considered to be significant if it was greater than half of the MRA pixel resolution (i.e. greater than 0.3 mm). WSSTA values in each category (lower and greater than 0.3 mm) were compared by using an unpaired t-test with unequal variance.
The intra-technique variability of the radial displacement was expressed as the standard deviation, for each patch, of the differences between the two registration experiments for the aneurysms and for the reference vessel. The 95% confidence interval was also calculated.
The error in volume measurement for each reference vessel and each aneurysm at follow-up was calculated as the absolute value of the difference of the two measurements divided by the average of the two measurements14.
All statistical analysis was made with Intercooled Stata 9.1 (StataCorp LP, College Station, Texas, USA).
RESULTS
A complete analysis was carried out for all patients. Mean aneurysmal volume at baseline was 1703 +/− 956 mm3 (range 476 – 2877). Mean change in volume was 7.0 +/− 9.1 % (range −1.3 – 24.3). A total of 738 one square millimeter surface patches were analyzed from the 7 patients.
Mean radial wall displacement was 0.19 +/− 0.34 mm (range −0.26 – 1.96); 592 patches (80 %) were found to have a displacement of less than 0.3 mm and 146 (20 %) had a displacement equal to or greater than 0.3 mm.
Mean WSSTA was 2.55 +/− 3.65 Pa (range 0.03 – 21.87) and 0.76 +/− 1.51 Pa (range 0.03 – 9.44) for patches with a displacement lower and greater than 0.3 mm respectively (t=9.15; p<0.001).
The Lowess curve shows a trend for patches with higher inverse WSSTA values to have a larger wall displacement. The estimated change in displacement was 0.24 mm per standard deviation change in inverse WSSTA (95% CI: 0.18 to 0.30, p<0.001) (Figure 4).
Figure 4.

Scatter Plot of the local displacement as a function of the inverse of time-averaged WSS (WSSTA) showing a clear trend for increased growth (high values of displacement) at patches that experience low WSS through the cardiac cycle (i.e. high values of inverse WSSTA). A linear regression (black) fit to the data (p<0.001). The LOWESS curve (grey) closely follows the linear regression curve, confirming that linear regression is reasonable both locally and globally and is not biased by outliers.
The standard deviation of the differences in radial displacement between the two registration experiments was 0.09 mm for patches on the aneurysmal segment (resulting in a 95% CI of +/−0.17 mm for the values of radial displacement), and 0.05 mm (95% CI of +/− 0.1) for the reference vessels.
The mean error in volume measurement was 2.0 +/ 1.0 % (range: 0.1-3.0%) for the aneurysms at follow-up, and 1.1 +/− 0.8 % (range: 0-2.0) for the reference vessels.
DISCUSSION
This study uses data from non-invasive imaging performed in longitudinal studies on subjects with untreated intracranial aneurysms to establish a relationship between local aneurysm growth and areas of low wall shear stress at the lumenal surface. This is the first report in a series of patients where quantitative analyses, in three dimensions, of changes in geometric morphology at specific locations on the aneurysm surface were related to the hemodynamic forces at those locations, determined on a patient-specific basis.
Wall shear stress is created by the flow of blood over the endothelial cell surface. Even if details of the cell transduction pathway remain unknown (action on cell membrane, mechanoreceptor or directly on the cytoskeleton15-17), WSS is increasingly understood as a major physiological stimulus for the vessel endothelium. Indeed, regular physiological WSS, as observed in healthy blood vessels, promotes endothelial cell survival and quiescence, alignment in the direction of the flow, and secretion of substances that promote vasodilatation and anticoagulation3, 18. Both excess and lack of the stimulus can lead to pathological phenomena that cause changes in the arterial wall biomechanical properties. Pathologically high wall shear values can damage the layer of endothelial cells19, 20. Meng et al.2 recently demonstrated, in an animal model where they created an arterial T bifurcation, that a high supra-physiological level of WSS contributes to aneurysm initiation and development. They showed a good agreement between the areas of high WSS and high WSS spatial gradients at the apices of arterial bifurcations and aneurysm-type wall remodeling (disrupted internal elastic lamina and endothelium, thinned media and smooth muscle cells loss) at histology.
Conversely, low WSS has been reported to be related to aneurysmal growth21 and rupture5 as it promotes various mechanisms that cause arterial wall remodeling. Indeed, a low level of WSS (lower than 0.4 Pa) generates endothelial proliferation3 and apoptosis22. It is also responsible for changes in endothelial cell secretion, leading to abnormal hyper-production of vasoconstrictive agents23 and inflammatory, proadhesive, and prothrombotic mediators24, 3. Similarly, it decreases the production of vasodilators25 and antioxidant enzymes26.
To summarize, it appears that, after an initial injury that might result from excessive WSS on the endothelial cells (caused by a localized jet, for example2), progressive changes in aneurysm shape occur with a trend for the cross section to become more elliptical. This generates a progressive decrease of WSS4, 27, 28 leading to endothelial dysfunction, wall remodeling, and aneurysm growth.
In our study we establish the relationship between low levels of the time-averaged WSS that is applied on the endothelium through the cardiac cycle and local aneurysm growth in intracranial aneurysms. The methodology we propose is based on a combination of techniques that has not been reported previously and presents several advantages. First, non-invasive in vivo monitoring of the aneurysm over time allows observation of actual changes in aneurysm shapes without making any assumptions about theoretical evolution that need hypotheses on arterial wall composition or biomechanical properties29, 30. Then, use of a point-by-point study of the displacement permits an accurate display of the morphology of wall displacement allowing both qualitative, visual and quantitative comparisons between local changes in volume and the local wall shear stress. MR imaging of both the lumen and the wall permits identification of aneurysms where there is substantial intralumenal thrombus. Subjects with intralumenal thrombus must be excluded from an analysis of the kind reported here since that condition substantially alters the direct impact of hemodynamics on the vessel wall. Finally, CFD modeling allows an accurate estimation of WSS5 on a patient-specific basis. WSS calculations, based on the velocity gradient at the wall, require a resolution of the velocity field that cannot currently be achieved by in-vivo flow measurement techniques in intra-cranial arteries. Indeed, although there are recent reports that MRI is able to estimate WSS in an in-vitro study at 3T4, the image resolution (0.47 × 0.47 × 2 mm) is insufficient to provide accurate measurements of the gradient of velocities at the wall. Nevertheless, although unsuited for the accurate determination of WSS data, MRI is able to determine the flowrates through the inlet vessels, quantities that are crucial for CFD calculations which are strongly dependent on inlet flow conditions.
In this study we have focused on the time-averaged WSS applied to the endothelium over the cardiac cycle as it represents the average intensity of the stimulus acting on endothelial cells. A number of other hemodynamic parameters can be used as descriptors of how this stimulus is experienced by the endothelium (such as WSS spatial gradient, amplitude or frequency of the oscillation of WSS through the cardiac cycle or changes of WSS direction). Although each of those could be an important mechanism in influencing aneurysm growth, it is difficult to separate out the effects of one from another since they often occur simultaneously. These effects are also difficult to evaluate from an imaging standpoint as their determination requires extremely high resolution data. Further, little is known about how those detailed interactions are felt by the cells. For example, we do not know if a spatial gradient should be computed on a cell-by-cell basis or by grouping a number of neighboring cells (even more if paracrine communication plays an active role). Finally, the manner in which the stimulus is applied is more relevant when the level of WSS is high than when it is low, or close to zero2.
A limitation of our study relates to the way displacement is computed. Radial wall displacement measurement is certainly a good approximation of local aneurysm growth but it does not take into account several parameters such as constraints coming from neighboring structures (for example a bone structure limiting the extension of the aneurysm in one direction) or modification resulting from distant changes in the arterial wall that result in a “sliding” displacement of a different part of the aneurysm. It is possible that our radial model could be improved by fitting the observed change using a mathematical model27, 29.
Another limitation is the potential errors in CFD flow field calculation related to geometric uncertainties31. Partial volume effects in MRI studies or inaccuracy of thresholding of the data when extracting the shape from the MRI images may alter the CFD results. However, we attempted to minimize all those potential sources of errors in the methodology by using high resolution MR angiography, consistent thresholding for the base-line and follow-up studies, and visual control of the fit between the extracted shapes and the original dataset.
SUMMARY
The analysis in this study utilizes a tool that is based on non-invasive 3D MR imaging of the vessel lumen, wall, and inlet flow conditions. From the imaging results, both a sensitive map of regional geometric changes and a computational model of the velocity fields can be derived. The study demonstrates the correlation between regions of low WSS and aneurysm progression in intracranial aneurysms. This could be helpful in predicting where and when aneurysm growth might occur which would be of interest in therapeutic decision-making and in surgical planning.
ACKNOWLEDGMENTS
Loic Boussel acknowledges support from the Société Française de Radiologie, 20, Avenue RAPP, 75007 Paris, France.
This work has been supported in part by grants from PHS grants NS047921, HL067912; and a VA Merit Review Award.
We thank Nancy Quinnine RN for coordinating and managing patient participation.
Footnotes
No conflict of Interest.
REFERENCES
- 1.Krex D, Schackert HK, Schackert G. Genesis of cerebral aneurysms--an update. Acta Neurochir (Wien) 2001;143:429–448. doi: 10.1007/s007010170072. discussion 448-429. [DOI] [PubMed] [Google Scholar]
- 2.Meng H, Wang Z, Hoi Y, Gao L, Metaxa E, Swartz DD, Kolega J. Complex hemodynamics at the apex of an arterial bifurcation induces vascular remodeling resembling cerebral aneurysm initiation. Stroke. 2007;38:1924–1931. doi: 10.1161/STROKEAHA.106.481234. [DOI] [PMC free article] [PubMed] [Google Scholar]
- 3.Malek AM, Alper SL, Izumo S. Hemodynamic shear stress and its role in atherosclerosis. Jama. 1999;282:2035–2042. doi: 10.1001/jama.282.21.2035. [DOI] [PubMed] [Google Scholar]
- 4.Ahn S, Shin D, Tateshima S, Tanishita K, Vinuela F, Sinha S. Fluid-induced wall shear stress in anthropomorphic brain aneurysm models: Mr phase-contrast study at 3 t. J Magn Reson Imaging. 2007;25:1120–1130. doi: 10.1002/jmri.20928. [DOI] [PubMed] [Google Scholar]
- 5.Shojima M, Oshima M, Takagi K, Torii R, Hayakawa M, Katada K, Morita A, Kirino T. Magnitude and role of wall shear stress on cerebral aneurysm: Computational fluid dynamic study of 20 middle cerebral artery aneurysms. Stroke. 2004;35:2500–2505. doi: 10.1161/01.STR.0000144648.89172.0f. [DOI] [PubMed] [Google Scholar]
- 6.Valencia AA, Guzman AM, Finol EA, Amon CH. Blood flow dynamics in saccular aneurysm models of the basilar artery. J Biomech Eng. 2006;128:516–526. doi: 10.1115/1.2205377. [DOI] [PubMed] [Google Scholar]
- 7.Dispensa BP, Saloner DA, Acevedo-Bolton G, Achrol AS, Jou LD, McCulloch CE, Johnston SC, Higashida RT, Dowd CF, Halbach VV, Ko NU, Lawton MT, Martin AJ, Quinnine N, Young WL. Estimation of fusiform intracranial aneurysm growth by serial magnetic resonance imaging. J Magn Reson Imaging. 2007;26:177–183. doi: 10.1002/jmri.20944. [DOI] [PubMed] [Google Scholar]
- 8.Hassan T, Ezura M, Timofeev EV, Tominaga T, Saito T, Takahashi A, Takayama K, Yoshimoto T. Computational simulation of therapeutic parent artery occlusion to treat giant vertebrobasilar aneurysm. AJNR Am J Neuroradiol. 2004;25:63–68. [PMC free article] [PubMed] [Google Scholar]
- 9.Jou LD, Wong G, Dispensa B, Lawton MT, Higashida RT, Young WL, Saloner D. Correlation between lumenal geometry changes and hemodynamics in fusiform intracranial aneurysms. AJNR Am J Neuroradiol. 2005;26:2357–2363. [PMC free article] [PubMed] [Google Scholar]
- 10.Castro MA, Putman CM, Cebral JR. Computational fluid dynamics modeling of intracranial aneurysms: Effects of parent artery segmentation on intra-aneurysmal hemodynamics. AJNR Am J Neuroradiol. 2006;27:1703–1709. [PMC free article] [PubMed] [Google Scholar]
- 11.Berger SA, Jou LD. Flows in stenotic vessels. Annual Review of Fluid Mechanics. 2000;32:347–384. [Google Scholar]
- 12.Rayz V, Boussel L, Acevedo-Bolton G, Martin AJ, Young WL, Lawton MT, Higashida R, Saloner D. Numerical simulations of flow in cerebral aneurysms: Comparison of cfd results and in vivo mri measurements. J Biomech Eng. 2008 doi: 10.1115/1.2970056. In Press. [DOI] [PubMed] [Google Scholar]
- 13.Adamson RH. Microvascular endothelial cell shape and size in situ. Microvasc Res. 1993;46:77–88. doi: 10.1006/mvre.1993.1036. [DOI] [PubMed] [Google Scholar]
- 14.Bland JM, Altman DG. Statistical methods for assessing agreement between two methods of clinical measurement. Lancet. 1986;1:307–310. [PubMed] [Google Scholar]
- 15.Ali MH, Schumacker PT. Endothelial responses to mechanical stress: Where is the mechanosensor? Crit Care Med. 2002;30:S198–206. doi: 10.1097/00003246-200205001-00005. [DOI] [PubMed] [Google Scholar]
- 16.Schwarz G, Callewaert G, Droogmans G, Nilius B. Shear stress-induced calcium transients in endothelial cells from human umbilical cord veins. J Physiol. 1992;458:527–538. doi: 10.1113/jphysiol.1992.sp019432. [DOI] [PMC free article] [PubMed] [Google Scholar]
- 17.Wang N, Butler JP, Ingber DE. Mechanotransduction across the cell surface and through the cytoskeleton. Science. 1993;260:1124–1127. doi: 10.1126/science.7684161. [DOI] [PubMed] [Google Scholar]
- 18.Paszkowiak JJ, Dardik A. Arterial wall shear stress: Observations from the bench to the bedside. Vasc Endovascular Surg. 2003;37:47–57. doi: 10.1177/153857440303700107. [DOI] [PubMed] [Google Scholar]
- 19.DePaola N, Gimbrone MA, Jr., Davies PF, Dewey CF., Jr. Vascular endothelium responds to fluid shear stress gradients. Arterioscler Thromb. 1992;12:1254–1257. doi: 10.1161/01.atv.12.11.1254. [DOI] [PubMed] [Google Scholar]
- 20.Fry DL. Acute vascular endothelial changes associated with increased blood velocity gradients. Circ Res. 1968;22:165–197. doi: 10.1161/01.res.22.2.165. [DOI] [PubMed] [Google Scholar]
- 21.Jou LD, Quick CM, Young WL, Lawton MT, Higashida R, Martin A, Saloner D. Computational approach to quantifying hemodynamic forces in giant cerebral aneurysms. AJNR Am J Neuroradiol. 2003;24:1804–1810. [PMC free article] [PubMed] [Google Scholar]
- 22.Kaiser D, Freyberg MA, Friedl P. Lack of hemodynamic forces triggers apoptosis in vascular endothelial cells. Biochem Biophys Res Commun. 1997;231:586–590. doi: 10.1006/bbrc.1997.6146. [DOI] [PubMed] [Google Scholar]
- 23.Rieder MJ, Carmona R, Krieger JE, Pritchard KA, Jr., Greene AS. Suppression of angiotensin-converting enzyme expression and activity by shear stress. Circ Res. 1997;80:312–319. doi: 10.1161/01.res.80.3.312. [DOI] [PubMed] [Google Scholar]
- 24.Korenaga R, Ando J, Kosaki K, Isshiki M, Takada Y, Kamiya A. Negative transcriptional regulation of the vcam-1 gene by fluid shear stress in murine endothelial cells. Am J Physiol. 1997;273:C1506–1515. doi: 10.1152/ajpcell.1997.273.5.c1506. [DOI] [PubMed] [Google Scholar]
- 25.Rubanyi GM, Romero JC, Vanhoutte PM. Flow-induced release of endothelium-derived relaxing factor. Am J Physiol. 1986;250:H1145–1149. doi: 10.1152/ajpheart.1986.250.6.H1145. [DOI] [PubMed] [Google Scholar]
- 26.Topper JN, Cai J, Falb D, Gimbrone MA., Jr Identification of vascular endothelial genes differentially responsive to fluid mechanical stimuli: Cyclooxygenase-2, manganese superoxide dismutase, and endothelial cell nitric oxide synthase are selectively up-regulated by steady laminar shear stress. Proc Natl Acad Sci U S A. 1996;93:10417–10422. doi: 10.1073/pnas.93.19.10417. [DOI] [PMC free article] [PubMed] [Google Scholar]
- 27.Feng Y, Wada S, Tsubota K, Yamaguchi T. A model-based numerical analysis in the early development of intracranial aneurysms. Conf Proc IEEE Eng Med Biol Soc. 2005;1:607–610. doi: 10.1109/IEMBS.2005.1616486. [DOI] [PubMed] [Google Scholar]
- 28.Utter B, Rossmann JS. Numerical simulation of saccular aneurysm hemodynamics: Influence of morphology on rupture risk. J Biomech. 2007;40:2716–2722. doi: 10.1016/j.jbiomech.2007.01.011. [DOI] [PubMed] [Google Scholar]
- 29.Baek S, Rajagopal KR, Humphrey JD. A theoretical model of enlarging intracranial fusiform aneurysms. J Biomech Eng. 2006;128:142–149. doi: 10.1115/1.2132374. [DOI] [PubMed] [Google Scholar]
- 30.Chatziprodromou I, Poulikakos D, Ventikos Y. On the influence of variation in haemodynamic conditions on the generation and growth of cerebral aneurysms and atherogenesis: A computational model. J Biomech. 2007 doi: 10.1016/j.jbiomech.2007.06.013. [DOI] [PubMed] [Google Scholar]
- 31.Hoi Y, Woodward SH, Kim M, Taulbee DB, Meng H. Validation of cfd simulations of cerebral aneurysms with implication of geometric variations. J Biomech Eng. 2006;128:844–851. doi: 10.1115/1.2354209. [DOI] [PMC free article] [PubMed] [Google Scholar]