Abstract
The interferon (IFN)-related cytokine interleukin (IL)-29 (also known as IFN-λ1) inhibits virus replication by inducing a cellular antiviral response similar to that activated by IFN-α/β. However, because it binds to a unique receptor, this cytokine may function cooperatively with IFN-α/β or IFN-γ during natural infections to inhibit virus replication, and might also be useful therapeutically in combination with other cytokines to treat chronic viral infections such as hepatitis C (HCV). We therefore investigated the ability of IL-29 and IFN-α or IFN-γ to cooperatively inhibit virus replication and induce antiviral gene expression. Compared with the individual cytokines alone, the combination of IL-29 with IFN-α or IFN-γ was more effective at blocking vesicular stomatitis virus and HCV replication, and this cooperative antiviral activity correlated with the magnitude of induced antiviral gene expression. Although the combined effects of IL-29 and IFN-α were primarily additive, the IL-29/IFN-γ combination synergistically induced multiple genes and had the greatest antiviral activity. Two different mechanisms contributed to the enhanced gene expression induced by the cytokine combinations: increased activation of ISRE promoter elements and simultaneous activation of both ISRE and GAS elements within the same promoter. These findings provide new insight into the coregulation of a critical innate immune response by functionally distinct cytokine families.
An estimated 170 million people worldwide are chronically infected with hepatitis C virus (HCV),3 placing them at increased risk for developing liver cirrhosis and hepatocellular carcinoma (1). Progression of chronic HCV infections into late-stage liver disease has become the leading indication for liver transplants in the United States (2). Current therapy for chronic HCV consists of pegylated interferon (IFN)-α and ribavirin (3). However, IFN-α treatment is costly, poorly tolerated due to adverse side effects, and is often ineffective (3). Therefore, new treatments with fewer side effects and better efficacy are needed.
A new family of IFN-related cytokines has recently been described and designated IL-29, IL-28A, and IL-28B (or IFN-λ1, -2, and -3, respectively) (4, 5). These cytokines possess only weak homology to IFN-α, but induce the expression of genes normally activated by IFN-α/β (4). Similar to IFN-α/β, IL-29 expression is induced by Toll-like receptor signaling and viral infections, and is highly produced by dendritic cells (6, 7). Additionally, IL-29 possesses antiviral activity like that of IFN-α/β, and inhibits the replication of viruses such as vesicular stomatitis virus (VSV), encephalomyocarditis virus, herpes simplex virus, HBV, and HCV (4–6, 8–11). Despite its functional similarity to IFN-α/β, IL-29 does not bind the IFN-α/β receptor, but instead signals through a receptor composed of the IL-28R1 and IL-10R2 subunits (4, 5, 12). Unlike the IFN-α receptor, which is expressed on nearly all somatic cells, the IL-29 receptor is widely expressed on nonhematopoietic cells but less so on leukocytes (12). Recent studies in mice also indicate that IL-28A activity varies among different tissues, and is highest in epithelial cells (13, 14).
Both IFN-α/β and IFN-γ have antiviral functions, and they exert this activity by inducing the expression of IFN-stimulated genes (ISGs). Signaling through the IFN-α/β or IFN-γ receptor induces ISG expression via the formation of the transcription factor complexes interferon-stimulated gene factor 3 (ISGF3; STAT-1/STAT-2/IRF9) or γ-activated factor (STAT-1 homodimer), respectively (15). The IFN-activated transcription factors bind to highly conserved promoter elements upstream of ISGs. The IFN-stimulated response element (ISRE) is found in the promoter of genes primarily activated by IFN-α/β, whereas the γ-activated sequence (GAS) is typically found upstream of genes induced by IFN-γ signaling (16, 17). Like the IFN-α receptor, the IL-29 receptor also induces the phosphorylation of STAT proteins that subsequently bind to and activate ISREs (4, 9, 18, 19, 21, 22), leading to changes in cellular gene expression that are very similar to those induced by IFN-α (9, 19).
The fact that IL-29 binds a unique receptor, but this receptor signals through a pathway that is nearly identical to the IFN-α/β receptor, raises some interesting questions. Because IL-29 is coexpressed with IFN-α/β, these cytokines may elicit an antiviral response in combination greater than either one alone. Cooperative antiviral effects of IFN-α and IL-28/IL-29 against HCV (9, 10) and HSV-2 (6) have been reported, but the mechanism of this activity has not been elucidated. Furthermore, IFN-α and IFN-γ synergistically inhibit the replication of a wide range of viruses including HCV (23–29), but this relationship has not been studied for IL-29 and IFN-γ. Therefore, we examined the ability of IL-29 to function cooperatively with IFN-α or IFN-γ to inhibit HCV replication, and characterized the mechanism of this combined activity.
EXPERIMENTAL PROCEDURES
Cell Lines and Reagents—Human Huh7 hepatocellular carcinoma cells expressing a genotype 1b HCV subgenomic replicon (Huh7/Con1/SG-Neo(I)) with the S1179I cell culture adaptive mutation (30) were maintained with 500 μg of G418/ml in Dulbecco's modified Eagle's medium supplemented with antibiotics (penicillin (100 μg/ml) and streptomycin (100 units/ml)), l-glutamine (2 mm), and 10% heat-inactivated fetal bovine serum (Invitrogen). The full-length replicon (SfiI) cells were cultured in the same manner. Human A549 lung carcinoma cells were maintained in supplemented Dulbecco's modified Eagle's medium. Human IL-29 (IFN-λ1) was purchased from Peprotech (Rocky Hill, NJ). Human IFN-α(A/D) and IFN-γ were purchased from PBL Interferon Source (Piscataway, NJ).
VSV Infection Assay—A549 cells were treated with 5 units of IFN-α/ml, 5 units of IFN-γ/ml, 0.25 ng of IL-29/ml, or combinations at their respective concentrations for 18 h. Cells were infected with recombinant VSV-GFP (provided by J. Rose, Yale University) at a multiplicity of infection = 1 for 24 h, after which they were imaged using an Olympus CK40 inverted microscope outfitted with a DP12 digital camera, and then harvested in 2% paraformaldehyde in phosphate-buffered saline for analysis by flow cytometry using a FACS Calibur (BD Biosciences).
HCV Antiviral Assays—Huh7/Con1/SG-Neo(I) or SfiI cells were treated with IFN-α, IFN-γ, IL-29, or combinations at the indicated concentrations for 72 h. Cytokines were replenished 48 h after the initial treatment. In the time course experiment, Huh7/Con1/SG-Neo(I) cells were treated with the cytokines at their indicated concentrations, and harvested at 1, 2, 3, or 5 days post treatment. Cytokines were replenished 2 and 4 days after the initial treatment. HCV RNA levels were measured by quantitative RT-PCR, normalized to GAPDH expression, and expressed as relative to untreated control cultures.
Quantitative Real-time RT-PCR—Total RNA was harvested and prepared using the RNeasy Mini Kit (Qiagen, Valencia, CA) according to the manufacturer's instructions. Reverse transcription and quantitative real-time PCR were performed as previously described (31). Briefly, 1 μg of total RNA was reverse transcribed using the TaqMan reverse transcription kit (Applied Biosystems, Foster City, CA) with random hexamers. Quantitative PCR was performed in duplicate using an Applied Biosystems 7500 real-time PCR system. PCR mixtures contained 100 ng of reverse transcribed RNA, 12.5 μl of SYBR Green reaction mixture (Applied Biosystems), and 200 nm sense and antisense primers in a total volume of 25 μl. The primer sequences used were as follows: IFI27, 5′-CCG TAG TTT TGC CCC TGG-3′ (sense), 5′-CGA GGC CAT TCC CGC CGC-3′ (antisense); IFITM1, 5′-GGT TGG CGA CGT GAC CGG-3′ (sense), 5′-CCG AAT ACC AGT GAC AGG-3′ (antisense); GAPDH, 5′-AAG TAT GAC AAC AGC CTC AAG ATC-3′ (sense), 5′-CTG TGG TCA TGA GTC CTT C-3′ (antisense); HCV, 5′-AAG CCA GCT CGC CTT ATC GTA TT-3′ (sense), 5′-ACC CGC TGT CCA GGA GAG TAT TG-3′ (antisense). After an initial incubation at 95 °C for 5 min, PCR amplification was performed by cycling 50 times for 30 s at 95 °C followed by 1 min at 60 °C. Gene expression was quantified using the 7500 system Sequence Detection Software (Applied Biosystems) after normalization to GAPDH expression. The ΔΔCt method was used for analysis of all quantitative RT-PCRs. In a previous report (8), we found similar inhibition of HCV RNA by IL-29 measured by quantitative RT-PCR and Northern blot analyses. Therefore, quantitative RT-PCR was used exclusively in these studies.
Cytotoxicity and Proliferation Assay—Huh7/Con1/SG-Neo(I) cells were seeded in a 96-well plate (1 × 10⁴ cells/well) in triplicate 1 day prior to treatment. Cells were treated for 72 h with 100 units of IFN-α/ml, 100 units of IFN-γ/ml, 10 ng of IL-29/ml, or combinations at these concentrations in 200 μl of media. Following treatment, 100 μl of media was removed from each well and 25 μl of MTT (5 mg/ml in phosphate-buffered saline, Sigma) was added. Cells were incubated for 2 h at 37 °C before adding 50 μl of 20% SDS in 50% N,N-dimethylformamide (pH 4.7) to solubilize the crystals. After incubating at 37 °C overnight, the absorbance at 570 nm was measured. Alternatively, cells were resuspended, diluted in Trypan blue solution (0.4%, Sigma), and counted using a hemacytometer.
Gene Expression Analysis—Huh7/Con1/SG-Neo(I) cells were treated with 100 units of IFN-α/ml, 100 units of IFN-γ/ml, 10 ng of IL-29/ml, or combinations at their respective concentrations for 24 h. These concentrations were chosen because they induced greater inhibition of HCV replication in combination (Fig. 2C), are similar in terms of antiviral activity per ng (5, 32), and induced similar expression levels of representative genes (MXA, ISG15) when used alone (data not shown). Total cellular RNA from three experiments was collected using the RNeasy Mini Kit (Qiagen), and RNA concentration and quality were determined by absorbance spectrophotometry and electrophoresis. Prior to the microarray analysis, control RT-PCR was performed on the individual samples to confirm similar induced expression of the representative ISGs MXA and ISG15. The RNA from three separate experiments was pooled, and cRNA was prepared according to the Affymetrix GeneChip (Affymetrix, Santa Clara, CA) protocol at the Keck Affymetrix Resource facility at Yale University. Double-stranded cDNA was synthesized from 5 μg of total RNA using the Superscript Choice System (Invitrogen) with an oligo(dT)24 T7 primer (Genset, La Jolla, CA). Biotin-labeled cRNA was prepared by in vitro transcription from cDNA using GeneChip IVT labeling, then purified with the GeneChip Cleanup Module before fragmentation. Fragmented cRNA was then hybridized to the Human Genome U133 Plus 2.0 Array, and processing was performed following standard protocols (Affymetrix).
FIGURE 2.
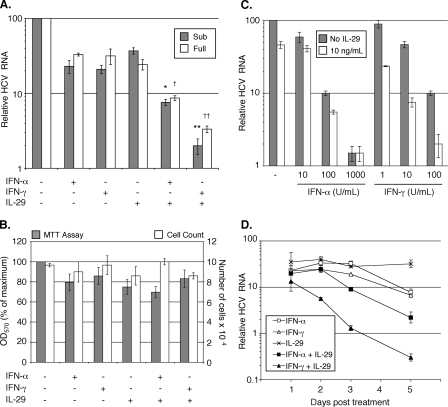
Cytokine combinations inhibit HCV RNA replication but do not affect cell viability. A, Huh7/Con1/SG-Neo(I) cells (Sub) were treated with 100 units of IFN-α/ml, 10 units of IFN-γ/ml, 100 ng of IL-29/ml, or combinations as indicated. SfiI full-length replicon cells (Full) were treated with 10 units of IFN-α/ml, 3 units of IFN-γ/ml, 1 ng of IL-29/ml, or combinations as indicated. p values for greater than additive effects are as follows: (*) p = 0.38, (**) p = 0.016, (†) p = 0.33, (††) p = 0.046. B, Huh7/Con1/SG-Neo(I) cells were treated with 100 units of IFN-α/ml, 10 units of IFN-γ/ml, 100 ng of IL-29/ml, or combinations as indicated. Cell viability was determined by MTT assay and counting in trypan blue. C, Huh7/Con1/SG-Neo(I) cells were treated with the indicated concentrations of IFN-α or IFN-γ in the presence or absence of 10 ng of IL-29/ml. D, time course of HCV inhibition. Huh7/Con1/SG-Neo(I) cells were treated with 100 units of IFN-α/ml, 10 units of IFN-γ/ml, 100 ng of IL-29/ml, or combinations as indicated. For all experiments, data are presented as the mean of triplicate experiments, and error bars represent S.E.
Raw Affymetrix microarray data were normalized using Robust Multichip Averaging (33). Differential expression was determined for each comparison of interest using two criteria. First, an initial filtering removed any genes with an absolute -fold change less than two. Next, statistical significance was calculated using the S-Score probe-level algorithm (34, 35). A change in expression at least three standard deviations from the mean, corresponding to a p value of 0.003, was required. All of the analysis methods used implementations from the BioConductor software package (36).
STAT Phosphorylation Analysis—Huh7/Con1/SG-Neo(I) cells were treated with cytokines for 30 min in two separate groups. The first group was treated with 100 units of IFN-α/ml, 100 units of IFN-γ/ml, 10 ng of IL-29/ml, or combinations at these concentrations. The second group was treated with 100 units of IFN-α/ml, 10 units of IFN-γ/ml, 100 ng of IL-29/ml or combinations at these concentrations. Equal numbers of cells were washed with phosphate-buffered saline and lysed with 2× SDS sample buffer (125 mm Tris/HCl, 4% SDS, 20% glycerol, 0.02% bromphenol blue). Extracts were separated on an SDS-polyacrylamide gel, transferred to a nylon membrane (Bio-Rad), and probed with antibodies specific for p-STAT-1 (Tyr-701), STAT-1, p-STAT-2 (Tyr-690), STAT-2, p-STAT-3 (Tyr-705), and STAT-3 (Cell Signaling). Proteins were visualized using LumiGLO chemiluminescent reagents (Cell Signaling) and a Fuji LAS-3000 cooled CCD camera.
Promoter Activity/Luciferase Assay—The pISRE-Luc plasmid containing five copies of an ISRE element (TAGTTTCACTTTCCC) and the pGAS-Luc plasmid containing four copies of a GAS element (AGTTTCATATTACTCTAAATC) were purchased from Stratagene (La Jolla, CA). One day prior to transfection, cells were plated in complete Dulbecco's modified Eagle's medium without antibiotics. Huh7/Con1/SG-Neo(I) cells were transfected with 2 μg of control plasmid containing no enhancer element, pISRE-luc, or pGAS-luc plasmid with 6 μl of Lipofectin (Invitrogen). One day post-transfection, cells were treated with 100 units of IFN-α/ml, 100 units of IFN-γ/ml, 10 ng of IL-29/ml, or combinations at their respective concentrations for 24 h. Cells were lysed in 1× lysis buffer (Stratagene) and luciferase assays were performed using the Steady-Glo Luciferase Assay system (Promega, Madison, WI). Luciferase activity was quantified using a Victor3V Luminometer (PerkinElmer Life Sciences).
IFI27 Promoter Cloning and Mutagenesis—A 500-bp region immediately upstream of the IFI27 transcription start site was amplified by PCR and incorporated XhoI and HindIII restriction sites (5′-CTC GAG TCT GCC TAG GTC ACT GCT TC-3′ and 5′-AAG CTT GAC ACA GGC AAC AAA TGA GAT AG-3′). This region was then cloned into the pGL3 vector (Promega) for use in luciferase assays as described above. For the IFI27 mutant promoter, point mutations were introduced using the QuikChange II Site-directed Mutagenesis Kit (Stratagene). Primers were designed according to the manufacturer's recommendations (5′-GAT GTC TGC AGT TTC GGT TTC GTC CAA AAT GAA ACC TAT CTC ATT-3′ (sense); 5′-AAT GAG ATA GGT TTC ATT TTC GAC GAA ACC GAA ACT GCA GAC ATC-3′ (antisense)). For the IFI27 promoter luciferase assays, Huh7/Con1/SG-Neo(I) cells were transfected as described above, then treated with 10 units of IFN-α/ml, 100 units of IFN-γ/ml, 10 ng of IL-29/ml, or combinations for 8 h. Luciferase activity was measured as described above.
Analysis of ISRE and GAS Elements—Upstream 1-kb promoter regions for all RefSeq genes in the human genome (Build 36) were downloaded from the UCSC Genome Browser (37). Elements matching the ISRE ((G/A)(G/A)AANNGAAA(C/G)) and GAS (TT(C/A)CNNNAA(A/G)) consensus sequences were identified in each gene and their locations noted. p values for the over-representation of ISRE and/or GAS elements among the additive/synergistic genes were computed using hypergeometric distribution with the set of all differentially expressed genes under any interferon treatment as the background (38).
RESULTS
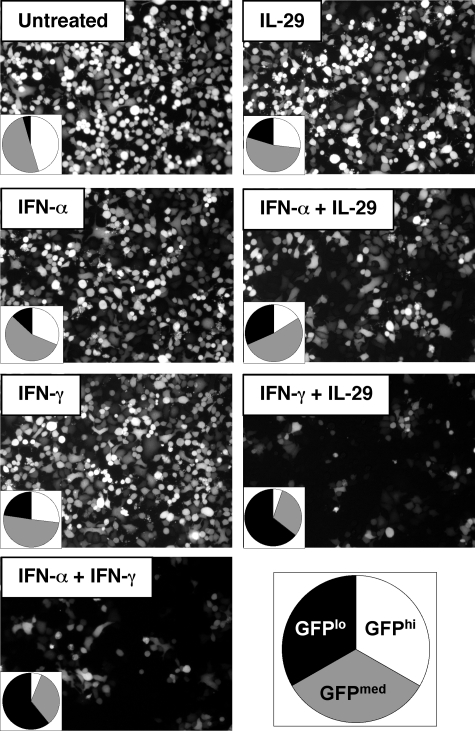
Cooperative Antiviral Activity of IL-29 with IFN-α or IFN-γ—We first determined if combining IL-29 with IFN-α or IFN-γ induces greater antiviral activity compared with the individual cytokines alone. We initially chose to use VSV for these experiments because of its well characterized sensitivity to IFN (32). A549 cells were pre-treated with low concentrations of IFN-α, IFN-γ, IL-29, or combinations for 18 h prior to infection with a GFP-expressing VSV (multiplicity of infection = 1) (39). By flow cytometric analysis 24 h post infection, we observed three populations of cells (arbitrarily defined as GFP high, medium, and low/no), indicative of their relative level of VSV gene expression (Fig. 1). We have previously found that GFP expression in VSV-infected cells correlates with virus titer in the cell culture supernatant (data not shown). Although cells treated with only one cytokine displayed some protection (i.e. lower GFP expression) against VSV at these concentrations, increased protection was found in cells treated with multiple cytokines. Although the combination of IL-29 and IFN-α induced a modest decrease in the level of GFP expression, the combination of IL-29 and IFN-γ was much more effective at inhibiting VSV, and was similar to the inhibition found with a combination of IFN-α and IFN-γ. Therefore, the combined antiviral activity of IL-29 and IFN-γ against VSV is more effective than the combination of IL-29 and IFN-α.
FIGURE 1.
Inhibition of VSV replication by cytokine combinations. A549 cells were treated with 5 units of IFN-α/ml, 5 units of IFN-γ/ml, 0.25 ng of IL-29/ml, or combinations as indicated for 18 h prior to infection with VSV-GFP (multiplicity of infection = 1). Cells were imaged microscopically then fixed for quantitative analysis by flow cytometry. Three populations of cells were evident, defined as high (>524 relative fluorescence intensity), medium (18 < relative fluorescence intensity < 524), and low/no (relative fluorescence intensity < 18). The proportion of cells with high, medium, and low/no GFP expression are displayed in pie charts. Images and quantitative data are representative of three independent experiments.
We next determined the extent to which the cytokine combinations inhibit HCV. We chose to use the replicon model of HCV replication to monitor the effects of the cytokine combinations in the context of ongoing viral RNA replication. Human Huh7 hepatoma cells expressing either a subgenomic (30) or full-length genomic (40) cell culture-adapted HCV RNA replicon were treated with the individual cytokines or combinations as indicated (Fig. 2A), and HCV RNA replication was measured 72 h later by quantitative RT-PCR analysis. These cytokine concentrations were chosen based on the fact that they elicit similar partial antiviral effects (∼3-fold HCV RNA reduction 3 days post treatment) when used alone (Fig. 2A). In contrast to the individual cytokines, viral RNA levels in the subgenomic replicon cells were reduced 92 and 98% by the IL-29/IFN-α and IL-29/IFN-γ combinations, respectively, and these decreases were significantly greater than the inhibition induced by each cytokine alone (Fig. 2A). A similar pattern was observed with cells expressing the full-length genomic replicon, as the combinations of IL-29/IFN-α and IL-29/IFN-γ reduced viral RNA levels by 91 and 97%, respectively.
The enhanced inhibition elicited by the IL-29/IFN-α combination was not significantly different from a theoretical additive effect of the two cytokines (Z = X + Y (1 - X), where X and Y are the individual reductions, p value for synergy = 0.38 (subgenomic) or 0.33 (full-length)) (41). However, the decrease in HCV RNA evoked by the IL-29/IFN-γ combination was greater than that expected by an additive effect of the cytokines (p value for synergy = 0.016 (subgenomic) or 0.046 (full-length)). Therefore, IL-29 in combination with IFN-α or IFN-γ reduces HCV RNA replication more than the individual cytokines alone, and the combined activities of IL-29 and IFN-α on HCV appear to be primarily additive, whereas IL-29 and IFN-γ act synergistically.
We next confirmed that this cooperative antiviral activity is not due to an increase in cytopathic effects caused by the combined cytokine treatments. We conducted both MTT and cell count assays to measure cell viability and proliferation. As shown in Fig. 2B, although there is a slight decrease (<20%) in MTT activity following cytokine treatment, this decrease is not enhanced by the cytokine combinations, and the number of viable cells remains virtually unchanged. These results demonstrate that the greater inhibition of HCV replication is due to increased antiviral activity rather than decreased cell viability or proliferation.
Because cooperative antiviral activities can vary depending on cytokine concentration (28), we also performed a dose-response experiment using a fixed concentration of IL-29 (10 ng/ml), and varying concentrations of IFN-α or IFN-γ (10-fold higher to 10-fold lower than the concentrations used in Fig. 2A). At a very high concentration of IFN-α (1000 units/ml), the cooperative activity with IL-29 was lost, presumably due to maximum activation of the antiviral response by IFN-α alone (Fig. 2C). Importantly, however, when equivalent unit concentrations of IFN-α or IFN-γ are compared (10 or 100 units/ml; as opposed to normalization to antiviral activity against HCV as shown in Fig. 2A), the combination of IL-29 and IFN-γ was again more effective at inhibiting HCV replication compared with the IL-29 + IFN-α-treated cells.
Additionally, we examined the combined activity of the cytokines over a time course ranging from 1 to 5 days. As early as 2 days post-treatment, significant differences in HCV RNA levels were found, and these became more pronounced at later time points (Fig. 2D). Thus, as we found 72 h post treatment, the combination of IL-29 and IFN-γ produced the greatest inhibition of virus replication at multiple time points.
Microarray Analysis of Gene Expression—Based on the results of the virus inhibition studies, we hypothesized that the cytokine combinations would induce different changes in IFN-stimulated gene expression compared with the individual cytokines alone. However, it was possible that this was occurring through a greater number of genes being induced, a different subset of genes being induced, or an increase in the expression of induced genes. We therefore performed a gene expression analysis using Huh7/Con1/SG-Neo(I) cells treated for 24 h with the individual cytokines (IFN-α, IFN-γ, and IL-29) or the respective combinations (IFN-α/IL-29 and IFN-γ/IL-29). We chose 24 h post-stimulation for this analysis for two reasons. First, Marcello et al. (9) demonstrated that the greatest numbers of IL-29-induced genes are found 24 h post treatment in Huh7 cells. Second, this group also found differences in signaling kinetics by the IFN-α and IL-29 receptors during the first 3 h after cytokine stimulation. Therefore, we chose the time point where the greatest numbers of IL-29 genes are induced, and where the gene expression results would not be influenced by differences in early signaling kinetics.
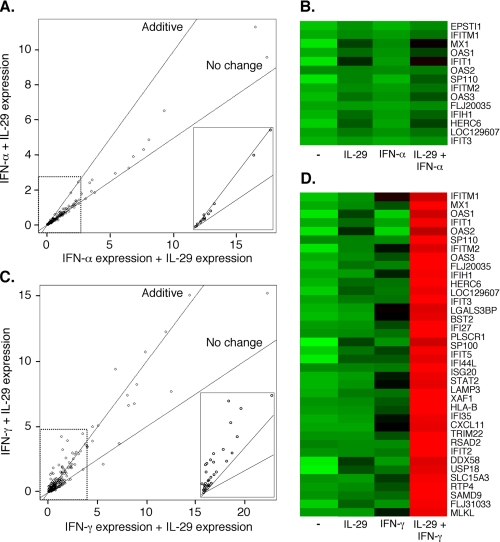
We first determined the number of genes with induced expression compared with control untreated cells. The expression of 78, 85, and 92 genes was increased more than 2-fold (p < 0.003) in cells treated with IFN-α, IL-29, or the combination of the two, respectively. Treatment with IFN-γ either alone or in combination with IL-29 up-regulated 173 and 189 genes, respectively. Although subsets of these genes (19 for the IFN-α/IL-29 combination, 42 for IFN-γ/IL-29) were induced only after treatment with the cytokine combinations, the magnitude of expression of these genes was generally very low (data not shown). Therefore, the cytokine combinations induced the expression of both more genes and different genes compared with the individual cytokines, but these effects were relatively modest.
We next compared the number of genes whose magnitude of expression was significantly changed more than 2-fold above or below the level induced after treatment with the individual cytokines alone. Compared with IFN-α alone, treatment of cells with the IL-29/IFN-α combination increased the expression of 14 genes, and no genes displayed decreased expression. Compared with IFN-γ alone, cells treated with the combination of IL-29 and IFN-γ also showed increased expression of a much larger number of genes (42 genes) than were decreased (2 genes). Therefore, treatment with the cytokine combinations led to overall higher expression levels of specific IFN-α- or IFN-γ-stimulated genes.
We then further characterized this pattern of enhanced gene expression in greater detail. Among all of the genes that showed differential expression after any cytokine treatment (Fig. 3A), the 14 genes that were enhanced by the IFN-α + IL-29 combination displayed increased expression that was not greater than an additive (IFN-α + IL-29 = (IFN-α + IL-29)) effect of the two cytokines (Fig. 3A, inset). In contrast, again among the genes that showed differential expression after any cytokine treatment (Fig. 3C), the combination of IFN-γ + IL-29 induced the expression of 37 genes to an extent greater than that expected by an additive effect of these cytokines (Fig. 3C, inset). The identity and expression patterns of these 14 and 37 genes are also shown graphically in heat-map form in Fig. 3, B and D.
FIGURE 3.
Additive or synergistic gene expression after combined or individual cytokine stimulation. All genes displaying differential expression under one or more treatment conditions (291 in total) are represented as points relative to the sum of the individual (x axis) or combined (y axis) cytokine treatments. Lines represent no change in expression (slope = 0.5) or additive expression (slope = 1) following the combined treatment relative to the individual treatments. Points above the additive line indicate synergy. A, gene expression after treatment with IFN-α, IL-29, or the combination. Inset displays 14 induced genes that are differentially expressed after treatment with IFN-α and IL-29 compared with either IFN-α or untreated controls. Data are displayed as expression × 10-3. B, heat map of genes shown in A, inset. Untreated control cells are indicated in the lane marked “-.” Colors range from green (low relative expression) through black to red (high relative expression), equally spaced across all treatment conditions. This image was generated using the Heatplus package in BioConductor. C, gene expression after treatment with IFN-γ, IL-29, or the combination. Inset displays 37 synergistically expressed genes. These genes are defined as exhibiting differential expression under three conditions: 1) after treatment with IFN-γ and IL-29 compared with IFN-γ; 2) after treatment with IFN-γ and IL-29 compared with IL-29; and 3) after treatment with IFN-γ and IL-29 compared with untreated controls. Data are displayed as expression × 10-3. D, heat map of genes shown in C, inset.
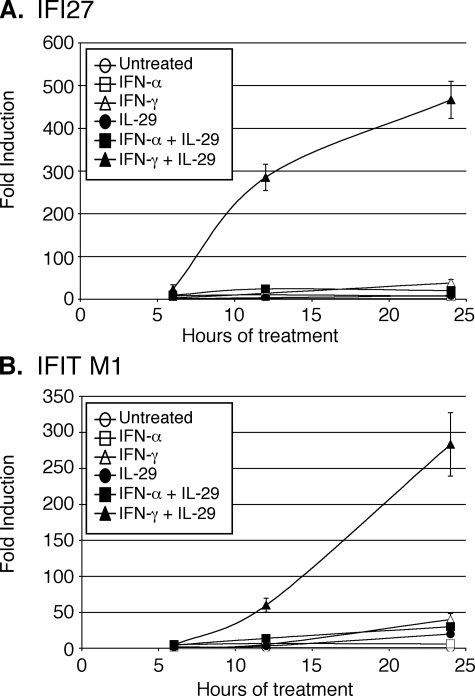
Because gene expression can vary over time after cytokine stimulation, the expression patterns of two representative synergistically induced genes (IFI27 and IFITM1) were also further confirmed by quantitative RT-PCR over a time course of 6, 12, and 24 h (Fig. 4). As was observed in the microarray analysis, these genes were moderately induced by the individual cytokine treatments or combination of IFN-α and IL-29. However, their expression was much greater after treatment with the combination of IL-29 and IFN-γ, thus confirming their synergistic activation.
FIGURE 4.
Time course of synergistic ISG expression by quantitative RT-PCR. Huh7/Con1/SG-Neo(I) cells were treated for 6, 12, or 24 h with 100 units of IFN-α/ml, 100 units of IFN-γ/ml, 10 ng of IL-29/ml, or combinations of cytokines as indicated. Expression of IFI27 (A) or IFITM1 (B) was normalized to GAPDH and displayed as -fold induction relative to untreated controls. Data are averages of three experiments and error bars represent S.E.
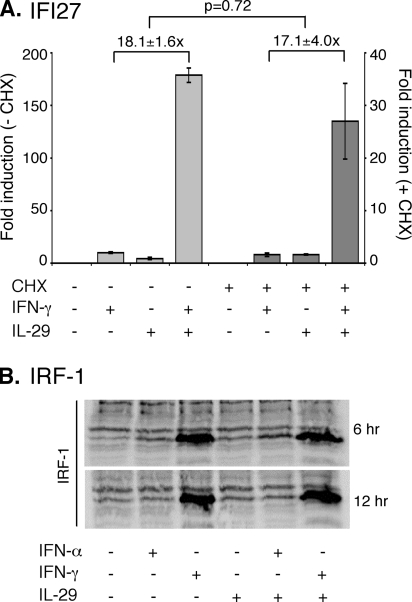
Synergistic Gene Expression Does Not Require ISG Expression—To determine whether the observed combined effects of IL-29 and IFN-γ were due to initial signal transduction events or to secondarily expressed activating factors, cytokine-induced expression of a representative gene (IFI27) was compared in cells treated with cycloheximide to untreated controls (Fig. 5A). Although the overall level of expression of IFI27 mRNA was lower in the cycloheximide-treated cells under all conditions, the relative -fold increase induced by the combined cytokines was not significantly different in the presence or absence of cycloheximide. Therefore, the enhanced gene expression activated by IFN-γ and IL-29 does not require de novo expression of IFN-stimulated genes.
FIGURE 5.
Enhanced activation of gene expression is independent of secondary transcriptional mediators. A, Huh7/Con1/SG-Neo(I) cells were treated with 100 units of IFN-γ/ml, 10 ng of IL-29/ml, or the combination for 12 h in the presence or absence of 100 μg of cycloheximide (CHX)/ml. IFI27 mRNA expression was measured by quantitative RT-PCR, normalized to GAPDH, and displayed as -fold induction relative to untreated controls. Data are mean of three experiments and error bars represent S.E. B, IRF-1 expression in Huh7/Con1/SG-Neo(I) cells was measured by Western blot following treatment with 100 units of IFN-α/ml, 100 units of IFN-γ/ml, 10 ng of IL-29/ml, or combinations for 6 or 12 h as indicated.
We also measured changes in interferon-regulatory factor-1 (IRF-1) expression following cytokine treatment. IRF-1 is a transcription factor induced by IFN-γ that can also induce expression of certain ISGs (42, 43). Therefore, we measured IRF-1 protein levels after 6 or 12 h of treatment with the cytokines, either individually or in combination (Fig. 5B). We observed no increase in IRF-1 expression with the combined cytokine treatments compared with IFN-γ alone, indicating that the enhanced gene expression is not due to increased IRF-1 expression.
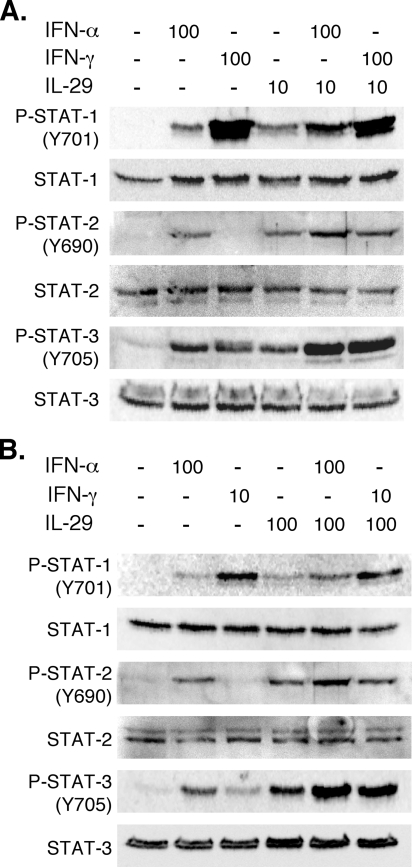
Increased STAT Phosphorylation by Cytokine Combinations—To understand in greater depth the molecular mechanisms underlying the enhanced gene expression, we next measured STAT-1, STAT-2, and STAT-3 tyrosine phosphorylation following treatment with IFN-α, IFN-γ, IL-29, or combinations. The combination of IFN-α and IL-29 resulted in increased STAT-1 and STAT-2 phosphorylation compared with the single cytokines alone at two different IL-29 concentrations (Fig. 6, A and B). In contrast, the IL-29/IFN-γ combination did not enhance STAT-1 or STAT-2 phosphorylation compared with IFN-γ alone at two different concentrations of IL-29 and IFN-γ. Like STAT-1 and -2, tyrosine phosphorylation of STAT-3 was also increased in cells treated with IL-29 in combination with IFN-α compared with the individual cytokines alone. In contrast to STAT-1 and -2, however, the IL-29/IFN-γ combination also enhanced STAT-3 phosphorylation. Therefore, the enhanced gene expression may in part be explained by increased STAT activation, particularly for the IL-29/IFN-α combination.
FIGURE 6.
Increased STAT activation with cytokine combinations. Huh7/Con1/SG-Neo(I) cells were treated with (A) 100 units of IFN-α/ml, 100 units of IFN-γ/ml, 10 ng of IL-29/ml, or combinations as indicated or (B) 100 units of IFN-α/ml, 10 units of IFN-γ/ml, 100 ng of IL-29/ml, or combinations as indicated for 30 min. Phosphorylated and total STAT-1, STAT-2, and STAT-3 were measured by Western blot. Similar increases in phosphorylation were also found at 15 and 180 min after stimulation (data not shown).
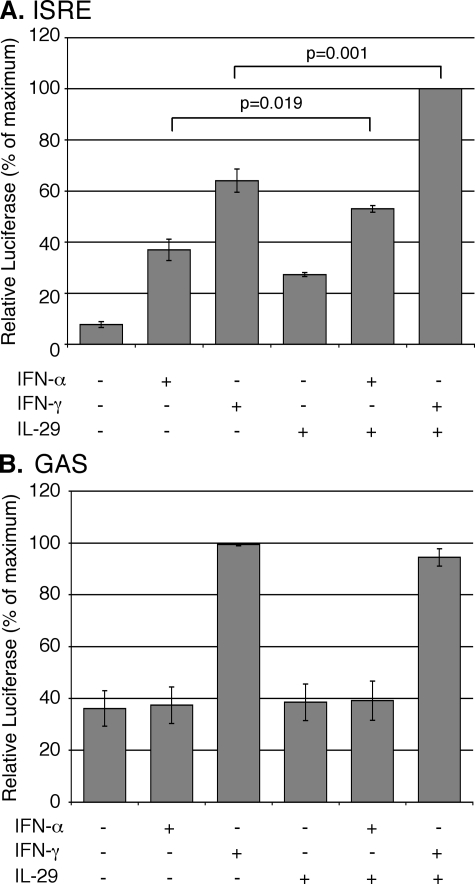
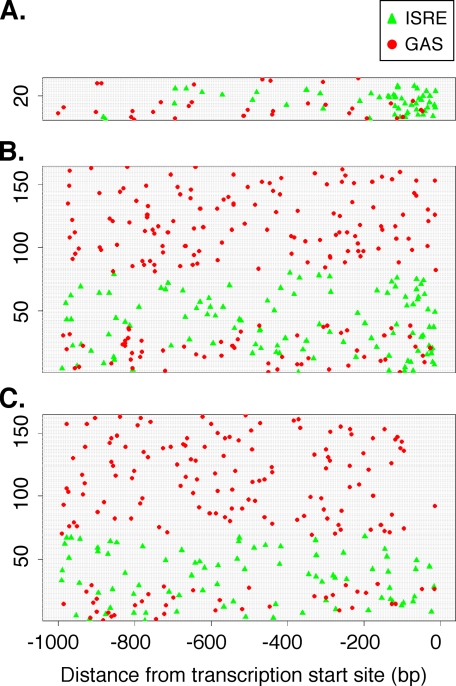
Enhanced Activation of ISRE Sequences by Cytokine Combinations—We next asked whether the cytokine combinations function together to activate ISRE or GAS promoter elements. IFN-α or IL-29 alone induced luciferase expression from a synthetic 5xISRE-driven promoter, and the combination of the two cytokines induced significantly (p = 0.019) more activity (Fig. 7A). IFN-γ also activated the ISRE element in these cells (Fig. 7A), as well as in HepG2 human hepatoma cells and murine immortalized hepatocytes (data not shown), and this activation was also enhanced by IL-29 (Fig. 7A). In fact, the highest promoter activity was observed following treatment with the combination of IFN-γ and IL-29 (p = 0.001). In contrast, IFN-γ was the only cytokine that induced expression from a 4xGAS-driven promoter, and the combinations of IL-29 and IFN-γ did not further enhance GAS-dependent gene expression (Fig. 7B). These results demonstrate that IFN-α, IFN-γ, and IL-29 all induce ISRE-dependent gene expression in a hepatocyte-derived cell line, and that the cytokine combinations enhance ISRE-, but not GAS-, dependent gene expression. Consistent with this finding, when compared with either all differentially expressed genes or a random set of genes containing ISRE and/or GAS elements within 1 kb of their transcriptional start site, the genes that showed enhanced expression following stimulation with the cytokine combinations were more likely to have multiple ISRE elements located in close proximity to their transcription initiation site (Fig. 8 and Table 1). Therefore, increased activation of ISRE elements contributes to enhanced gene expression.
FIGURE 7.
Cytokine combinations increase activation of the ISRE promoter element. Huh7/Con1/SG-Neo(I) cells transfected with luciferase (luc) reporter plasmids (A) p(5x)ISRE-luc or (B) p(4x)GAS-luc were treated with 100 units of IFN-α/ml, 100 units of IFN-γ/ml, 10 ng of IL-29/ml, or combinations as indicated for 24 h. Data are presented as the mean of triplicate experiments and are expressed as percent of maximum relative luciferase activity. Error bars represent S.E., and p values for Student's t test are indicated.
FIGURE 8.
ISRE and GAS elements in induced genes. The location of ISRE (green triangles) and GAS (red circles) motifs among genes that contain these elements. Each gene is displayed horizontally. A, the 34 additive/synergistic genes (insets of Fig. 3, A and C) that contain ISRE and/or GAS elements. B, the 164 other genes found to be differentially expressed under any treatment that contain ISRE and/or GAS elements. C, a selection of 164 random RefSeq genes that contain ISRE and/or GAS elements. Genes are sorted within each plot such that those containing only GAS elements appear on top, followed by those with only ISRE elements, and finally those with both. The transcription start site is located at 0.
TABLE 1.
Frequency of ISRE and GAS sequences in induced genes
| Element | Synergistic | All | p Value |
|---|---|---|---|
| ISRE | 27 (73%) | 108 (37%) | 0.0000023 |
| >1 ISRE | 15 (40%) | 39 (13%) | 0.0000071 |
| GAS | 22 (59%) | 144 (49%) | 0.13 |
| >1 GAS | 10 (27%) | 59 (20%) | 0.18 |
| ISRE + GAS | 16 (43%) | 54 (19%) | 0.00016 |
| Total | 37 | 291 |
Simultaneous Activation of ISRE and GAS Elements—Although increased activation of ISRE sequences likely contributes to enhanced gene expression, the magnitude of this effect did not appear to fully explain the synergistic expression induced by the IL-29/IFN-γ combination. Furthermore, the failure of IL-29 to increase GAS-dependent gene expression (Fig. 7) ruled out increased GAS activity as a mechanism as well. However, the genes that showed synergistic expression were also more likely to have both ISRE and GAS elements in their promoters when compared with all differentially expressed genes (Table 1). This suggested that the simultaneous activation of both ISRE and GAS elements in the promoters of certain genes might also contribute to the enhanced gene expression.
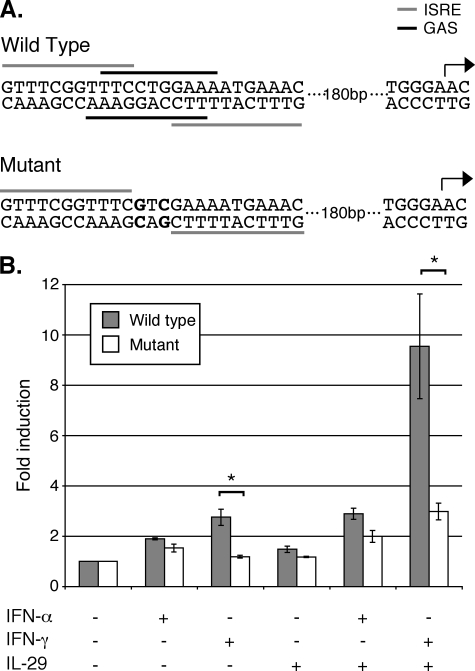
To further test this hypothesis experimentally, we cloned a 500-base pair region immediately upstream of the IFI27 start site into a luciferase expression vector. This region contains a cluster of overlapping ISRE and GAS elements that likely account for the activation of IFI27 gene expression after IFN stimulation (Fig. 9A). As with the synthetic promoters, the IFI27 promoter was activated by the individual cytokines alone, and increased activity was observed with IL-29/IFN-α and IL-29/IFN-γ combinations (Fig. 9B, solid bars). Consistent with IFI27 gene expression from the endogenous promoter (Fig. 4A), the largest increase in promoter activity was found following IL-29 + IFN-γ stimulation.
FIGURE 9.
GAS elements are necessary for synergistic IFI27 promoter activation. A, schematic of ISRE/GAS promoter elements upstream of the IFI27 start site (arrow). Bars indicate elements on positive (upper) or negative (lower) strands. Point mutations were designed so that the mutant promoter lacks functional GAS elements but maintains the ISRE sites. B, Huh7/Con1/SG-Neo(I) cells transfected with pGL3 plasmids containing the wild-type or mutant promoter elements were treated with 10 units of IFN-α/ml, 100 units of IFN-γ/ml, 10 ng of IL-29/ml, or combinations as indicated for 8 h. Data are presented as the mean of triplicate experiments and are expressed as -fold induction relative to untreated controls. Error bars represent S.E. *, p < 0.05 for Student's t test.
We then produced a mutated promoter in which the GAS elements were no longer functional, but the ISRE elements remained intact (Fig. 9A). As shown in Fig. 9B, this mutation had no significant effect on promoter activity when cells were treated with IFN-α, IL-29, or the IL-29/IFN-α combination. As expected, the mutant promoter exhibited less activity in cells treated with IFN-γ alone. Furthermore, the combination of IL-29 and IFN-γ also displayed significantly lower activity with the mutant promoter. In the absence of the GAS element, expression after IL-29/IFN-γ stimulation was comparable with levels observed in cells treated with IL-29 + IFN-α. These data demonstrate that the highly induced expression of a synergistically expressed gene requires the presence of a GAS element in its promoter.
DISCUSSION
Both IFN-α/β and IFN-γ display antiviral activity, and IFN-α is used to treat chronic viral infections in the liver (HBV, HCV). The recently characterized IFN-related protein IL-29 inhibits virus replication, but relatively little is known concerning the mechanism of how its activity combines with other cytokines. Despite being induced by the same stimuli as IFN-α, and activating a similar antiviral response, IL-29 has only weak homology to IFN-α and utilizes a receptor that is distinct from both the IFN-α and IFN-γ receptors (4, 5, 12). We hypothesized that this unique receptor usage may allow for enhanced antiviral activity when cells are exposed to IL-29 in combination with IFN-α or IFN-γ.
Previous studies on the combined antiviral activity of IFN-α and IFN-γ demonstrated synergistic inhibition of replication for a number of viruses, including herpes simplex virus-1 (23, 24), mouse hepatitis virus type 2 (25), human T-lymphotropic virus-1 (26), cytomegalovirus (27), and HCV (28, 29). A number of these reports also assessed the effects of type I IFN combinations (e.g. IFN-α and IFN-β) versus IFN-α and IFN-γ combination (26, 28, 29). In these studies, the type I combinations generally had a slight additive or antagonistic effect, whereas the IFN-α/IFN-γ combination often had a much greater or synergistic activity against the viruses.
Our studies using HCV RNA replicons revealed an additive antiviral effect with the combination of IL-29 with IFN-α against HCV. Cooperative antiviral activities of IFN-α and IL-28/IL-29 against HCV (9, 10) and HSV-2 (6) have also been reported by other groups. Recently, the combination of IL-29 and IFN-γ was found to additively inhibit Hantavirus infection (44). In contrast to this report, we found that IL-29 and IFN-γ resulted in a synergistic reduction in VSV and HCV replication. Therefore, despite using a unique receptor, IL-29 functions similarly to the type I IFNs in that it can additively increase the antiviral activity of IFN-α/β, and synergize with IFN-γ to inhibit virus replication.
We then determined if simultaneous stimulation with IL-29 and IFN-α or IFN-γ leads to an overall positive or negative net effect on cellular antiviral gene expression. A report from Zhu et al. (10) demonstrated that combined treatment of cells with IFN-α and IL-28A increased STAT-1 phosphorylation, suggesting that this would lead to increased gene expression. However, Brand et al. (11) demonstrated that the antiviral activities of IL-28 and IL-29 are inhibited by suppressor of cytokine signaling (SOCS) proteins. Induction of SOCS expression is Jak/STAT dependent and acts as a negative feedback mechanism to regulate the Jak/STAT pathway (45). It was therefore possible that IL-29-induced SOCS activation might reduce IFN-mediated gene expression when these cytokines stimulate the same cell. We found an overall positive effect on gene expression, both in the number of genes expressed and in their level of expression. This suggests that combinations of IL-29 with IFN-α or IFN-γ elevate antiviral gene expression without inducing sufficient additional negative regulatory factors to inhibit signaling.
We further analyzed the expression data to determine whether combinations of IL-29 and IFN-α or IFN-γ increased gene expression additively or synergistically. By comparing gene expression with individual cytokines versus combination treatment, we found the combined effect of IL-29 and IFN-α to be limited to additive gene expression, whereas IL-29 and IFN-γ synergistically induced gene expression. The finding of additive gene expression following treatment with IL-29 and IFN-α and synergistic gene expression after treatment with IL-29 and IFN-γ mirrors the effects we observed on virus replication. This raises the possibility that one or more of these genes plays a direct role in inhibiting HCV replication. Interestingly, a number of genes found to be synergistically induced have been implicated in the IFN-mediated antiviral response to HCV, including USP18, IFI27, and ISG20 (46–48). Studies using RNA interference would be necessary to determine whether any of these proteins are necessary for the synergistic antiviral activity that we observe with IL-29 and IFN-γ. However, these experiments are complicated by the fact that more than one protein may be sufficient to inhibit virus replication.
To determine the mechanism of the combined activities, we examined the activation of ISRE- and GAS-dependent gene expression. The ISRE is activated by the binding of the IFN-α-activated transcription factor complex ISGF3 (15, 16), whereas IFN-γ receptor signaling leads to the formation of a STAT-1 homodimer that primarily binds to the GAS (45). Additionally, IFN-α may also induce expression from GAS promoters (49), and IFN-γ can activate ISRE-dependent promoters (15, 50–53). This cross-reactivity between IFNs and target promoter regions has been reported to be cell type specific (50), and may depend upon the activity of the secondary transcriptional activator IRF-1 (42, 43). Furthermore, others have shown that IL-29 can induce transcription factor binding to both ISRE and GAS promoter elements (4, 21, 22).
We found that both IFN-α and IL-29 activated expression from an ISRE-dependent, but not a GAS-dependent, promoter in Huh7 cells, and that the combination of these cytokines induced significantly greater activity. Although IFN-γ induced expression from both the ISRE and GAS promoters, the combination of IL-29 and IFN-γ only enhanced expression from the ISRE-dependent promoter. These data indicate that IL-29 can potentiate ISRE-, but not GAS-dependent gene expression. ISRE activation alone, however, may not completely explain the synergistic gene expression found with the combination of IFN-γ and IL-29. Of course, in natural promoters, multiple transcriptional regulatory elements are often present. We found that ISGs often contain both ISRE and GAS elements in their promoters, allowing induction by both IL-29 and IFN-γ, which leads to synergistic activation of gene expression, at least for certain genes. Therefore, these data indicate that two different mechanisms contribute to the enhanced gene expression, increased activation of ISREs and simultaneous activation of both ISRE and GAS elements.
We also measured STAT activation to better understand the mechanism of the additive and synergistic activity. The combination of IFN-α and IL-29 induced greater STAT-1, STAT-2, and STAT-3 phosphorylation compared with the individual cytokines alone. In contrast, although IL-29 and IFN-γ induced greater phosphorylation of STAT-3 when combined, no increase was observed for STAT-1 or STAT-2 phosphorylation relative to IFN-γ alone. These results suggest that the additive activity of IL-29/IFN-α is due in part to increased activation of STAT-1 and STAT-2. However, the synergistic activity of IL-29 and IFN-γ cannot be wholly attributed to STAT activation, as only an increase in STAT-3 phosphorylation was observed, and the increase was not greater than that observed for the IL-29/IFN-α combination. Interestingly, it has been reported that STAT-3 plays a role in the IFN-α-mediated inhibition of HCV replication (20, 54). Our data are therefore also consistent with a potential role for STAT-3 in the antiviral responses against HCV induced by the IL-29/IFN-α and IL-29/IFN-γ combinations.
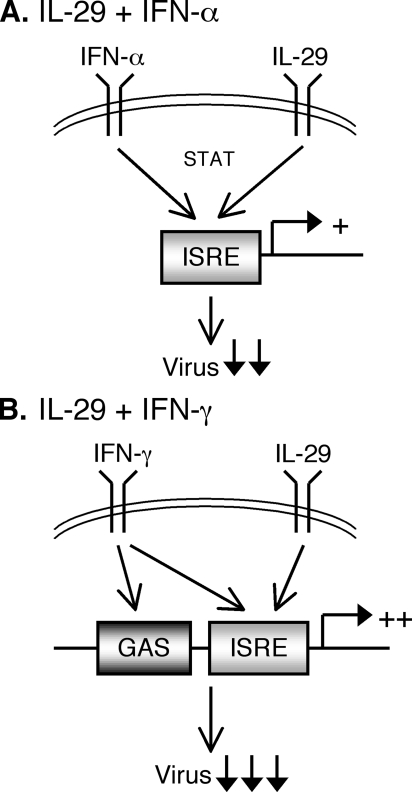
A model summarizing these data is presented in Fig. 10. When both IFN-α and IL-29 receptors are simultaneously activated, STAT phosphorylation and ISRE-dependent gene expression are more highly induced, leading to enhanced antiviral protein expression and greater inhibition of virus replication. In contrast, the combination of IFN-γ and IL-29 not only induces greater activation of ISREs, but also enhances expression of genes with GAS elements in their promoters. This leads to not only a wider range of antiviral gene expression, but also a substantial increase in the magnitude of expression of genes containing both ISRE and GAS regulatory elements, ultimately leading to a synergistic inhibition of virus replication.
FIGURE 10.
Models of enhanced ISG activation by cytokine combinations. A, model for IFN-α and IL-29 additive activity. Both cytokines activate ISRE sequences, leading to enhanced ISRE-dependent gene expression and greater viral inhibition compared with a single cytokine alone. B, model for IFN-γ and IL-29 synergistic activity. Enhanced activation of ISRE sequences, along with IFN-γ-mediated activation of GAS elements, leads to synergistic increases in gene expression and inhibition of virus replication.
A key attribute of cytokines is their ability to interact with one another to increase or inhibit a specific cellular response in a coordinated manner. As we have demonstrated here, IL-29 is no exception, as it can cooperate with both IFN-α and IFN-γ via different mechanisms to promote the antiviral response. Although IFN-α is used therapeutically for patients with chronic HCV or HBV infections, the undesirable side effects are a major drawback of treatment. The results of this study suggest that IL-29 in combination with other cytokines may prove to be an attractive alternative for chronic viral infections. Additional clinical studies are needed to determine the efficacy and feasibility of such treatments.
The costs of publication of this article were defrayed in part by the payment of page charges. This article must therefore be hereby marked “advertisement” in accordance with 18 U.S.C. Section 1734 solely to indicate this fact.
Footnotes
The abbreviations used are: HCV, hepatitis C virus; IFN, interferon; ISRE, interferon-stimulated response element; GAS, γ-activated sequence; IRF, interferon regulatory factor; STAT, signal transducer and activator of transcription; SOCS, suppressor of cytokine signaling; IL, interleukin; VSV, vesicular stomatitis virus; ISG, interferon-stimulated gene; RT, reverse transcriptase; GAPDH, glyceraldehyde-3-phosphate dehydrogenase; GFP, green fluorescent protein; MTT, 3-(4,5-dimethylthiazol-2-yl)-2,5-diphenyltetrazolium bromide.
References
- 1.World Health Organization (2000) Weekly Epidemiological Record 74 421-428 [Google Scholar]
- 2.Verna, E. C., and Brown, R. S., Jr. (2006) Clin. Liver Dis. 10 919-940 [DOI] [PubMed] [Google Scholar]
- 3.Poynard, T., Yuen, M. F., Ratziu, V., and Lai, C. L. (2003) Lancet 362 2095-2100 [DOI] [PubMed] [Google Scholar]
- 4.Kotenko, S. V., Gallagher, G., Baurin, V. V., Lewis-Antes, A., Shen, M., Shah, N. K., Langer, J. A., Sheikh, F., Dickensheets, H., and Donnelly, R. P. (2003) Nat. Immunol. 4 69-77 [DOI] [PubMed] [Google Scholar]
- 5.Sheppard, P., Kindsvogel, W., Xu, W., Henderson, K., Schlutsmeyer, S., Whitmore, T. E., Kuestner, R., Garrigues, U., Birks, C., Roraback, J., Ostrander, C., Dong, D., Shin, J., Presnell, S., Fox, B., Haldeman, B., Cooper, E., Taft, D., Gilbert, T., Grant, F. J., Tackett, M., Krivan, W., McKnight, G., Clegg, C., Foster, D., and Klucher, K. M. (2003) Nat. Immunol. 4 63-68 [DOI] [PubMed] [Google Scholar]
- 6.Ank, N., West, H., Bartholdy, C., Eriksson, K., Thomsen, A. R., and Paludan, S. R. (2006) J. Virol. 80 4501-4509 [DOI] [PMC free article] [PubMed] [Google Scholar]
- 7.Coccia, E. M., Severa, M., Giacomini, E., Monneron, D., Remoli, M. E., Julkunen, I., Cella, M., Lande, R., and Uze, G. (2004) Eur. J. Immunol. 34 796-805 [DOI] [PubMed] [Google Scholar]
- 8.Robek, M. D., Boyd, B. S., and Chisari, F. V. (2005) J. Virol. 79 3851-3854 [DOI] [PMC free article] [PubMed] [Google Scholar]
- 9.Marcello, T., Grakoui, A., Barba-Spaeth, G., Machlin, E. S., Kotenko, S. V., MacDonald, M. R., and Rice, C. M. (2006) Gastroenterology 131 1887-1898 [DOI] [PubMed] [Google Scholar]
- 10.Zhu, H., Butera, M., Nelson, D. R., and Liu, C. (2005) Virol. J. 2 80. [DOI] [PMC free article] [PubMed] [Google Scholar]
- 11.Brand, S., Zitzmann, K., Dambacher, J., Beigel, F., Olszak, T., Vlotides, G., Eichhorst, S. T., Goke, B., Diepolder, H., and Auernhammer, C. J. (2005) Biochem. Biophys. Res. Commun. 331 543-548 [DOI] [PubMed] [Google Scholar]
- 12.Donnelly, R. P., Sheikh, F., Kotenko, S. V., and Dickensheets, H. (2004) J. Leukocyte Biol. 76 314-321 [DOI] [PubMed] [Google Scholar]
- 13.Sommereyns, C., Paul, S., Staeheli, P., and Michiels, T. (2008) PLoS Pathog. 4 e1000017. [DOI] [PMC free article] [PubMed] [Google Scholar]
- 14.Ank, N., Iversen, M. B., Bartholdy, C., Staeheli, P., Hartmann, R., Jensen, U. B., Dagnaes-Hansen, F., Thomsen, A. R., Chen, Z., Haugen, H., Klucher, K., and Paludan, S. R. (2008) J. Immunol. 180 2474-2485 [DOI] [PubMed] [Google Scholar]
- 15.Stark, G. R., Kerr, I. M., Williams, B. R., Silverman, R. H., and Schreiber, R. D. (1998) Annu. Rev. Biochem. 67 227-264 [DOI] [PubMed] [Google Scholar]
- 16.Levy, D. E., Kessler, D. S., Pine, R., Reich, N., and Darnell, J. E., Jr. (1988) Genes Dev. 2 383-393 [DOI] [PubMed] [Google Scholar]
- 17.Decker, T., Lew, D. J., and Darnell, J. E., Jr. (1991) Mol. Cell. Biol. 11 5147-5153 [DOI] [PMC free article] [PubMed] [Google Scholar]
- 18.Dumoutier, L., Tounsi, A., Michiels, T., Sommereyns, C., Kotenko, S. V., and Renauld, J. C. (2004) J. Biol. Chem. 279 32269-32274 [DOI] [PubMed] [Google Scholar]
- 19.Doyle, S. E., Schreckhise, H., Khuu-Duong, K., Henderson, K., Rosler, R., Storey, H., Yao, L., Liu, H., Barahmand-pour, F., Sivakumar, P., Chan, C., Birks, C., Foster, D., Clegg, C. H., Wietzke-Braun, P., Mihm, S., and Klucher, K. M. (2006) Hepatology 44 896-906 [DOI] [PubMed] [Google Scholar]
- 20.Zhu, H., Shang, X., Terada, N., and Liu, C. (2004) Biochem. Biophys. Res. Commun. 324 518-528 [DOI] [PubMed] [Google Scholar]
- 21.Lasfar, A., Lewis-Antes, A., Smirnov, S. V., Anantha, S., Abushahba, W., Tian, B., Reuhl, K., Dickensheets, H., Sheikh, F., Donnelly, R. P., Raveche, E., and Kotenko, S. V. (2006) Cancer Res. 66 4468-4477 [DOI] [PubMed] [Google Scholar]
- 22.Meager, A., Visvalingam, K., Dilger, P., Bryan, D., and Wadhwa, M. (2005) Cytokine 31 109-118 [DOI] [PubMed] [Google Scholar]
- 23.Sainz, B., Jr., and Halford, W. P. (2002) J. Virol. 76 11541-11550 [DOI] [PMC free article] [PubMed] [Google Scholar]
- 24.Pierce, A. T., DeSalvo, J., Foster, T. P., Kosinski, A., Weller, S. K., and Halford, W. P. (2005) J. Gen. Virol. 86 2421-2432 [DOI] [PMC free article] [PubMed] [Google Scholar]
- 25.Fuchizaki, U., Kaneko, S., Nakamoto, Y., Sugiyama, Y., Imagawa, K., Kikuchi, M., and Kobayashi, K. (2003) J. Med. Virol. 69 188-194 [DOI] [PMC free article] [PubMed] [Google Scholar]
- 26.D'Onofrio, C., Franzese, O., Puglianiello, A., Peci, E., Lanzilli, G., and Bonmassar, E. (1992) Int. J. Immunopharmacol. 14 1069-1079 [DOI] [PubMed] [Google Scholar]
- 27.Sainz, B., Jr., LaMarca, H. L., Garry, R. F., and Morris, C. A. (2005) Virol. J. 2 14. [DOI] [PMC free article] [PubMed] [Google Scholar]
- 28.Okuse, C., Rinaudo, J. A., Farrar, K., Wells, F., and Korba, B. E. (2005) Antiviral. Res. 65 23-34 [DOI] [PubMed] [Google Scholar]
- 29.Larkin, J., Jin, L., Farmen, M., Venable, D., Huang, Y., Tan, S. L., and Glass, J. I. (2003) J. Interferon Cytokine Res. 23 247-257 [DOI] [PubMed] [Google Scholar]
- 30.Blight, K. J., Kolykhalov, A. A., and Rice, C. M. (2000) Science 290 1972-1974 [DOI] [PubMed] [Google Scholar]
- 31.van den Pol, A. N., Robek, M. D., Ghosh, P. K., Ozduman, K., Bandi, P., Whim, M. D., and Wollmann, G. (2007) J. Virol. 81 332-348 [DOI] [PMC free article] [PubMed] [Google Scholar]
- 32.Rubinstein, S., Familletti, P. C., and Pestka, S. (1981) J. Virol. 37 755-758 [DOI] [PMC free article] [PubMed] [Google Scholar]
- 33.Bolstad, B. M., Irizarry, R. A., Astrand, M., and Speed, T. P. (2003) Bioinformatics 19 185-193 [DOI] [PubMed] [Google Scholar]
- 34.Kennedy, R. E., Archer, K. J., and Miles, M. F. (2006) BMC Bioinformatics 7 154. [DOI] [PMC free article] [PubMed] [Google Scholar]
- 35.Kennedy, R. E., Kerns, R. T., Kong, X., Archer, K. J., and Miles, M. F. (2006) Bioinformatics 22 1272-1274 [DOI] [PubMed] [Google Scholar]
- 36.Gentleman, R. C., Carey, V. J., Bates, D. M., Bolstad, B., Dettling, M., Dudoit, S., Ellis, B., Gautier, L., Ge, Y., Gentry, J., Hornik, K., Hothorn, T., Huber, W., Iacus, S., Irizarry, R., Leisch, F., Li, C., Maechler, M., Rossini, A. J., Sawitzki, G., Smith, C., Smyth, G., Tierney, L., Yang, J. Y., and Zhang, J. (2004) Genome Biol. 5 R80. [DOI] [PMC free article] [PubMed] [Google Scholar]
- 37.Kent, W. J., Sugnet, C. W., Furey, T. S., Roskin, K. M., Pringle, T. H., Zahler, A. M., and Haussler, D. (2002) Genome Res. 12 996-1006 [DOI] [PMC free article] [PubMed] [Google Scholar]
- 38.Barash, Y., Bejerano, G., and Friedman, N. (2001) in Algorithms in Bioinformatics (Gascuel, O., and Moret, B. M. E., eds) pp. 278-293, Springer, Berlin/Heidelberg
- 39.Ramsburg, E., Publicover, J., Buonocore, L., Poholek, A., Robek, M., Palin, A., and Rose, J. K. (2005) J. Virol. 79 15043-15053 [DOI] [PMC free article] [PubMed] [Google Scholar]
- 40.Kapadia, S. B., and Chisari, F. V. (2005) Proc. Natl. Acad. Sci. U. S. A. 102 2561-2566 [DOI] [PMC free article] [PubMed] [Google Scholar]
- 41.Prichard, M. N., and Shipman, C., Jr. (1990) Antiviral Res. 14 181-205 [DOI] [PubMed] [Google Scholar]
- 42.Kroger, A., Koster, M., Schroeder, K., Hauser, H., and Mueller, P. P. (2002) J. Interferon Cytokine Res. 22 5-14 [DOI] [PubMed] [Google Scholar]
- 43.Taniguchi, T., Ogasawara, K., Takaoka, A., and Tanaka, N. (2001) Annu. Rev. Immunol. 19 623-655 [DOI] [PubMed] [Google Scholar]
- 44.Stoltz, M., Ahlm, C., Lundkvist, A., and Klingstrom, J. (2007) J. Virol. 81 8685-8691 [DOI] [PMC free article] [PubMed] [Google Scholar]
- 45.Shuai, K., and Liu, B. (2003) Nat. Rev. Immunol. 3 900-911 [DOI] [PubMed] [Google Scholar]
- 46.Randall, G., Chen, L., Panis, M., Fischer, A. K., Lindenbach, B. D., Sun, J., Heathcote, J., Rice, C. M., Edwards, A. M., and McGilvray, I. D. (2006) Gastroenterology 131 1584-1591 [DOI] [PubMed] [Google Scholar]
- 47.Jiang, D., Guo, H., Xu, C., Chang, J., Gu, B., Wang, L., Block, T. M., and Guo, J. T. (2008) J. Virol. 82 1665-1678 [DOI] [PMC free article] [PubMed] [Google Scholar]
- 48.Itsui, Y., Sakamoto, N., Kurosaki, M., Kanazawa, N., Tanabe, Y., Koyama, T., Takeda, Y., Nakagawa, M., Kakinuma, S., Sekine, Y., Maekawa, S., Enomoto, N., and Watanabe, M. (2006) J. Viral. Hepat. 13 690-700 [DOI] [PubMed] [Google Scholar]
- 49.Khan, K. D., Shuai, K., Lindwall, G., Maher, S. E., Darnell, J. E., Jr., and Bothwell, A. L. (1993) Proc. Natl. Acad. Sci. U. S. A. 90 6806-6810 [DOI] [PMC free article] [PubMed] [Google Scholar]
- 50.Bluyssen, H. A., Muzaffar, R., Vlieststra, R. J., van der Made, A. C., Leung, S., Stark, G. R., Kerr, I. M., Trapman, J., and Levy, D. E. (1995) Proc. Natl. Acad. Sci. U. S. A. 92 5645-5649 [DOI] [PMC free article] [PubMed] [Google Scholar]
- 51.Reid, L. E., Brasnett, A. H., Gilbert, C. S., Porter, A. C., Gewert, D. R., Stark, G. R., and Kerr, I. M. (1989) Proc. Natl. Acad. Sci. U. S. A. 86 840-844 [DOI] [PMC free article] [PubMed] [Google Scholar]
- 52.Ohmori, Y., and Hamilton, T. A. (1993) J. Biol. Chem. 268 6677-6688 [PubMed] [Google Scholar]
- 53.Wesoly, J., Szweykowska-Kulinska, Z., and Bluyssen, H. A. (2007) Acta Biochim. Pol. 54 27-38 [PubMed] [Google Scholar]
- 54.Zhu, H., Zhao, H., Collins, C. D., Eckenrode, S. E., Run, Q., McIndoe, R. A., Crawford, J. M., Nelson, D. R., She, J. X., and Liu, C. (2003) Hepatology 37 1180-1188 [DOI] [PubMed] [Google Scholar]


