Abstract
Macrophage galactose-type C-type lectins 1 and 2 (MGL1/2) are expressed on the surfaces of macrophages and immature dendritic cells. Despite the high similarity between the primary sequences of MGL1 and MGL2, they display different ligand specificities. MGL1 shows high affinity for the LewisX trisaccharide, whereas MGL2 shows affinity for N-acetylgalactosamine. To elucidate the structural basis for the ligand specificities of the MGLs, we performed NMR analyses of the MGL1-LewisX complex. To identify the LewisX binding site on MGL1, a saturation transfer experiment for the MGL1-LewisX complex where sugar-CH/CH2-selective saturation was applied was carried out. To obtain sugar moiety-specific information on the interface between MGL1 and the LewisX trisaccharide, saturation transfer experiments where each of galactose-H5-, fucose-CH3-, and N-acetylglucosamine-CH3-selective saturations was applied to the MGL1-LewisX complex were performed. Based on these results, we present a LewisX binding mode on MGL1 where the galactose moiety is bound to the primary sugar binding site, including Asp-94, Trp-96, and Asp-118, and the fucose moiety interacts with the secondary sugar binding site, including Ala-89 and Thr-111. Ala-89 and Thr-111 in MGL1 are replaced with arginine and serine in MGL2, respectively. The hydrophobic environment formed by a small side chain of Ala-89 and a methyl group of Thr-111 is a requisite for the accommodation of the fucose moiety of the LewisX trisaccharide within the sugar binding site of MGL1.
Macrophage galactose (Gal)2-type calcium-type (C-type) lectins (MGLs; CD301) are carbohydrate recognition proteins expressed on the surfaces of macrophages and immature dendritic cells in humans and rodents (1-4). In mice, two closely related MGLs, MGL1 and MGL2 (CD301a and CD301b), have been found (3), whereas humans have a single MGL (CD301) gene (2). MGLs have unique carbohydrate specificities toward galactose and N-acetylgalactosamine as monosaccharides, whereas many other C-type lectins on macrophages and dendritic cells have the mannose (Man)-type specificity, such as DC-SIGN and the macrophage mannose receptor (5). The cells expressing MGL1 are widely distributed in connective tissues (6). A variety of biological functions of MGL1 have been reported so far, such as the recognition and endocytosis of glycoproteins with terminal Gal/GalNAc moieties (7, 8), contribution to defense against tumor cell metastasis (9, 10), and clearance of apoptotic cells in embryos (11, 12). MGL2 is also expressed on the cells that display the same distribution pattern as MGL1-positive cells (3). For human MGL, additional functions, involvements in the regulation of effector T cells (13) and the promotion of filovirus entry (14), have been reported.
The MGL molecules are ∼42-kDa type II transmembrane glycoproteins, which possess a cytoplasmic domain, a transmembrane domain, a neck domain, and a carbohydrate recognition domain (CRD) within each molecule (1, 3). Two potential N-glycosylation sites are present in the neck domain. MGL1 and MGL2 share a high amino acid sequence homology (92% for the intact sequence and 80% for the CRD). Both MGL1 and MGL2 have the “QPD” sequences characteristic of the Gal-type C-type lectins in their CRDs (15). Nevertheless MGL1 and MGL2 display different carbohydrate specificities. MGL1 preferentially binds the LewisX trisaccharides (Galβ1-4[Fucα1-3]GlcNAc), whereas MGL2 exhibits specificity for α- and β-GalNAc (3). A site-directed mutagenesis study revealed that amino acid residues at positions 61, 89, 111, and 125 are implicated in the carbohydrate specificities of MGLs (16). Models of the complexes between MGLs and GalNAc were also constructed using a commercially available docking software without any experimental restraints (16). Therefore, the polysaccharide binding mechanism on MGL1 is putative. To elucidate exact roles of these residues in the sugar binding, structural information for the interaction between MGLs and their ligand carbohydrates is required.
Crystallographic studies on engineered Gal-type mutants of mannose-binding protein complexed with Gal-type monosaccharides have provided insights into the galactose binding modes of these lectins (17-19). These structures revealed the monosaccharide binding mode but not the polysaccharide binding mode. The crystal structure of human asialoglycoprotein receptor (ASGPR) has also been reported (20). In this structure, no bound sugar is visible even though the protein was co-crystallized with ligand carbohydrate. Therefore, there is no information about the interaction between the ligand and the lectin. In addition, a crystal structure of mouse scavenger receptor C-type lectin (mSRCL) has been solved with bound LewisX trisaccharide (21). This structure revealed that the LewisX binding mode is different from that on Man-type lectins, such as DC-SIGN (22). However, the orientation of the indole ring of Trp-698 in mSRCL, which plays a key role in the interaction with the galactose, is ∼180° different from that of typical Gal-type C-type lectins, such as ASGPR. This is because mSRCL lacks the glycine-rich loop, which is a characteristic structural component of Gal-type lectins, including MGLs and ASGPRs, and plays a crucial role in fixing the correct position of the indole ring of the tryptophan residue to interact with the galactose (17). Although x-ray studies have been extensively performed, little is known about the structural basis of the difference in the ligand binding specificities between MGL1 and MGL2.
In this report, we describe the results of our structural analyses of the MGL1-LewisX complex to understand the molecular basis for its carbohydrate specificity. First we quantitatively compared the affinities between MGL1 and its sugar ligands, the LewisX trisaccharide and β-methylgalactose, by isothermal calorimetry. Second we analyzed the 13C chemical shifts originating from MGL1 to characterize its topology. Finally we performed saturation transfer experiments to determine the sugar binding site on MGL1. Based on the structural data, we discuss the differential ligand specificities between MGL1 and MGL2.
EXPERIMENTAL PROCEDURES
Sample Preparation—Recombinant MGL1 was expressed in Escherichia coli BL21-Codon Plus (DE3)-RP cells (Stratagene) using the pET-21a plasmid containing the CRD of MGL1 (3). The C5S mutation was introduced into the CRD of MGL1, according to the QuikChange site-directed mutagenesis protocol (Stratagene), to prevent intermolecular oligomerization. In the following, we refer to MGL1 with the C5S mutation as the wild-type MGL1 unless otherwise described. Uniformly 15N-labeled and 13C,15N-labeled proteins were overexpressed in M9 minimal medium containing 1 g/liter 15NH4Cl (Shoko Co., Ltd.) and 4 g/liter glucose or 2 g/liter [13C]glucose (Cambridge Isotope Laboratories, Inc.), respectively. The cells were fermented at 37 °C until the A600 reached 0.5. Expression was induced with 1 mm isopropyl 1-thio-β-d-galactopyranoside for 5 h. The uniformly 2H,15N-labeled protein was overexpressed in 99.0% 2H2O (Cambridge Isotope Laboratories, Inc.) M9 minimal medium containing 1 g/liter 15NH4Cl, 2 g/liter [2H]glucose (Cambridge Isotope Laboratories, Inc.), and 1 g/liter 2H,15N-labeled CELTONE (Spectra Stable Isotopes). The cells were fermented at 37 °C until the A600 reached 0.8. Expression was induced with 1 mm isopropyl 1-thio-β-d-galactopyranoside for 16 h. The expressed MGL1 was refolded and purified as described previously (3). Further purification by size exclusion chromatography on a Superose 12 column or anion exchange chromatography on a Resource Q column (GE Healthcare) was performed after the previous protocols.
The expression vectors for the A89L, A89R, and T111S mutants of MGL1 were prepared using the plasmid of the wild-type MGL1. The mutant proteins were prepared using the same protocol.
Isothermal Titration Calorimetry—Binding of the carbohydrates (the LewisX trisaccharide and β-methylgalactose) to MGL1 (wild type, A89L mutant, A89R mutant, and T111S mutant) was measured by isothermal titration calorimetry (ITC) using a MicroCal VP-ITC MicroCalorimeter (MicroCal Inc.). MGL1 was dialyzed against a buffer containing 10 mm HEPES (pH 7.4), 2 mm CaCl2, and 50 mm NaCl. The lyophilized LewisX trisaccharide (Calbiochem) or β-methylgalactose (NBS Biologicals Ltd.) was dissolved in the same buffer used for the dialysis of MGL1. The experiments were performed at 25 °C. The sample cell was loaded with the MGL1 solution, and the protein was titrated with the sugar solution. The concentration of the samples were as follows: 0.21 mm wild-type MGL1 was titrated with 1.9 mm LewisX trisaccharide, 0.48 mm wild-type MGL1 was titrated with 4.9 mm β-methylgalactose, 0.37 mm A89L mutant of MGL1 was titrated with 2.8 mm LewisX trisaccharide, 0.39 mm A89R mutant of MGL1 was titrated with 2.8 mm LewisX trisaccharide, and 0.20 mm T111S mutant of MGL1 was titrated with 2.9 mm LewisX trisaccharide. The concentration of MGL1 was determined by measuring the A280 and the calculated extinction coefficient (23). The concentrations of the carbohydrates were determined by comparing the integrated NMR signal area with that of an internal standard. A total of 29 automatic injections of 10 μl each were carried out with spacing delays of 240 s between each injection. The heats of dilution, determined by the titration of the sugar into the same buffer alone, were subtracted from the raw titration data before data analysis. The integrated heats derived from the injection series were fitted to a single site model by the Origin software, which yielded the molar enthalpy of the association and the association constant. The stoichiometry was also estimated in the analyses.
NMR Experiments—Uniformly 13C- and 15N-labeled MGL1 was complexed with the LewisX trisaccharide and dissolved in 95% H2O, 5% 2H2O containing 10 mm HEPES (pH 7.4), 2 mm CaCl2, and 50 mm NaCl. Sets of triple resonance spectra (HNCA, HN(CO)CA, HNCACB, CBCA(CO)NH, and HBHA-(CO)NH (24-27)) were collected for the sample at 25 °C on a Bruker Avance 500 spectrometer. The 1H-15N NOE spectroscopy-HSQC (28) spectrum was obtained for the sample on a Bruker Avance 800 spectrometer. The mixing time in the 1H-15N NOE spectroscopy-HSQC experiment was set to 100 ms. Data were processed and analyzed using the XWINNMR program (Bruker) and the Sparky program3, respectively. The chemical shifts were referenced to the 1H resonance of 2,2-dimethyl-2-silapentane-5-sulfonate as described previously (29).
The secondary structure was analyzed by calculating the deviations of the observed 13Cα and 13Cβ chemical shifts from their residue-dependent random coil values (ΔCα and ΔCβ) (30). To account for the possible contributions of the two residues (ith - 1 and ith + 1 positions) in the sequence flanking the ith position, the parameter ΔCα,β = [(ΔCα, i - 1 -ΔCβ, i - 1) + 2 (ΔCα, i -ΔCβ, i) + (ΔCα, i + 1 -ΔCβ, i + 1)]/4 was used to predict the secondary structural elements (31). The regions with four or more consecutive >1.4 and <-1.4 ΔCα,β values were predicted as α helices and β strands, respectively.
The saturation transfer experiments were performed at 15 °C on a Bruker Avance 600 spectrometer using uniformly 2H,15N-labeled MGL1 complexed with the LewisX trisaccharide dissolved in 20% H2O, 80% 2H2O (pH 7.5) containing 2 mm CaCl2 and 50 mm NaCl. The concentrations of MGL1 and the LewisX trisaccharide were 1.1 and 1.3 mm, respectively. The irradiations were centered at 3.7, 1.1, 0.81, and 1.7 ppm for the saturations of sugar-CH/CH2, Gal-H5, Fuc-CH3, and GlcNAc-CH3, respectively. Band-selective saturations of the sugar-CH/CH2 resonances were achieved by a train of Gaussian pulse cascades (Q3), each 40 ms long with a maximum γB1 field of 83 Hz. Band-selective saturations of the Gal-H5, Fuc-CH3, and GlcNAc-CH3 resonances were achieved by a contiguous wave with a γB1 field of 23 Hz. The saturation was followed by the HSQC pulse sequence (32) to detect the amide resonances. The saturation time used was 2.5 s, and the relaxation delay was set to 2.0 s.
Tertiary Structure Modeling of MGL1—A tertiary structure model of MGL1 was built using the first approach mode of the SWISS-MODEL program server (33). The structure of the CRD of the H1 subunit of ASGPR (Protein Data Bank code 1DV8) was used as a template because of its high amino acid sequence homology to MGL1 (66%). The amino acid residues from Cys-6 to Lys-133 were modeled.
RESULTS
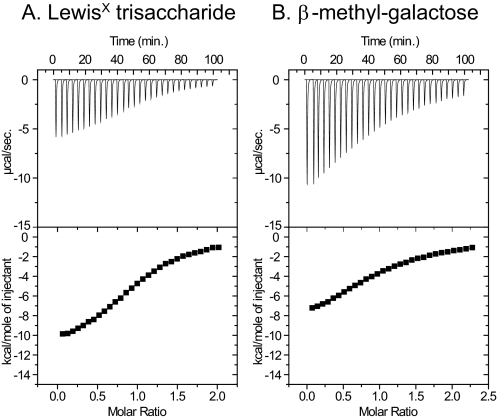
Carbohydrate Binding Activity of Recombinant MGL1—To characterize the carbohydrate binding activity of MGL1 quantitatively, the association constants for the interactions between wild-type MGL1 and the LewisX trisaccharide, wild-type MGL1 and β-methylgalactose, the A89L mutant of MGL1 and the LewisX trisaccharide, the A89R mutant of MGL1 and the LewisX trisaccharide, and the T111S mutant of MGL1 and the LewisX trisaccharide were determined by ITC. Fig. 1 shows the titration curves for the LewisX (A) and β-methylgalactose (B) binding to wild-type MGL1. The results obtained from the experiments are given in Table 1. Wild-type MGL1 showed higher affinity to the LewisX trisaccharide compared with that to β-methylgalactose. The A89L, A89R, and T111S mutants showed decreased affinity to the LewisX trisaccharide compared with that of the wild-type MGL1. It was also found that the sugar binding site within the CRD of MGL1 was single. The association constants obtained from ITC in the present study are different from those from SPR in the previous study (16). The difference is because of the immobilization effects in the SPR experiments as described previously (34, 35). In the previous SPR experiments, the rebinding effects were not negligible because the total amount of the sugar ligand immobilized on the sensor chip via polyacrylamide was high. However, what occurs in the SPR experiments under the condition with the high contents of the sugar ligands is quite similar to that on cell surfaces. In this sense, the data from the SPR experiments is meaningful. In this study, to prepare NMR samples of the MGL1-LewisX complex in a proper stoichiometry, the association constants were determined by ITC under the same condition as that for the NMR experiments.
FIGURE 1.
Results of the carbohydrate titration experiments. ITC profile of MGL1 binding to the LewisX trisaccharide (A) and β-methylgalactose (B) at 25 °C are shown. The upper panel shows the incremental heat liberation upon each injection, and the lower panel shows the integrated area of the above peaks, following the subtraction of the heat of dilution, plotted against the molar ratio of the ligand to MGL1 in the reaction cell. A, the LewisX solution at the concentration of 1.9 mm was injected into the MGL1 solution at the concentration of 0.21 mm. B, the β-methylgalactose solution at the concentration of 4.9 mm was injected into the MGL1 solution at the concentration of 0.48 mm.
TABLE 1.
Carbohydrate binding activities of MGL 1 and its variants obtained from ITC experiments
Experiments were performed at 25 °C in a buffer containing 10 mm HEPES (pH7.4), 2 mm CaCl2, and 50 mm NaCl.
| MGL1 | Ligand | Ka | Number of binding sites |
|---|---|---|---|
| m−1 | |||
| Wild type | Lewisx trisaccharide | 2.9 ± 0.1 × 10⁴ | 1.0 ± 0.0 |
| Wild type | β-Methylgalactose | 4.7 ± 0.1 × 10³ | 1.0 ± 0.0 |
| A89R mutant | Lewisx trisaccharide | <2.3 × 10³ | 1.0 ± 0.1 |
| A89L mutant | Lewisx trisaccharide | <2.5 × 10³ | 1.1 ± 0.0 |
| T111S mutant | Lewisx trisaccharide | <6.9 × 10³ | 1.4 ± 0.0 |
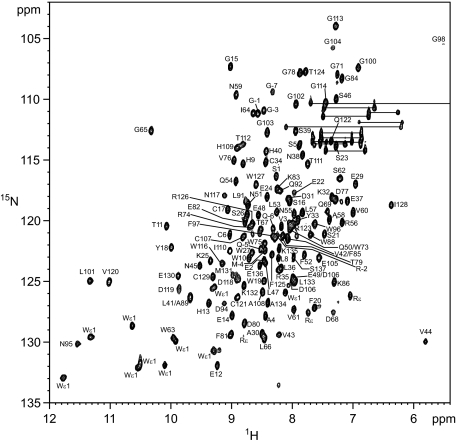
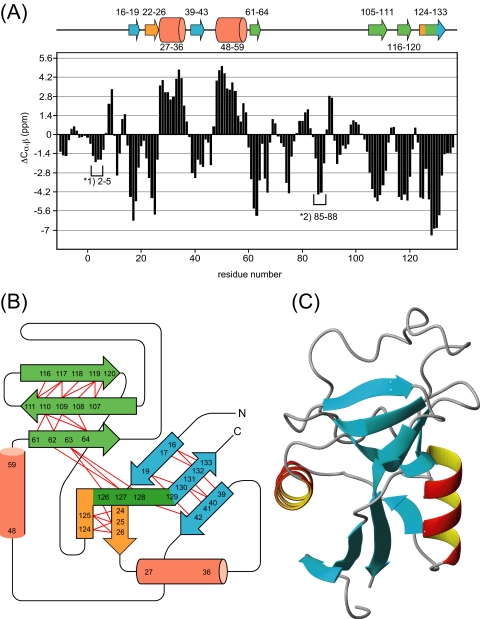
Secondary Structural Elements and Topology of MGL1—The 66% sequence homology is high for MGL1 assuming the similar CRD folding. However, there are still possibilities of subtle structural differences between MGL1 and its model in partial unfolding of α helices, the positions of short helices, and the length of β strands. To rule out these possibilities, we analyzed the secondary structural elements and topology of the MGL1-LewisX complex using NMR. Fig. 2 shows the 1H-15N HSQC spectrum of the MGL1-LewisX complex. The backbone resonance assignments for the complex were accomplished by analyzing a set of the standard triple resonance NMR spectra (HNCA, HN(CO)CA, HNCACB, and CBCA(CO)NH). Of 131 possible resonances originating from the backbone amide groups within the CRD of MGL1, 128 resonances (98%) could be assigned. Complete (137 of 137) assignments were obtained for the 13Cα and 13Cβ resonances. Using the deviations of the 13Cα and 13Cβ chemical shifts from the random coil values (Δ13Cα,β), the secondary structural elements within MGL1 were analyzed (Fig. 3A). The configurations of the β sheets were determined by analyzing the interstrand NOEs among the main chain protons. The resonances originating from the Hα were assigned by analyzing the HBHA(CO)NH spectrum. The predicted topology of the secondary structure of MGL1 is shown in Fig. 3B. MGL1 consists of two α helices (residues 27-36 and 48-59) and three β sheets (sheets I, II, and III). Sheet I consists of three β strands (β1, residues 16-19; β3, residues 39-43; and β9, residues 129-133), whereas sheet II has two β strands (β2, residues 22-26; and β7, residues 124-126), and sheet III has four β strands (β4, residues 61-64; β5, residues 105-111; β6, residues 116-120; and β8, residues 126-129). As for the two regions comprising residues 2-5 and 85-88, no interstrand NOEs were observed, suggesting that no β sheet structure exists in these regions, although the chemical shift predicted the β strand-like conformation. Based on the similarities in the amino acid sequence and the topology of the secondary structure, the structural model of MGL1 was constructed by SWISS-MODEL (Fig. 3C).
FIGURE 2.
1H-15N HSQC spectrum of MGL1 in the presence of the LewisX trisaccharide. The molar ratio of MGL1 to the LewisX trisaccharide was 1:1.2. The spectrum was obtained at 25 °C and a 1H frequency of 500 MHz. The amide side chain resonances of Asn and Gln are connected by horizontal lines.
FIGURE 3.
Secondary structural elements, topology, and modeled structure of MGL1. A, ΔCα,β values obtained for the MGL1-LewisX complex plotted against the residue number. The regions with four or more consecutive >1.4 values and those with <-1.4 were predicted as α helices and β strands, respectively. *1 and *2 show the regions that are not likely to form β strands because no interstrand NOE between main chain protons was observed. Putative secondary structural elements labeled with residue numbers are shown on the top of the diagram. Helices and strands are represented by cylinders and arrows, respectively. B, topology diagram of the MGL1-LewisX complex predicted from the chemical shift deviations and the NOEs. The β sheets I, II, and III are colored blue, orange, and green, respectively. Red lines indicate interstrand NOEs. C, ternary structural model of MGL1 prepared by SWISS-MODEL.
LewisX Binding Site on MGL1 Determined by Saturation Transfer Experiments—To determine the binding site of the LewisX trisaccharide on MGL1, saturation transfer experiments (36-38) were performed on MGL1 complexed with the LewisX trisaccharide. We first checked the effect of the saturation on MGL1 in the free state. Each of the saturations at 3.7, 1.1, 0.81, and 1.7 ppm caused no obvious signal intensity reductions for the amide resonances because the protein had been fully deuterated. Exceptionally signal intensity reduction ratios from 0.1 to 0.2 were observed for Glu-37, Asn-38, Ser-39, and Val-44 by the saturation at 3.7 ppm probably because of the spin diffusion from nearby hydroxyl protons, such as those of Tyr-13 and Ser-39.
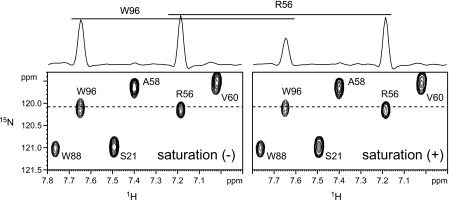
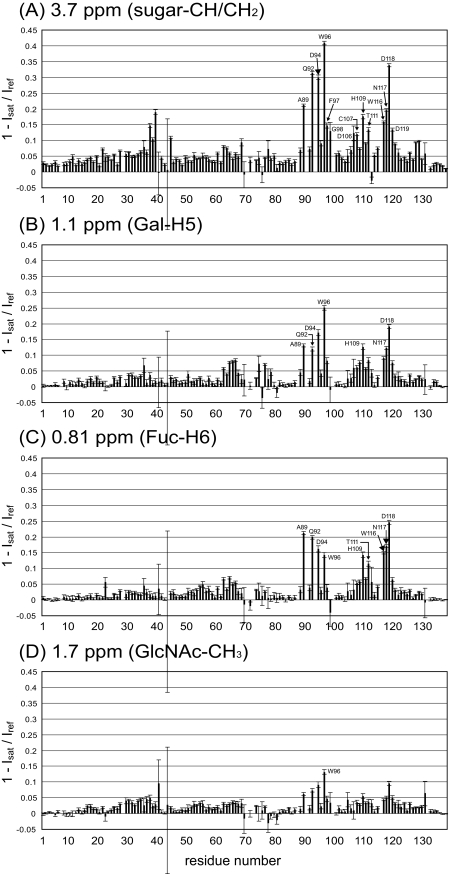
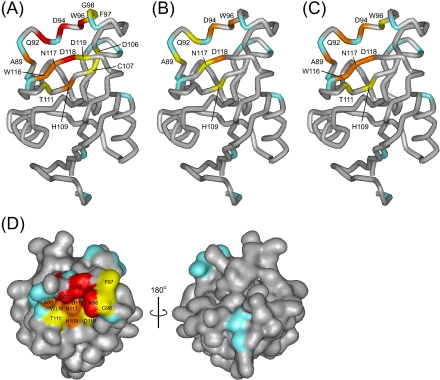
The LewisX-selective saturation was achieved by applying an rf irradiation centered at 3.7 ppm, which corresponds to most of the CH/CH2 protons within the sugar in the MGL1-bound state. Fig. 4 shows an expanded region of the 1H-15N HSQC spectra of the MGL1-LewisX complex with and without the saturation. Residue-selective signal intensity reductions were observed at 15 °C. Few signal intensity reductions were observed at 25 °C because of the short rotational correlation time of the MGL1-LewisX complex. It might be effective to lower the experimental temperature for the saturation transfer experiment on a complex with a molecular weight of ∼20,000. Of 127 analyzed signals originating from the main chain amide groups of MGL1, the signals from Gln-92, Asp-94, Trp-96, and Asp-118 exhibited intensity reduction ratios of more than 0.3; the signals from Ala-89, His-109, Trp-116, and Asn-117 showed intensity reduction ratios from 0.15 to 0.3; and the signals from Phe-97, Gly-98, Asp-106, Cys-107, Thr-111, and Asp-119 showed intensity reduction ratios from 0.1 to 0.15 (Fig. 5A). The residues affected by the saturation were mapped on the model structure of MGL1 (Fig. 6A). The affected residues formed a contiguous surface on MGL1, indicating that these residues form the LewisX binding site (Fig. 6D).
FIGURE 4.
Spectra obtained in the saturation transfer experiment. Representative regions of the 1H-15N HSQC spectra of the 2H,15N-labeled MGL1-LewisX complex without (left) and with (right) irradiation at 3.7 ppm are shown. Cross-sections parallel to the 1H axis at the positions of the broken horizontal lines are shown above the two-dimensional spectra. The concentrations of the MGL1 and the LewisX trisaccharide were 1.1 and 1.3 mm, respectively. The sample was dissolved in 20% H2O, 80% D2O containing 2 mm CaCl2 and 50 mm NaCl. The spectra were recorded at 15 °C and a 1H frequency of 600 MHz.
FIGURE 5.
Comparison of the reduction ratios of the signal intensities obtained in
the saturation transfer experiments. The reduction ratios of the signal
intensities were calculated using the formula 1 -
Isat/Iref where
Isat represents the signal intensity of an amide proton
resonance with saturation and Iref represents the
intensity of the corresponding signal without saturation. In each experiment,
the irradiation was applied at 3.7 ppm (CH/CH2 protons within the
LewisX trisaccharide) (A), 1.1 ppm (Gal-H5 within the
LewisX trisaccharide) (B), 0.8 ppm (Fuc-CH3
within the LewisX trisaccharide) (C), and 1.7 ppm
(GlcNAc-CH3 within the LewisX trisaccharide)
(D). The residues that displayed reduction ratios of more than 0.1
are labeled. The error bars were calculated using the formula
 where
Inoise(sat) and Inoise(ref) represent
the noise intensity in the spectra with and without saturation,
respectively.
FIGURE 6.
Mapping of the results of the saturation transfer experiments on the modeled structure of MGL1. A-C correspond to Fig. 5, A-C. The residues with reduction ratios of more than 0.3, 0.15-0.3, and 0.1-0.15 are colored red, orange, and yellow, respectively. Residues without available data (prolines, Glu-22, Asn-70, Asn-87, His-99, and Met-131) are colored cyan. D, surface representation of the modeled structure of MGL1. The residues identified as the LewisX binding site on MGL1 are mapped on the surface of the modeled structure of MGL1. The colors are used in the same scheme as in A. The residues colored red, orange, and yellow form a contiguous face on MGL1.
To obtain the sugar moiety-specific information on the interface between MGL1 and the LewisX trisaccharide, saturation transfer experiments, where the H5 proton of the Gal moiety (Gal-H5), the methyl protons of the Fuc moiety (Fuc-CH3), and the methyl protons of the GlcNAc moiety (GlcNAc-CH3) were saturated, were performed. The selective saturations of Gal-H5, Fuc-CH3, and GlcNAc-CH3 in the MGL1-bound state were achieved by applying rf irradiations centered at 1.1, 0.81, and 1.7 ppm, respectively. The resonances originating from the LewisX trisaccharide in the MGL1-bound state were assigned by analyzing the double quantum-filtered correlation spectroscopy, total correlation spectroscopy, and NOE spectroscopy spectra of the LewisX trisaccharide complexed with 2H,15N-labeled MGL1. By the Gal-H5 saturation, the signals from Asp-94, Trp-96, and Asp-118 showed intensity reduction ratios from 0.15 to 0.3, and the signals from Ala-89, Gln-92, His-109, and Asn-117 showed intensity reduction ratios from 0.1 to 0.15 (Fig. 5B). The affected residues were mapped on the model structure of MGL1 (Fig. 6B). By the Fuc-CH3 saturation, the signals from Ala-89, Gln-92, Asp-94, Trp-116, Asn-117, and Asp-118 showed intensity reduction ratios from 0.15 to 0.3, and the signals from Trp-96, His-109, and Thr-111 showed intensity reduction ratios from 0.1 to 0.15 (Fig. 5C). The affected residues were also mapped on the model structure of MGL1 (Fig. 6C). The GlcNAc-CH3 saturation slightly affected the intensity of the signal from Trp-96 (Fig. 5D).
DISCUSSION
The topology of MGL1 predicted by the NMR analyses indicated that the CRD of MGL1 basically adopts the typical C-type lectin fold, which characteristically has two α helices and two antiparallel β sheets within the fold (39). In addition, the topology of MGL1 was almost identical to that of the x-ray crystal structure of the human ASGPR, which shares high (66%) amino acid sequence homology to MGL1 (20). The secondary structural elements observed within the model structure that was made using SWISS-MODEL (Fig. 3C) agreed well with those predicted by the NMR analyses, supporting the validity of the main chain configuration of the modeled structure. In the following discussion, we use the modeled structure of MGL1 to interpret the results.
The LewisX binding site on MGL1 was successfully determined by the saturation transfer experiment where the CH/CH2 protons within the LewisX trisaccharide were saturated (Fig. 6, A and D). The central region of the LewisX binding site is mainly composed of polar residues, Gln-92, Asp-94, Asn-117, and Asp-118. The polar region is sandwiched by two hydrophobic regions. One region is composed of Trp-96, Phe-97, and Gly-98, and the other region is formed by Ala-89, Thr-111, and Trp-116.
Among the residues in the LewisX binding site, three residues, Asp-94, Trp-96, and Asp-118, experienced signal intensity reductions of more than 0.15 by the Gal-H5-selective saturation (Fig. 6B). The duration of 2.5 s used for the selective saturation is long enough to cause intra-Gal spin diffusion. Therefore, the residues affected by the Gal-H5-selective saturation are in close proximity to the protons within the Gal moiety. By the Fuc-CH3-selective saturation, six residues, Ala-89, Gln-92, Asp-94, Trp-116, Asn-117, and Asp-118 experienced signal intensity reductions of more than 0.15 (Fig. 6C). These residues are in close proximity to the protons within the Fuc moiety. In contrast, no residues experienced signal intensity reductions of more than 0.15 by the GlcNAc-CH3-selective saturation. This result suggests that the GlcNAc moiety of the LewisX trisaccharide does not make direct interactions with MGL1. This observation is supported by the fact that the sum of the residues affected by the Gal-H5 saturation and those affected by the Fuc-CH3 saturation corresponded to that of the residues constituting the LewisX binding site. In addition, few chemical shift perturbations were observed for resonances originating from the GlcNAc moiety in the LewisX trisaccharide upon the MGL1 binding (data not shown). Weak signal intensity reduction of Trp-96 by the saturation of GlcNAc-CH3 (1.7 ppm) will be caused by incidental saturation of the H6 proton of the Gal moiety (1.9 ppm).
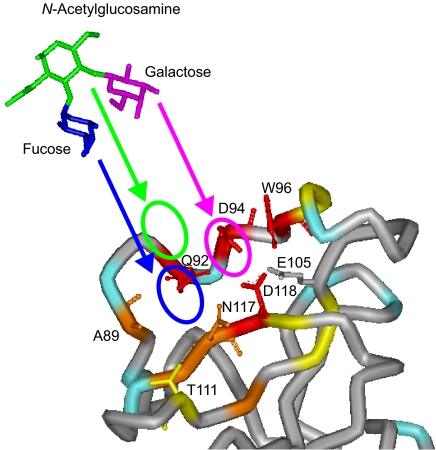
In total, the Gal and Fuc moieties of the LewisX trisaccharide occupy the entire LewisX binding site on MGL1. The Gal moiety is located in close proximity to Asp-94, Trp-96, and Asp-118. The Fuc moiety binding site is located adjacent to the Gal moiety binding site and includes Ala-89 and Thr-111. On the other hand, the GlcNAc moiety makes no direct contact with MGL1 but is located over the Gal and Fuc rings. The putative LewisX binding mode on MGL1 is illustrated in Fig. 7.
FIGURE 7.
Putative LewisX binding mode of MGL1. The putative arrangement of each carbohydrate residue of the LewisX trisaccharide on the active site of MGL1 is shown by circles. The magenta, blue, and green circles correspond to the Gal, Fuc, and GlcNAc moieties within the LewisX trisaccharide, respectively. MGL1 is colored according to the same scheme as in Fig. 6A. The structural model of the LewisX trisaccharide was taken from the Protein Data Bank (code 1SL6).
In the crystal structures of the Gal-type mannose-binding protein mutants complexed with Gal-type monosaccharides, the galactose ring is bound on the calcium ion, which is chelated by five residues, corresponding to Gln-92, Asp-94, Glu-105, Asp-118, and Asn-117 in MGL1. The tryptophan residue, corresponding to Trp-96 in MGL1, packs against the apolar face of the galactose ring, and the amide group of the aspartic acid residue, corresponding to Asp-118 in MGL1, is located near the 2-CH of the galactose (17-19). These arrangements are consistent with the present results of the saturation transfer experiments with the MGL1-LewisX complex. Interestingly the overall LewisX binding mode on MGL1 is highly related with that on mSRCL (21). However, amino acid residues interacting with the Fuc moiety of the LewisX trisaccharide are not conserved between these lectins, and the orientation of the tryptophan side chain of mSRCL (Trp-698), which interacts with the galactose moiety of the LewisX trisaccharide, is different from those of typical Gal-type C-type lectins with the glycine-rich loop (17-20). These structural differences might explain the 4.3 times higher affinity of MGL1 for the LewisX trisaccharide than that of human scavenger receptor C-type lectin (40).
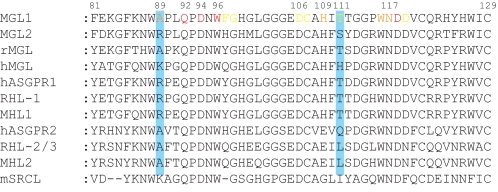
Fig. 8 compares the amino acid sequences of MGL1, MGL2, and the related Gal-type C-type lectins. Although most of the amino acid residues identified within the LewisX binding site on MGL1 are conserved in MGL2, interestingly Ala-89 and Thr-111 are replaced by Arg-89 and Ser-111 in MGL2, respectively. This observation suggests that the amino acid residues at positions 89 and 111 are responsible for the different ligand specificities between MGL1 and MGL2. As for MGL1, the side chain of Ala-89 is small enough to accommodate the Fuc moiety of the LewisX trisaccharide within the secondary sugar binding site around Ala-89. On the other hand, the bulky side chain of Arg-89 in MGL2 would sterically hinder the access of the Fuc moiety, leading to lower affinity for the LewisX trisaccharide. This consideration is supported by the site-directed mutagenesis study where the A89L and A89R mutants of MGL1 showed lower affinity (<10%) for the LewisX trisaccharide as compared with that of the wild type. The importance of the methyl group of Thr-111 for the binding to the LewisX trisaccharide was also confirmed by the site-directed mutagenesis study. The hydrophobic environment formed by a small side chain of Ala-89 and a methyl group of Thr-111 is a requisite for the accommodation of the Fuc moiety of the LewisX trisaccharide within the sugar binding site of MGL1.
FIGURE 8.
Comparison of the selected regions of the amino acid sequences for the CRDs of Gal-type C-type lectins. The residues identified as the LewisX binding site on MGL1 are colored according to the same scheme as in Fig. 6A. The residues corresponding to Ala-89 and Thr-111 of MGL1 are represented by blue shading. rMGL, rat MGL; hMGL, human MGL; hASGPR, human ASGPR; RHL, rat hepatic lectin; MHL, mouse hepatic lectin.
There is a 6-fold difference in the affinity of MGL1 for the LewisX trisaccharide versus β-methylgalactose. This difference corresponds to ∼1 kcal/mol at 25 °C. Based on the NMR results, we suggest that MGL1 will form two more van der Waals interactions with the LewisX trisaccharide compared with β-methylgalactose: one between the methyl group of fucose and the methyl group of Ala-89 and the other between the methyl group of fucose and the methyl group of Thr-111. The ∼1 kcal/mol binding free energy can be explained by two van der Waals interactions (41).
In MGLs and hepatic lectins, two types of amino acids can be found at the position corresponding to Ala-89 in MGL1 (Fig. 8). One type has alanine residues at this position (A-type), whereas the other type has arginine/lysine residues (RK-type). The amino acid residue at position 89 plays a role in the accommodation of the LewisX-type branched oligosaccharide (A-type) or a role not to accommodate it (RK-type). Recently Coombs et al. (42) reported that rat MGL, with A-type sequence, displayed high affinity for oligosaccharides with terminal LewisX moiety, and rat hepatic lectin-1, with R-type sequence, bound strongly to oligosaccharides with terminal GalNAc. These observations agree with our interpretation on the ligand specificities of the Gal-type C-type lectins. The fact that only a few amino acid residues are responsible for the carbohydrate specificity of the Gal-type C-type lectin suggests that it might be possible to design lectins with other carbohydrate specificities in rational manners. An interesting unsolved question of animal lectins is how animal lectins show different specificities although they have similar structures. Our finding of the key residues to determine the specificity is useful for understanding recognition modes of C-type lectins and will contribute the structural basis of the interaction between lectins and their ligands.
This work was supported by Grant-in-aid for Scientific Research on Priority Areas 17035020 from The Ministry of Education, Culture, Sports, Science and Technology (MEXT). The costs of publication of this article were defrayed in part by the payment of page charges. This article must therefore be hereby marked “advertisement” in accordance with 18 U.S.C. Section 1734 solely to indicate this fact.
Footnotes
The abbreviations used are: Gal, galactose; C-type, calcium-type; Fuc, fucose; GlcNAc, N-acetylglucosamine; Man, mannose; MGL, macrophage galactose-type C-type lectin; ASGPR, asialoglycoprotein receptor; mSRCL, mouse scavenger receptor C-type lectin; DC-SIGN, dendritic cell-specific intracellular adhesion molecule-3 (ICAM-3)-grabbing nonintegrin; CRD, carbohydrate recognition domain; NOE, nuclear Overhauser effect; HSQC, heteronuclear single quantum coherence; ITC, isothermal titration calorimetry; SPR, surface plasmon resonance.
T. D. Goddard and D. G. Kneller, unpublished software.
References
- 1.Sato, M., Kawakami, K., Osawa, T., and Toyoshima, S. (1992) J. Biochem. 111 331-336 [DOI] [PubMed] [Google Scholar]
- 2.Suzuki, N., Yamamoto, K., Toyoshima, S., Osawa, T., and Irimura, T. (1996) J. Immunol. 156 128-135 [PubMed] [Google Scholar]
- 3.Tsuiji, M., Fujimori, M., Ohashi, Y., Higashi, N., Onami, T. M., Hedrick, S. M., and Irimura, T. (2002) J. Biol. Chem. 277 28892-28901 [DOI] [PubMed] [Google Scholar]
- 4.Higashi, N., Fujioka, K., Denda-Nagai, K., Hashimoto, S., Nagai, S., Sato, T., Fujita, Y., Morikawa, A., Tsuiji, M., Miyata-Takeuchi, M., Sano, Y., Suzuki, N., Yamamoto, K., Matsushima, K., and Irimura, T. (2002) J. Biol. Chem. 277 20686-20693 [DOI] [PubMed] [Google Scholar]
- 5.Linehan, S. A., Martinez-Pomares, L., and Gordon, S. (2000) Microbes Infect. 2 279-288 [DOI] [PubMed] [Google Scholar]
- 6.Mizuochi, S., Akimoto, Y., Imai, Y., Hirano, H., and Irimura, T. (1997) Glycobiology 7 137-146 [DOI] [PubMed] [Google Scholar]
- 7.Kawakami, K., Yamamoto, K., Toyoshima, S., Osawa, T., and Irimura, T. (1994) Jpn. J. Cancer Res. 85 744-749 [DOI] [PMC free article] [PubMed] [Google Scholar]
- 8.Denda-Nagai, K., Kubota, N., Tsuiji, M., Kamata, M., and Irimura, T. (2002) Glycobiology 12 443-450 [DOI] [PubMed] [Google Scholar]
- 9.Ichii, S., Imai, Y., and Irimura, T. (1997) J. Leukoc. Biol. 62 761-770 [DOI] [PubMed] [Google Scholar]
- 10.Ichii, S., Imai, Y., and Irimura, T. (2000) Cancer Immunol. Immunother. 49 1-9 [DOI] [PMC free article] [PubMed] [Google Scholar]
- 11.Mizuochi, S., Akimoto, Y., Imai, Y., Hirano, H., and Irimura, T. (1998) Glycoconj. J. 15 397-404 [DOI] [PubMed] [Google Scholar]
- 12.Yuita, H., Tsuiji, M., Tajika, Y., Matsumoto, Y., Hirano, K., Suzuki, N., and Irimura, T. (2005) Glycobiology 15 1368-1375 [DOI] [PubMed] [Google Scholar]
- 13.van Vliet, S. J., Gringhuis, S. I., Geijtenbeek, T. B., and van Kooyk, Y. (2006) Nat. Immunol. 7 1200-1208 [DOI] [PubMed] [Google Scholar]
- 14.Takada, A., Fujioka, K., Tsuiji, M., Morikawa, A., Higashi, N., Ebihara, H., Kobasa, D., Feldmann, H., Irimura, T., and Kawaoka, Y. (2004) J. Virol. 78 2943-2947 [DOI] [PMC free article] [PubMed] [Google Scholar]
- 15.Drickamer, K. (1992) Nature 360 183-186 [DOI] [PubMed] [Google Scholar]
- 16.Oo-Puthinan, S., Maenuma, K., Sakakura, M., Denda-Nagai, K., Tsuiji, M., Shimada, I., Nakamura-Tsuruta, S., Hirabayashi, J., Bovin, N. V., and Irimura, T. (2008) Biochim. Biophys. Acta 1780 89-100 [DOI] [PubMed] [Google Scholar]
- 17.Kolatkar, A. R., and Weis, W. I. (1996) J. Biol. Chem. 271 6679-6685 [PubMed] [Google Scholar]
- 18.Kolatkar, A. R., Leung, A. K., Isecke, R., Brossmer, R., Drickamer, K., and Weis, W. I. (1998) J. Biol. Chem. 273 19502-19508 [DOI] [PubMed] [Google Scholar]
- 19.Feinberg, H., Torgersen, D., Drickamer, K., and Weis, W. I. (2000) J. Biol. Chem. 275 35176-35184 [DOI] [PubMed] [Google Scholar]
- 20.Meier, M., Bider, M. D., Malashkevich, V. N., Spiess, M., and Burkhard, P. (2000) J. Mol. Biol. 300 857-865 [DOI] [PubMed] [Google Scholar]
- 21.Feinberg, H., Taylor, M. E., and Weis, W. I. (2007) J. Biol. Chem. 282 17250-17258 [DOI] [PMC free article] [PubMed] [Google Scholar]
- 22.Guo, Y., Feinberg, H., Conroy, E., Mitchell, D. A., Alvarez, R., Blixt, O., Taylor, M. E., Weis, W. I., and Drickamer, K. (2004) Nat. Struct. Mol. Biol. 11 591-598 [DOI] [PubMed] [Google Scholar]
- 23.Gill, S. C., and Vonhippel, P. H. (1989) Anal. Biochem. 182 319-326 [DOI] [PubMed] [Google Scholar]
- 24.Grzesiek, S., and Bax, A. (1992) J. Magn. Reson. 96 432-440 [Google Scholar]
- 25.Kay, L. E., Xu, G. Y., and Yamazaki, T. (1994) J. Magn. Reson. Ser. A 109 129-133 [Google Scholar]
- 26.Muhandiram, D. R., and Kay, L. E. (1994) J. Magn. Reson. Ser. B 103 203-216 [Google Scholar]
- 27.Grzesiek, S., and Bax, A. (1993) J. Biomol. NMR 3 185-204 [DOI] [PubMed] [Google Scholar]
- 28.Marion, D., Driscoll, P. C., Kay, L. E., Wingfield, P. T., Bax, A., Gronenborn, A. M., and Clore, G. M. (1989) Biochemistry 28 6150-6156 [DOI] [PubMed] [Google Scholar]
- 29.Edison, A. S., Abildgaard, F., Westler, W. M., Mooberry, E. S., and Markley, J. L. (1994) Methods Enzymol. 239 3-79 [DOI] [PubMed] [Google Scholar]
- 30.Wishart, D. S., and Sykes, B. D. (1994) J. Biomol. NMR 4 171-180 [DOI] [PubMed] [Google Scholar]
- 31.Mal, T. K., Masutomi, Y., Zheng, L., Nakata, Y., Ohta, H., Nakatani, Y., Kokubo, T., and Ikura, M. (2004) J. Mol. Biol. 339 681-693 [DOI] [PubMed] [Google Scholar]
- 32.Kay, L. E., Keifer, P., and Saarinen, T. (1992) J. Am. Chem. Soc. 114 10663-10665 [Google Scholar]
- 33.Schwede, T., Kopp, J., Guex, N., and Peitsch, M. C. (2003) Nucleic Acids Res. 31 3381-3385 [DOI] [PMC free article] [PubMed] [Google Scholar]
- 34.Karlsson, R., Roos, H., Fägerstam, L., and Persson, B. (1994) Methods 6 99-110 [Google Scholar]
- 35.Myszka, D. G. (1997) Curr. Opin. Biotechnol. 8 50-57 [DOI] [PubMed] [Google Scholar]
- 36.Takahashi, H., Nakanishi, T., Kami, K., Arata, Y., and Shimada, I. (2000) Nat. Struct. Biol. 7 220-223 [DOI] [PubMed] [Google Scholar]
- 37.Takeda, M., Terasawa, H., Sakakura, M., Yamaguchi, Y., Kajiwara, M., Kawashima, H., Miyasaka, M., and Shimada, I. (2003) J. Biol. Chem. 278 43550-43555 [DOI] [PubMed] [Google Scholar]
- 38.Wüthrich, K. (1986) NMR of Proteins and Nucleic Acids, Wiley, New York
- 39.Kogelberg, H., and Feizi, T. (2001) Curr. Opin. Struct. Biol. 11 635-643 [DOI] [PubMed] [Google Scholar]
- 40.Coombs, P. J., Graham, S. A., Drickamer, K., and Taylor, M. E. (2005) J. Biol. Chem. 280 22993-22999 [DOI] [PubMed] [Google Scholar]
- 41.Kise, K. J., Jr., and Shin, J. A. (2001) Bioorg. Med. Chem. 9 2485-2491 [DOI] [PubMed] [Google Scholar]
- 42.Coombs, P. J., Taylor, M. E., and Drickamer, K. (2006) Glycobiology 16 1C-7C [DOI] [PMC free article] [PubMed] [Google Scholar]


