Abstract
The Period2 gene, an indispensable component of the circadian clock, not only modulates circadian oscillations, but also regulates organic function. We examined whether overexpression of the mouse Period2 gene (mPer2) in tumor cells influences cell growth and induces apoptosis. Overexpression of PERIOD2 in the mouse Lewis lung carcinoma cell line (LLC) and mammary carcinoma cell line (EMT6) results in reduced cellular proliferation and rapid apoptosis, but not in NIH 3T3 cells. Overexpressed mPER2 also altered the expression of apoptosis‐related genes. The mRNA and protein levels of c‐Myc, Bcl‐X L and Bcl‐2 were downregulated, whereas the expression of p53 and bax was upregulated in mPER2‐overexpressing LLC cells compared with control cells transferred with empty plasmid. Our results suggest that the circadian gene mPeriod2 may play an important role in tumor suppression by inducing apoptotic cell death, which is attributable to enhanced pro‐apoptotis signaling and attenuated anti‐apoptosis processes. (Cancer Sci 2006; 97: 589–596)
Abbreviations:
- EMT6
mouse mammary carcinoma cell
- LLC
Lewis lung carcinoma cell
- mPer2
mouse Period2 gene
- mPER2
mouse PERIOD2 protein
- ODN
antisense phosphorothioate oligonucleotide
- RT‐PCR
reverse transcription–polymerase chain reaction
- TPA
12‐O‐tetradecanoyl‐phorbol‐13‐acetate.
Circadian rhythms, which are daily oscillations regulated by an endogenous clock,( 1 , 2 , 3 ) enable organisms to adapt to daily environmental changes such as light, temperature and social communication, and serve to synchronize multiple molecular, biochemical, physiological and behavioral processes.( 4 , 5 , 6 ) Recent studies suggest that the circadian system is not only required for proper growth control, but is also involved in the circadian regulation of cell proliferation and apoptosis.( 7 , 8 , 9 ) It has been reported that 2–10% of all mammalian genes are clock‐controlled.( 4 , 5 , 10 , 11 , 12 ) Most of these show tissue‐ or organ‐specific expression and are involved in organ function. Only a small set of clock‐controlled genes are expressed in multiple organs. Among them are genes that encode key regulators of cell cycle progression.( 10 , 11 ) Deregulation of the circadian clock may disturb the expression of clock‐controlled genes and can have a profound influence on organ function.
It is now documented that alterations in circadian rhythm can be associated with cancers in both animal and human tumors.( 13 , 14 ) Up to now, at least eight core circadian clock genes have been identified in mammals and humans,( 2 , 15 ) and the Period2 gene is regarded as an indispensable component of the circadian clock.( 16 ) Gene targeting studies have demonstrated that the deletion of mPer2 induces arrhythmicity at both the behavioral and molecular levels.( 17 ) Mice without mPER2 function have a transient rhythm with a shortened period length of 22 h. A majority of mutant mice lose the persistence of circadian rhythm when placed in free‐running conditions.( 18 ) The mice deficient in the mPer2 gene were cancer‐prone. After γ radiation, these mice showed a marked increase in tumor development and reduced apoptosis in thymocytes. Temporal expression of the genes involved in cell cycle regulation and tumor suppression, such as Cyclin D1, Cyclin A, Mdm‐2 and Gadd45, were reportedly altered in mPer2 mutant mice.( 19 )
The relationship between mPer2 and cancer still lacks direct demonstration. In the present study, we transferred pcDNA3.1(+)‐mPer2 into LLC cells, EMT6 cells and NIH 3T3 cells, assessed the effect of mPER2 overexpression on these cells and explored the possible signaling pathways leading to apoptotic cell death. Results show that overexpression of mPER2 may induce tumor cell apoptosis by the p53‐mediated mitochondrial signaling pathway.
Materials and Methods
Plasmid
The eukaryotic expression vector pcDNA3.1(+)‐mPer2 containing a cDNA copy of mPer2 (GenBank number NM_011066) was used in this study. The mPer2 was confirmed as being in frame with no mutations by DNA sequencing.
Cell culture and transfection
Lewis lung carcinoma is a cell line established from the lung of a C57BL mouse bearing a tumor resulting from an implantation of primary Lewis lung carcinoma. EMT6 was established from a transplantable murine mammary carcinoma that arose in a BALB/cCRGL mouse after implantation of a hyperplastic mammary alveolar nodule. LLC, EMT6 and NIH 3T3 cells were maintained in Dulbecco's modified Eagle's medium (Hyclone, Logan, UT, USA) supplemented with antibiotics (BioWhitaker, Walkersville, MD, USA) and 10% fetal calf serum (Hyclone) in an atmosphere of humidified 95% air and 5% CO2 at 37°C. The cells were transfected with the plasmids indicated using Lipofectamine transfection reagent (Invitrogen, Carlsbad, CA, USA). Cell lysates were prepared 48 h later for the examination of protein expression.
Antisense phosphorothioate oligonucleotides
Antisense phosphorothioate oligonucleotides for mPER2 mRNA were used to block mPER2 expression. The efficacy of this method and sequences of ODN have been described previously.( 20 ) The antisense sequence targeting the coding region of mPER2 was 5′‐CACGTATCCATTCATGTCG‐3′, and the randomized control was 5′‐ACCATGTTACCTGACCTGT‐3′. All ODN were purified and amplified using high‐performance liquid chromatography and phosphorothioated to increase membrane permeability. Oligonucleotides were used at a final concentration of 10 µM.
We treated the cells with 100 nM TPA to induce endogenous mPER2 expression in LLC cells.( 21 ) Antisense oligonucleotides were used to block TPA‐induced mPER2 expression. To enhance cellular uptake, antisense and control oligonucleotides were added to the cultures using Lipofectoamine 2000 reagent (Invitrogen). Following the addition of TPA and oligonucleotides for 24 h, cells were grown in serum‐free medium. At 48 h later, cells were collected, fixed, and processed for flow cytometric analysis. We analyzed serum starvation‐induced apoptosis in three groups: (i) TPA alone; (ii) TPA and randomized oligonucleotides; and (iii) TPA and antisense oligonucleotides targeting mPer2.
Cell growth and proliferation
Cell growth and proliferation was assessed using the cell colony‐forming assay, cell growth curves and the MTT assay according to the standard protocol. Each assay was repeated three times.
Flow cytometry
The cells were harvested, washed with phosphate‐buffered saline and fixed in 70% ethanol for 30 min at 4°C, then treated with 50 µg/mL of RNase A (Sigma, St Louis, MO, USA), stained with 50 µg/mL propidium iodide for 20 min at 4°C without light, and analyzed by flow cytometry for DNA synthesis and cell cycle status (Beckman Coulter Elite, Miami Lakes, FL, USA).
To analyze the expression of apoptosis‐related proteins, the cells were harvested, fixed in 70% ethanol for 30 min at 4°C and incubated with 0.1% saponin for 20 min. They were then incubated with primary antibodies (Sigma) at a dilution of 1 : 100 for 30 min and incubated with fluorescein‐isothiocyanate‐conjugated secondary antibodies (Chemicon, Temecula, CA, USA) at a dilution of 1:100 for 30 min. The cells were then analyzed by flow cytometry.
Antibodies
Mouse antibodies against mPER2, P53, c‐MYC, BCL‐2, BAX, BCL‐XL and actin were purchased from Sigma. Rabbit anti‐goat IgG and horseradish peroxidase‐conjugated secondary antibodies were purchased from Santa Cruz Biotechnology (Santa Cruz, CA, USA).
Immunohistochemistry
Immunohistochemistry was carried out using the avidin–biotin complex method. The numbers of PER2‐positive and PER2‐negative tumor cells were determined in four random fields (×100 magnification), and the percentage of PER2‐positive cells was then calculated.
Morphological study
The cells were harvested and prepared for electron microscopy in the conventional manner. They were stained with uranyl acetate and lead citrate, and observed with an H‐600 IV transmission electron microscope (Hitachi, Tokyo, Japan).
DNA isolation and fragmentation assay (laddering)
DNA from each group was extracted using phenol/chloroform followed by ethanol precipitation. The DNA was dissolved in distilled water, and the concentration was measured spectroph‐otometrically. DNA (5 µg) from each sample was analyzed by electrophoresis on a 1.8% agarose gel containing ethidium bromide.
RT‐PCR
Total RNA was isolated with Trizol reagent (Invitrogen). RT‐PCR for mouse Per2, p53, c‐Myc, Bcl‐2, Bax, Bcl‐XL and GAPDH mRNA was carried out. Details of the primers and the GenBank accession numbers are given in Table 1.
Table 1.
Gene nomenclature, GenBank accession code, primer sequences, and predicted sizes of the amplified products for the different genes studied
| Gene | Accession number | Forward primer | Reverse primer | Size (bp) |
|---|---|---|---|---|
| Per2 | NM_011066 | GCAACGAGCCCTCAGACA | GGACCCACGGATGAACCT | 495 |
| p53 | AF161020 | ATGGAGGATTCACAGTCGGA | TCAGTCTGAGTCAGGCCCCA | 323 |
| c‐Myc | X01023 | CCCAAGGGAAGACGATG | GAGCGGGTAGGGAAAGA | 225 |
| Bcl‐2 | AH001858 | GCTACCGTCGTGACTTCGC | TCCCAGCCTCCGTTATCC | 268 |
| Bax | L22472 | GATGCGTCCACCAAGAA | AGTAGAAGAGGGCAACCAC | 565 |
| Bcl‐X L | L35049 | AGGCAGGCGATGAGTTT | CCTTGTCTACGCTTTCCAC | 412 |
| GAPDH | M88354 | TCACTGCCACCCAGAAGA | AAGTCGCAGGAGACAACC | 318 |
Western blot analysis
Cells were lysed with cold RIPA lysis buffer containing protease inhibitors, and proteins were collected by centrifugation. Protein concentrations were determined using the bicinchoninic acid (BCA) protein assay (Pierce, Rockford, IL, USA) and transferred electro‐phoretically to polyvinylidene difluoride (PVDF) membrane (Pierce). Detection was carried out using an enhanced chemiluminescence reagent (Pierce).
Statistical analysis
Data were presented as the mean ± SD, and the Student's t‐test was used for comparisons among different groups. P‐values of less than 0.05 were considered statistically significant.
Results
Effects of mPER2 on cell growth and proliferation
Parental LLC, EMT6 and NIH 3T3 cells normally produce very low and barely detectable levels of mPER2. We established mPER2‐overexpressing cells by transfecting mPER2 cDNA in a sense orientation into LLC, EMT6 and NIH 3T3 cells. The cells transfected with empty vector served as controls. Successful transfer of the mPer2 gene using Lipofectamine 2000 was confirmed by western blotting (Fig. 1A). It was also evident by immunohistochemistry that the mPER2 protein was expressed in approximately 80% of pcDNA3.1(+)‐mPer2‐transfected LLC cells, but not in empty vector‐transfected LLC cells (Fig. 1B), confirming the high transfection efficiency. The transfection efficiency in NIH3T3 and EMT6 cells was similar to that in LLC.
Figure 1.
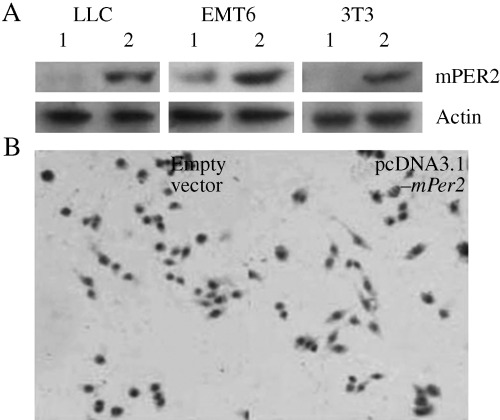
Detection of mouse Period2 (mPer2) expression by western blotting and immunohistochemistry. (A) Western blot analysis of mPER2 expression. (B) Immunohistochemistry of the pcDNA3.1(+)‐mPer2‐transfected Lewis lung carcinoma (LLC; right panel) cells and control cells (left panel). The right panel shows positive staining for mPER2.
To test the effect of mPer2 on cell growth, we carried out colony formation assays, cell growth curves and the MTT assay. mPer2 dramatically suppressed cell growth in LLC and EMT6 cells, but not in NIH 3T3 cells. The colony‐forming efficiency of mPER2 overexpressing cells (mean 10/dish for LLC cells, 8/dish for EMT6 cells) was significantly lower than in control cells (mean 56/dish in LLC cells, 49/dish in EMT6 cells) (P < 0.01) (Fig. 2A,D). Cell growth curves indicated a significant difference in cell growth speed between the two groups for both LLC and EMT6 cells (P < 0.01; Fig. 2B,E). mPer2 also exhibited a statistically significant growth‐inhibitory effect on LLC and EMT6 cells when evaluated by the MTT assay. Absorbance at 490 nm showed that mPER2 overexpression in tumor cells resulted in a significant decrease in cell growth, compared with control cells (P < 0.01) (Fig. 2C,F). In NIH 3T3 cells, there was no significant difference between the mPER2‐overexpressing cells and the control cells.
Figure 2.
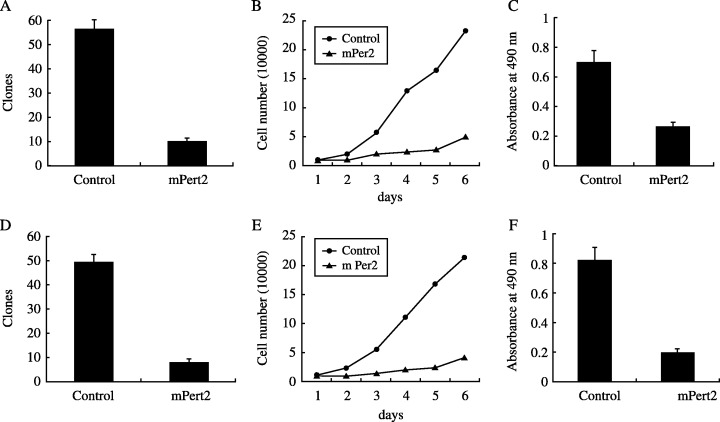
Analysis of the growth‐inhibitory effect of mouse PERIOD2 (mPER2) overexpression on (A–C) Lewis lung carcinoma cells and (D–F) EMT6 cells. (A,D) Colony formation after gene transfection. mPER2 suppressed colony formation dramatically. The colony‐forming efficiency of mPER2‐overproducing cells was significantly lower than control cells in three independent experiments (P < 0.01). (B,E) Cell proliferation assay to quantify the number of viable cells. The numbers under the horizontal axis indicate the days for cell culture. The results indicate a significant difference in cell growth speed between the two groups (P < 0.01). (C,F) Growth‐inhibitory effect of mPER2 on tumor cells detected by MTT assay. Absorbance at 490 nm showed a significant decrease in the growth of mPER2‐overproducing cells compared with vector control cells (P < 0.01).
Effects of mPER2 on cell death and apoptosis
Cell proliferation and apoptotic damage of DNA were determined by flow cytometry. The LLC and EMT6 cells overexpressing mPER2 had much higher apoptotic peaks than the vector control cells (Fig. 3). DNA from cells after gene transfection was isolated and analyzed for fragmentation into nucleosomes. DNA laddering was much more evident in mPER2‐overproducing tumor cells than in empty vector‐transfected cells (Fig. 4). There were different morphological characteristics in the cells overexpressing mPER2 compared with the control cells when studied by transmission electron microscopy. Control cells had intact membranes, organelles and normal nuclear morphology. Apoptotic cells in the pcDNA3.1(+)‐mPer2 group showed homogeneous chromatin condensation within the nucleus (Fig. 5).
Figure 3.
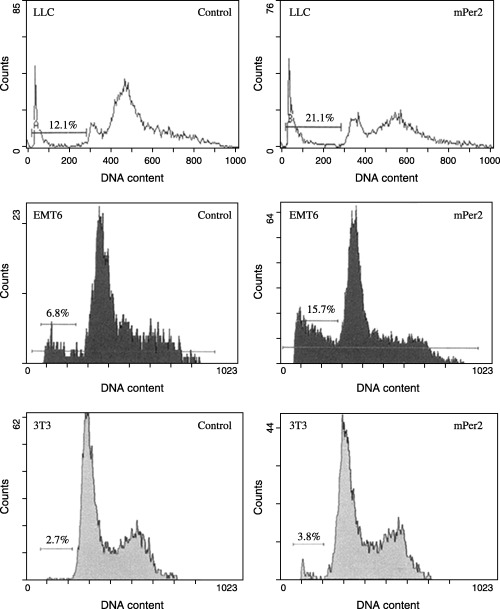
Flow cytometric analysis of apoptosis in Lewis lung carcinoma (LLC), EMT6 and NIH 3T3 cells. Horizontal and vertical axes represent DNA content and cell number, respectively. The percentage of sub‐G1 cells undergoing apoptosis is indicated (bar). The LLC and EMT6 cells overexpressing mouse PERIOD2 (mPER2) had a much higher apoptotic peak than the vector control cells.
Figure 4.
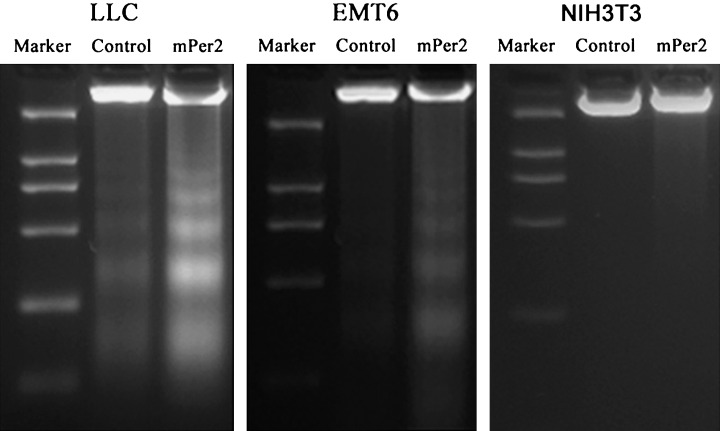
DNA was isolated and analyzed by 1.8% agarose gel electrophoresis. DNA fragmentation (laddering) was much more evident in DNA samples from mouse PERIOD2 (mPER2)‐overproducing Lewis lung carcinoma and EMT6 cells than in vector control cells. There was no difference in DNA fragmentation (laddering) between mPER2‐overproducing NIH 3T3 cells and controls.
Figure 5.
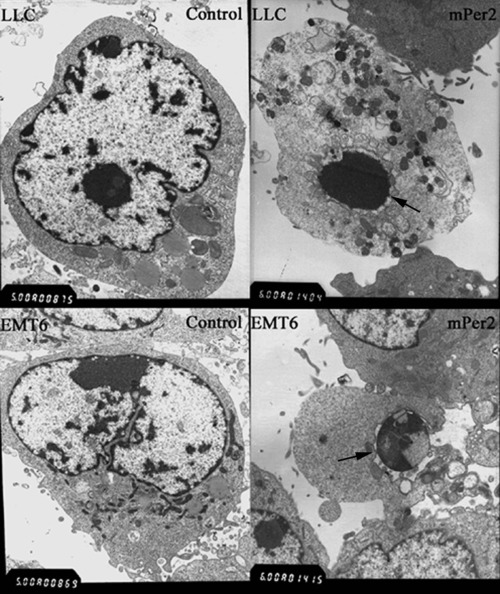
Electron microscopic evaluation of Lewis lung carcinoma and EMT6 cells. Vector control cells had intact membranes and organelles, and normal nuclear morphology. Apoptotic cells in mouse PERIOD2 (mPER2)‐overexpressing cells showed homogeneous chromatin condensation within the nucleus. Arrows indicate chromatin condensation within the nucleus. Magnification: ×6000.
Effects of mPER2 on the expression of apoptosis‐related genes
We choose LLC cells to study the mechanism underlying the tumor suppressive effects of mPer2. Details of the primers and the GenBank accession numebrs are given in Table 1. RT‐PCR analysis showed that the expression of c‐Myc, Bcl‐XL and Bcl‐2 mRNA were downregulated, whereas the expressions of p53 and Bax mRNA were upregulated in mPER2‐overexpressing LLC cells compared with vector control cells (Fig. 6A). The housekeeping gene GAPDH was used to ensure the integrity of the RNA and equality of loading.
Figure 6.
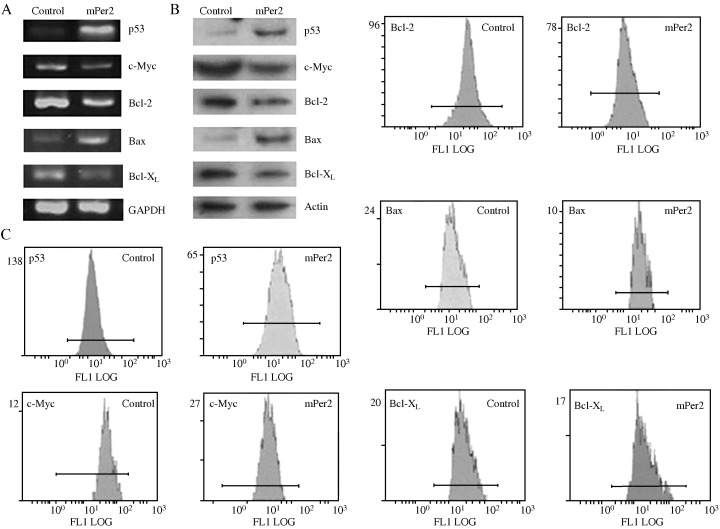
Analysis of apoptosis‐associated genes and proteins in Lewis lung carcinoma cells. (A) Reverse transcription–polymerase chain reaction (RT‐PCR) analysis of p53, c‐Myc, Bcl‐2, Bcl‐X L and Bax. (B) Western blot analysis of P53, c‐MYC, BCL‐2, BAX and BCL‐XL. (C) Flow cytometric analysis of the expression of apoptosis‐related proteins. RT‐PCR, western blot analysis and flow cytometry all demonstrated increased amounts of P53 and BAX in mouse PERIOD2 (mPER2)‐overexpressing cells than in vector control cells. In contrast, there was a decrease in BCL‐2, BCL‐XL and c‐MYC levels in mPER2‐overproducing cells, compared with control cells.
After protein normalization to actin levels, western blot analysis also demonstrated that the level of P53 in mPER2‐overexpressing cells was much higher than in vector control cells (Fig. 6B). In contrast, there was an apparent decrease in the levels of BCL‐2 and c‐MYC protein in mPER2‐overproducing cells, compared with control cells. As shown in Fig. 6, the amount of BAX protein in mPER2‐overexpressing cells tended to be higher, and the amount of BCL‐XL protein lower, than those in vector control cells. The densitometric results were used to calculate a ratio of BAX to BCL‐XL. The results revealed that the ratio was higher in mPER2‐overexpressing cells than in vector control cells.
Fluorescence signals of apoptosis‐related proteins were detected by flow cytometry in the LLC cells transfected with pcDNA3.1‐mPer2 and in control cells (Fig. 6C). The results also demonstrated increased amounts of P53 and BAX in mPER2‐overexpressing cells than in vector control cells. In contrast, there was an apparent decrease in BCL‐2, BCL‐XL and c‐MYC levels in mPER2‐overproducing cells, compared with control cells.
Effects of antisense oligonucleotides on mPER2 expression and serum starvation‐induced cell apoptosis
Reverse transcription–polymerase chain reaction analysis was carried out to detect expression of mPER2 mRNA. As shown in Fig. 7A, treatment with antisense oligonucleotides resulted in an obvious reduction in the expression of mPER2 mRNA in comparison with the controls. As demonstrated by flow cytometric analysis (Fig. 7B), the inhibition of endogenous mPer2 expression by antisense oligonucleotides prevented cells from undergoing serum starvation‐induced cell death, compared with the controls (P < 0.01).
Figure 7.
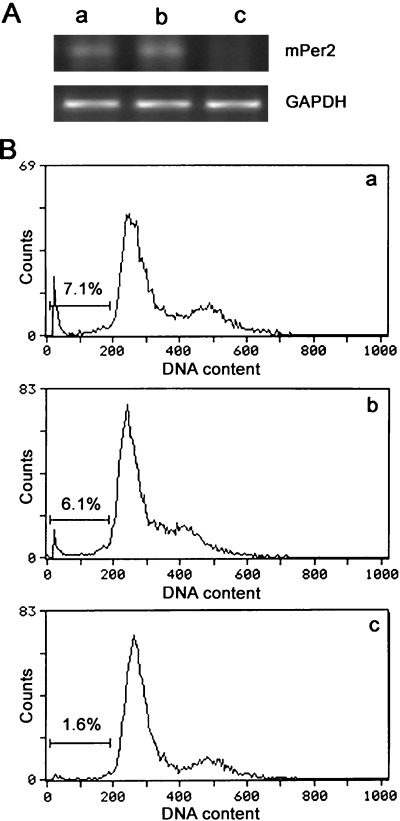
Flow cytometric analysis of serum starvation‐induced apoptosis in 12‐O‐tetradecanoyl‐phorbol‐13‐acetate (TPA)‐treated Lewis lung carcinoma (LLC) cells. (A) Suppression of mouse mPeriod2 (mPer2) expression by antisense oligonucleotides. Cells were treated with TPA to induce endogenous mPer2 expression in LLC cells. Antisense oligonucleotides were used to block mPer2 expression. mPer2 expression was detected by reverse transcription–polymerase chain reaction analysis for cells treated with: (i) TPA alone; (ii) TPA and randomized oligonucleotides; or (iii) TPA and antisense oligonucleotides. (B) Flow cytometric analysis of serum starvation‐induced apoptosis in LLC cells treated with: (i) TPA alone; (ii) TPA and randomized oligonucleotides; or (iii) TPA and antisense oligonucleotides. Horizontal and vertical axes represent DNA content and cell number, respectively. Cells in the sub‐G1 fraction (bar) were regarded as apoptotic, and their proportions are indicated. The apoptosis rate in groups i, ii and iii were 7.1, 6.1 and 1.6%, respectively.
Discussion
In the present study, the overexpression of mPER2 in mouse LLC and EMT6 cells was first described. As a core circadian gene, mPer2 has the function of not only maintaining the circadian rhythm of cells, but also sustaining the normal cell cycle. mPer2 exhibited a significant growth‐inhibitory effect on LLC and EMT6 cells, as evaluated by MTT assay, cell growth curves and cell colony‐forming assay. Several lines of evidence, including flow cytometry, DNA laddering and ultramicrostructure, consistently documented cell apoptosis in LLC and EMT6 cells. However, mPer2 overexpression neither inhibited cell growth nor induced apoptosis in NIH 3T3 cells. The inhibition of endogenous mPer2 expression by antisense oligonucleotides attenuated serum starvation‐induced cell death.
The results of the present study suggest that overexpressed mPER2 may alter the expression of apoptosis‐related genes. Recent studies have reported that approximately 7% of all clock‐controlled genes identified in rodents regulate either cell proliferation or apoptosis. These clock‐controlled genes involved in regulating the cell cycle and apoptosis include c‐Myc and the tumor suppressor p53, as well as genes that encode caspases, cyclins and transcription factors.( 10 , 11 , 19 , 22 ) The rhythmic expression of several cyclins, as well as that of the tumor suppressor p53, are synchronized with the circadian oscillation patterns of Per1 and Bmal1 expression in human oral mucosa.( 23 , 24 )
The tumor suppressor p53 is a transcription factor that is activated in response to DNA damage or oncogenic transformation. Loss of p53 in many cancers leads to impaired cell cycle regulation, genomic instability and inhibition of apoptosis.( 25 , 26 , 27 ) p53 can induce a transient arrest in G1 in cells, thus the cells have time to repair damaged DNA. Activated p53 can also eliminate cells through mechanisms involving prolonged arrest in G1 or apoptosis. The elimination of damaged, stressed or abnormally proliferating cells by p53 is considered to be the principal means by which p53 mediates tumor suppression. The levels of p53 mRNA and protein in mPER2‐overexpressing LLC cells tended to be higher than in the vector control cells. This indicated that overexpressed mPER2 induced an increase in p53 levels, which may contribute, at least in part, to apoptosis in mPER2‐overexpressing cells.
The c‐MYC oncoprotein is a transcription factor that promotes cell growth and proliferation, as well as apoptosis under certain conditions. The c‐Myc P1 promoter is suppressed directly by the core circadian regulator Bmal1, indicating that c‐Myc is a clock‐controlled gene.( 24 ) The expression of c‐Myc mRNA shows a significant increase in all mouse tissues studied in Per2 mutants. In the present study, there was an apparent decrease in c‐MYC mRNA and protein levels in mPER2‐overexpressing cells than in vector control cells. Downregulation of c‐Myc is one possible mechanism by which overexpression of mPER2 could promote apoptosis. The overexpression of mPER2 induces Bmal1 expression throughout 12:12 L : D cycles, and then increases intracellular levels of Bmal1–Npas2 or Bmal1–Clock proteins, and repression of c‐Myc. c‐Myc is demonstrated to be repressed by p53 in a number of mouse and human cell lines and mouse tissues. They provide evidence that p53 binds to the c‐Myc promoter in vivo and represses the promoter through a mechanism that involves histone deacetylation.( 28 ) Whether mPER2 downregulates c‐Myc expression in a p53‐dependent manner or not warrants further investigation.
Recent studies suggest that cytosolic p53 may interact directly with members of the Bcl‐2 family of apoptosis regulators, thereby triggering mitochondrial outer membrane permeabilization and apoptosis. The Bcl‐2 family of proteins is a key regulator of the mitochondrial response to apoptotic signals in the intrinsic pathway. The Bcl‐2 gene family comprises more than 20 different members that regulate apoptosis either positively or negatively.( 29 , 30 ) It includes antiapoptotic Bcl‐2 members, such as Bcl‐2, Bcl‐XL, Bcl‐W and Mcl‐1, acting as potent suppressors of apoptosis by blocking the release of cytochrome c. Whereas proapoptotic members, such as Bax, Bak, Bad, Bcl‐Xs, Bid, Bik, Bim and Hrk, act as promoters that have opposing functions and promote cell death, the pro‐apoptotic proteins Bax, Bak and Bid translocate to the mitochondria with apoptotic stimuli. The ratio of antiapoptotic‐to‐proapoptotic molecules determines the response to a death signal.
In the present study, we checked the expression of BCL‐2, BAX, BCL‐XL and the ratio of BAX to BCL‐XL. As shown in Fig. 6, the levels of BAX mRNA and protein were increased significantly in mPER2‐overexpressing cells compared with vector control cells. In contrast, we showed an apparent decrease in the mRNA and protein levels of BCL‐2 in mPER2‐overexpressing cells compared with vector control cells. The mRNA and protein levels of BCL‐XL were decreased significantly in mPER2‐overexpressing cells compared with vector control cells. The mean values for the Bax : Bcl‐XL mRNA ratios were higher in mPER2‐overexpressing cells than in vector control cells. Western blot analysis also demonstrated an increased ratio of BAX to BCL‐XL in mPER2‐overexpressing cells, compared with control cells. These may be involved in the effect of mPER2 on apoptosis.
In summary, overexpression of mPER2 results in reduced cellular proliferation and rapid apoptosis in tumor cells, but not in NIH 3T3 cells. Overexpressed mPER2 alters the expression of apoptosis‐related genes and regulates the expression of proteins involved directly or indirectly in apoptosis. In addition to p53‐dependent apoptosis, there may be other mechanisms by which overexpressed mPER2 induces apoptosis. The exact character of the tumor‐associated death pathway activated by mPER2 still needs to be studied. An important clue to the nature of this apoptotic pathway may come from results showing that mPER2 preferentially kills tumorigenic cells but not non‐tumorigenic NIH 3T3 cells, indicating that tumor‐specific client proteins with which mPER2 interacts may be required for initiating the programmed cell death. Other circadian regulators may also play a similar role in tumor suppression. Cancer should no longer be treated as a local disorder, but a general disorder regulated by the circadian clock. Future research should be focused on studying the detailed mechanisms by which the circadian clock controls genes related to cell proliferation and apoptosis.
Acknowledgments
We thank Professor Steven Reppert (University of Massachusetts Medical School, USA) for providing the eukaryotic expression vector pcDNA 3.1‐mPer2. This work was supported by the National Nature Science Foundation of China (no. 30470623 for Z. Wang, no. 30470684 for C. Wan) and the Chinese Medical Board of New York (Z. Wang).
References
- 1. Reppert SM, Weaver DR. Coordination of circadian timing in mammals. Nature 2002; 418: 935–41. [DOI] [PubMed] [Google Scholar]
- 2. Morse D, Sassone‐Corsi P. Time after time: inputs to and outputs from the mammalian circadian oscillators. Trends Neurosci 2002; 25: 632–7. [DOI] [PubMed] [Google Scholar]
- 3. Czeisler CA, Duffy JF, Shanahan TL et al. Stability, precision, and near‐24‐hour period of the human circadian pacemaker. Science 1999; 284: 2177–81. [DOI] [PubMed] [Google Scholar]
- 4. Panda S, Antoch MP, Miller BH et al. Coordinated transcription of key pathways in the mouse by the circadian clock. Cell 2002; 109: 307–20. [DOI] [PubMed] [Google Scholar]
- 5. Storch KF, Lipan O, Leykin I et al. Extensive and divergent circadian gene expression in liver and heart. Nature 2002; 417: 78–83. [DOI] [PubMed] [Google Scholar]
- 6. Delaunay F, Laudet V. Circadian clock and microarrays: mammalian genome gets rhythm. Trends Genet 2002; 18: 595–7. [DOI] [PubMed] [Google Scholar]
- 7. Bjarnason GA, Jordan R. Circadian variation of cell proliferation and cell cycle protein expression in man: clinical implications. Prog Cell Cycle Res 2000; 4: 193–206. [DOI] [PubMed] [Google Scholar]
- 8. Matsuo T, Yamaguchi S, Mitsui S, Emi A, Shimoda F, Okamura H. Control mechanism of the circadian clock for timing of cell division in vivo . Science 2003; 302: 255. [DOI] [PubMed] [Google Scholar]
- 9. Smaaland R, Lote K, Sothern RB, Laerum OD. DNA synthesis and ploidy in non‐Hodgkin's lymphomas demonstrate intrapatient variation depending on circadian stage of cell sampling. Cancer Res 1993; 53: 3129–38. [PubMed] [Google Scholar]
- 10. Duffield GE, Best JD, Meurers BH, Bittner A, Loros JJ, Dunlap JC. Circadian programs of transcriptional activation, signaling, and protein turnover revealed by microarray analysis of mammalian cells. Curr Biol 2002; 12: 551–7. [DOI] [PubMed] [Google Scholar]
- 11. Kornmann B, Preitner N, Rifat D, Fleuury‐Olela F, Schibler U. Analysis of circadian liver gene expression by ADDER, a highly sensitive method for the display of differentially expressed mRNAs. Nucl Acids Res 2001; 29: E51. [DOI] [PMC free article] [PubMed] [Google Scholar]
- 12. Le Minh N, Damiola F, Tronche F, Schutz G, Schibler U. Glucocorticoid hormones inhibit food‐induced phaseshifting of peripheral circadian oscillators. EMBO J 2001; 20: 7128–36. [DOI] [PMC free article] [PubMed] [Google Scholar]
- 13. Chen ST, Choo KB, Hou MF, Yeh KT, Kuo SJ, Chang JG. Deregulated expression of the PER1, PER2 and PER3 genes in breast cancers. Carcinogenesis 2005; 26: 1241–6. [DOI] [PubMed] [Google Scholar]
- 14. Filipski E, King VM, Li X et al. Host circadian clock as a control point in tumor progression. J Natl Cancer Inst 2002; 94: 690–7. [DOI] [PubMed] [Google Scholar]
- 15. Dunlap JC. Molecular bases for circadian clocks. Cell 1999; 96: 271–90. [DOI] [PubMed] [Google Scholar]
- 16. Zheng B, Albrecht U, Kaasik K et al. Nonredundant roles of the mPer1 and mPer2 genes in the mammalian circadian clock. Cell 2001; 105: 683–94. [DOI] [PubMed] [Google Scholar]
- 17. Bae K, Jin X, Maywood ES, Hastings MH, Reppert SM, Weaver DR. Differential functions of mPer1, mPer2, and mPer3 in the SCN circadian clock. Neuron 2001; 30: 525–36. [DOI] [PubMed] [Google Scholar]
- 18. Lee CC. The circadian clock and tumor suppression by mammalian period genes. Meth Enzymol 2005; 393: 852–61. [DOI] [PubMed] [Google Scholar]
- 19. Fu L, Pelicano H, Liu J, Huang P, Lee C. The circadian gene Period2 plays an important role in tumor suppression and DNA damage response in vivo . Cell 2002; 111: 41–50. [DOI] [PubMed] [Google Scholar]
- 20. Wakamatsu H, Takahashi S, Moriya T et al. Additive effect of mPer1 and mPer2 antisense oligonucleotides on light‐induced phase shift. Neuroreport 2001; 12: 127–31. [DOI] [PubMed] [Google Scholar]
- 21. Akashi M, Nishida E. Involvement of the MAP kinase cascade in resetting of the mammalian circadian clock. Genes Dev 2000; 14: 645–9. [PMC free article] [PubMed] [Google Scholar]
- 22. Akhtar RA, Reddy AB, Maywood ES et al. Circadian cycling of the mouse liver transcriptome, as revealed by cDNA microarray, is driven by the suprachiasmatic nucleus. Curr Biol 2002; 12: 540–50. [DOI] [PubMed] [Google Scholar]
- 23. Bjarnason GA, Jordan RC, Sothern RB. Circadian variation in the expression of cell‐cycle proteins in human oral epithelium. Am J Pathol 1999; 154: 613–22. [DOI] [PMC free article] [PubMed] [Google Scholar]
- 24. Bjarnason GA, Jordan RC, Wood PA et al. Circadian expression of clock genes in human oral mucosa and skin: association with specific cell‐cycle phases. Am J Pathol 2001; 158: 1793–801. [DOI] [PMC free article] [PubMed] [Google Scholar]
- 25. Benchimol S. p53‐dependent pathways of apoptosis. Cell Death Differ 2001; 8: 1049–51. [DOI] [PubMed] [Google Scholar]
- 26. Yu J, Wang Z, Kinzler KW, Vogelstein B, Zhang L. PUMA mediates the apoptotic response to p53 in colorectal cancer cells. Proc Natl Acad Sci USA 2003; 100: 1931–6. [DOI] [PMC free article] [PubMed] [Google Scholar]
- 27. Ghobrial IM, Witzig TE, Adjei AA. Targeting apoptosis pathways in cancer therapy. CA Cancer J Clin 2005; 55: 178–94. [DOI] [PubMed] [Google Scholar]
- 28. Ho J, Ma W, Mao D, Benchimol S. p53‐dependent transcriptional repression of c‐myc is required for G1 cell cycle arrest. Mol Cellular Biol 2005; 25 (17): 7423–31. [DOI] [PMC free article] [PubMed] [Google Scholar]
- 29. Cory S, Adams JM. The Bcl2 family: regulators of the cellular life‐or‐death switch. Nat Rev Cancer 2002; 2: 647–56. [DOI] [PubMed] [Google Scholar]
- 30. Liou AKF, Clark RS, Henshall DC, Yin XM, Chen J. To die or not to die for neurons in ischemia, traumatic brain injury and epilepsy: a review on the stress activated signaling pathways and apoptotic pathways. Prog Neurobiol 2003; 69: 103–42. [DOI] [PubMed] [Google Scholar]


