

Abstract
Because infection and immune responses have been implicated in the pathogenesis of Tourette Syndrome (TS), we hypothesized that children with TS would have altered gene expression in blood compared to controls. In addition, because TS symptoms in childhood vary with age, we tested whether gene expression changes that occur with age in TS differ from normal control children. Whole blood was obtained from 30 children and adolescents with TS and 28 healthy children and adolescents matched for age, race and gender. Gene expression (RNA) was assessed using whole genome Affymetrix microarrays. Age was analyzed as a continuous covariate and also stratified into three groups: 5-9 (common age for tic onset), 10-12 (when tics often peak), and 13-16 (tics may begin to wane). No global differences were found between TS and controls. However, expression of many genes and multiple pathways differed between TS and controls within each age group (5-9, 10-12, and 13-16), including genes involved in the immune-synapse, and proteasome- and ubiquitin- mediated proteolysis pathways. Notably, across age strata, expression of interferon response, viral processing, Natural Killer and cytotoxic T-lymphocyte cell genes differed. Our findings suggest age-related interferon, immune and protein degradation gene expression differences between TS and controls.
Keywords: Tourette syndrome, Tics, Viral infections, PANDAS, Gene expression
1. Introduction
Tourette syndrome (TS), characterized by motor and vocal tics present for greater than one year, often shows distinct age effects, with symptom onset between ages 5-9, most severe tics between 10-12, and waning tics in early adulthood (Leckman et al., 1998). This suggests complex age-related changes in TS pathogenesis.
Growing numbers of studies suggest immune abnormalities associated with TS [see review (Hoekstra et al., 2004)]. These include autoimmune responses, altered cytokine profiles [see reviews (Dale, 2003; Hoekstra et al., 2004; Martino & Giovannoni, 2005)] and correlations of inflammatory mediators with symptom exacerbation (Leckman et al., 2005). Age-related changes in tic severity (Leckman et al., 1998) suggest immune-associated gene expression in TS might vary with age if the immune system is involved in the disease process.
Gene expression analysis of whole blood using microarrays allows assessment of genome-wide expression changes and pathway dysregulation (Sharp et al., 2006), and might be useful for identifying immune-mediated and genetic mechanisms underlying Tourette syndrome (Tang et al., 2005). In a previous pilot study of children and adults with TS compared to age-matched controls, using two types of statistical analyses, we assessed whole blood gene expression and found altered expression of immune-related genes primarily associated with Natural Killer Cells (NK), the major cell type involved in the rapid, innate immune response to viral and other infections (Lit et al., 2007; Tang et al., 2005). Previous studies were limited by 1) use of older gene expression technology, 2) small sample size, and 3) use of a healthy control group that was not specifically recruited to match for age, sex, and race.
The present study is larger, includes carefully matched cases and controls, and uses Affymetrix U133-Plus 2 expression microarrays. This allows for a more generalizable and valid case-control comparison. In addition, we could begin to assess whether changes in blood gene expression might vary with age in TS. This is critical because if immune abnormalities contribute to symptoms in some TS patients, this might be more or less evident at different stages of this developmental disorder.
2. Methods
2.1. Participants
Twenty-eight healthy subjects (normal controls, NC) (21 male, mean age 11.4 years and 7 female, mean 11.4 years) and 30 subjects with Tourette syndrome (TS) (23 male, mean age 11.4 years and 7 female, mean 11.7 years) were enrolled in this study (Table 1). All subjects were between ages 5 through 16 at the time of study and were not febrile or reported any acute illness at the time of the blood draw. TS subjects were recruited from the Tourette Syndrome Clinic at Cincinnati Children’s Hospital Medical Center. Diagnoses of TS, as well as of attention-deficit hyperactivity disorder (ADHD) (15/30) and OCD (16/30) were based on Diagnostic and Statistical Manual of Mental Disorders, Fourth Edition criteria (A.P.A., 2000). Each TS subject’s symptoms were rated using direct child and parent interview using the Yale Global Tic Severity Scale (YGTSS) (Leckman et al., 1989), the DuPaul ADHD rating scale (ADHDRS) (DuPaul et al., 1998), and the Child Yale-Brown OCD Scale (CYBOCS) (Scahill et al., 1997). The healthy controls were recruited (by DLG) from schools in the Cincinnati area that were demographically similar to those from which the children with TS originated. For each TS case, a NC matched for age within 2 years, gender, and race was recruited. Children with any neurological, psychiatric, or developmental diagnosis made by a physician were excluded, based on parent interview. Blood from these healthy controls was obtained and processed using identical methods to those used for the TS subjects. The protocols were approved by the institutional review boards at the Cincinnati Children’s Hospital Medical Center and the University of California at Davis. Informed consent was obtained from the parent or legal guardian of each participant.
Table 1.
Demographics and diagnoses.
| Variable | Tourette’s (TS) | Controls (NC) |
|---|---|---|
| Males (%) | 23 (77%) | 21 (75%) |
| Age Group 5-9 (%) | 6 (20%) | 7 (25%) |
| Age Group 10-12 (%) | 13 (43%) | 11 (39%) |
| Age Group 13-16 (%) | 11 (37%) | 10 (36%) |
| Diagnoses (%) | ||
| TS + OCD + ADHD | 10 (33%) | N/A |
| TS + ADHD | 5 (17%) | N/A |
| TS + OCD | 6 (20%) | N/A |
| TS | 9 (30%) | N/A |
| Medications used (%) | ||
| SSRI | 9 (30%) | N/A |
| A2A | 8 (27%) | N/A |
| NLEP | 7 (23%) | N/A |
| STIM | 4 (13%) | N/A |
| ADHDRx | 6 (20%) | N/A |
| Yale Global Tic Severity score mean (range) | 14 (0-30) | N/A |
| ADHD Rating Scale mean (range) | 21.3 (0-52) | N/A |
| Children’s Yale-Brown Obsessive-Compulsive Scale mean (range) | 6.4 (0-30) | N/A |
| Totals | 30 (100%) | 28 (100%) |
TS: Tourette’s syndrome; ADHD: attention deficit hyperactivity disorder; OCD: obsessive-compulsive disorder; SSRI: selective serotonin reuptake inhibitor; A2A: alpha-2 adrenergic agonists; NLEP: neuroleptics; STIM: stimulants; ADHDRx: ADHD medications other
2.2. Sample processing and array hybridization
Fifteen milliliters of blood was collected via antecubital fossa venipuncture into six PAXgene vacutainer tubes (PreAnalytiX, Germany), which immediately stabilize RNA and thus reduce RNA degradation. Tubes were frozen at −70°C until the total RNA was isolated using the Paxgene blood RNA kit (PreAnalytiX, Germany) according to the manufacturer’s instructions.
Sample labeling, hybridization to chips, and image scanning were performed using standard Affymetrix protocols (Affymetrix Expression Analysis Technical Manual). Gene expression was assessed on the human U133 Plus 2.0 GeneChip (Affymetrix, Santa Clara, CA), a single oligonucleotide microarray that surveys over 54,000 transcript sequences (probes). Samples were processed in four separate batches.
2.3. Probe-level data analysis
Raw expression values (probe level data) were imported into GENESPRING 7.2 software (Agilent Technologies, Palo Alto, CA) and processed using GC-RMA (Bolstad et al., 2003; Wu et al., 2004), followed by a three-step normalization (data transformation, per chip normalization, and per gene normalization) (Genespring, 2004). Probes with an expression value greater than 1 for at least one sample were analyzed (39,634 probes) (Figure 1). Statistical analyses, principal components analysis, and unsupervised clustering analyses were performed with Partek Genomics Suite 6.3 beta (Partek Inc., St. Louis, MO) and GENESPRING 7.2.
Figure 1.
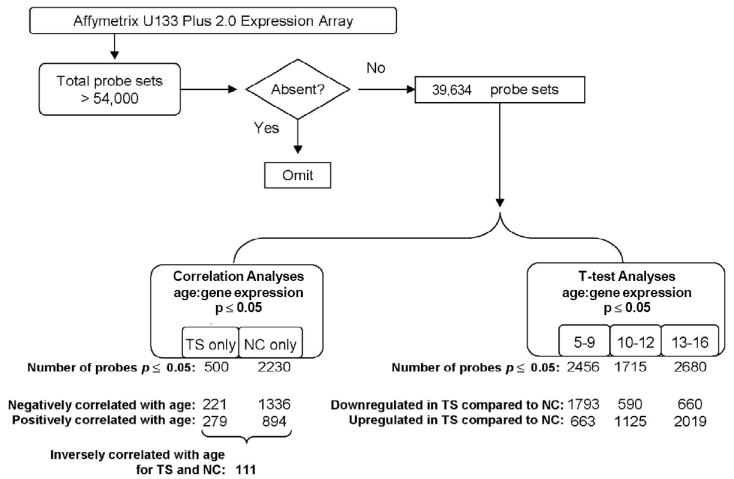
Analysis Algorithm. After excluding absent probe sets (probes with fluorescent values < 1; see Methods), two groups of statistical analyses were performed on the remaining 39,665 probes: (1) Correlation Analyses: Gene expression correlated with age for Tourette syndrome (TS), and gene expression correlated with age for normal controls (NC); and (2) T-test Analyses: mean difference in gene expression for TS vs NC, stratified by age group (5-9 years old, 10-12 years old, 13-16 years old). For all analyses, total number of probes significant at p ≤ 0.05 for each resulting probe list are shown. For Correlation Analyses, numbers of probes negatively and positively correlated with age are shown; for T-test Analyses, numbers of probes up regulated in TS compared to NC or down regulated in TS compared to NC are shown. For the correlation analyses, 111 probes were inversely correlated with age for TS and NC.
The Database for Annotation, Visualization and Integrated Discovery (DAVID, http://niaid.abcc.ncifcrf.gov/) was used to determine co-regulation of Kyoto Encyclopedia of Genes and Genomes (KEGG) gene pathways (Dennis et al., 2003; Hosack et al., 2003). DAVID calculates a modified Fisher Exact test score using the Expression Analysis Systematic Explorer (EASE) program (EASE score) to measure gene-enrichment indicating over representation within pathways and chromosomes, potentially indicating co-regulation of those genes greater than expected by chance, and suggesting functional modulation of that pathway. Parameters used for significance for DAVID annotations on pathways and chromosomes were count threshold = 2 (minimum number of genes for the corresponding term) and EASE threshold = 0.1 (maximum EASE score/p-value). DAVID pathway and chromosome results were complemented with literature review to identify non-represented pathways or expand findings within pathways.
Additional statistical computations were performed with XLSTAT 2006.2 (Addinsoft, http://www.xlstat.com/) and stastiXL 1.6 (statistiXL, http://www.statistiXL.com, 2006).
2.4. Statistical Analyses
2.4.1. False discovery rates (FDR)
No probes survived the stringent p-value required for multiple comparison correction when testing over 39,000 probes (FDR 0.05: 1.3e-006; FDR 0.1: 2.5e-006). We utilized a pathway and chromosome over-representation approach as an alternate means to identify potentially important, functionally related groups of genes (Feng et al., 2007). In order to optimize discovery of pathway and chromosome over-representation patterns, results were not further filtered according to any fold change criteria. Each analysis also removed batch effects to adjust for gene expression differences arising from array processing in multiple batches.
2.4.2. TS vs. Controls
To detect any profound gene expression differences intrinsic to the TS diagnosis and without much variation during development, between-group gene expression profiles for TS vs. NC patients were compared using analysis of variance (ANOVA). Multivariate analyses (unsupervised hierarchical clustering and principal components analysis (PCA)) were applied to evaluate relationships between TS and NC determined by these probes.
2.4.3. Age Analyses
Both immunological and neurological systems develop in childhood through a complex cascade of pathways in which genetic and gene-environment interactions trigger changes in gene expression pathways. Thus, in our cohort, an approach was required which allowed us to evaluate expression pathways in normal childhood but also to understand how these pathways might diverge in a childhood disrupted by TS. In addition, clinically, TS is a dynamic disorder with many non-linear changes in symptoms during childhood and adolescence. Tics may emerge in early childhood but not peak for several years, then may diminish in the late teens. Thus, to delineate age-related effects, two separate types of statistical analyses were performed: (1) Correlation Analyses and (2) T-test Analyses (Figure 1). These approaches are complementary and provide a more complete picture of how gene expression varies by age in TS compared to NC.
2.4.4. Correlation analyses
were performed to detect genes whose expression showed a significant, linear relationship with age (coded as a continuous variable). Separate Pearson correlations (r) were done to identify probes that correlate significantly with age for NC (p = 0.05) and for TS (p = 0.05) (Figure 1, Supplemental Tables S1 and S2). To test whether the differences in numbers of genes increasing with age and numbers of genes decreasing with age exceed what would be expected by chance, a chi-square test was performed. Because correlations of expression levels with age are not independent events but represent genes that are co-regulated, probes identified were further analyzed based on direction of correlation, membership in functional pathways, and chromosomal representation.
2.4.5. T-test Analyses
were performed to identify mean differences between TS and NC in three biologically meaningful periods, within age strata 5-9, 10-12, and 13-16. Dependent samples t-tests within each age group were performed using 52 subjects (26 pairs), setting p ≤ 0.05 (Figure 1, Supplemental Tables S3, S4, S5). Six subjects were not included in this analysis because they could not be appropriately paired.
2.5. Analysis of previously identified genes
Previously, using the Affymetrix U95A expression microarray, we identified a group of genes that separated a subgroup of TS patients from age-matched subjects with other neurological disorders (Lit et al., 2007; Tang et al., 2005). Analogous probes for the current study using the Affymetrix U133-Plus 2 expression microarray were identified using the Affymetrix Netaffx analysis webtool (https://www.affymetrix.com/site/login/login.affx). Probe lists were then examined for the presence of analogous probes. Analogous probes found within the current study were subjected to multivariate analyses (unsupervised clustering and principal components analysis) to evaluate relationships between TS and NC determined by these probes.
3. Results
3.1. Subject characteristics
There was no significant difference in age between NC and TS [t(56) = 0.100, p > 0.05].
3.2. TS vs Controls, global comparison independent of age
For TS vs NC, there were 46 probes identified with fold change > |1.5|. However, unsupervised hierarchical clustering and principal components analysis showed that these probes could not separate TS subjects from NC subjects.
3.3. Correlation of gene expression with age
Using p< 0.05 as significant, we would expect random chance correlations to occur between age and gene expression for ~1,983 gene probes (39,634 available gene probes*0.05) for both TS and NC. There were a total of 2230 genes in NC controls and 500 in TS patients that exhibited linear correlations with age at the p<0.05 level (Figure 1, Supplemental Tables S1 and S2). Thus the total number of correlations does not exceed the number we would expect to see by chance. However, these age-correlated probes do not occur randomly throughout the genome, but rather belong to significantly enriched pathways that differ for NC and TS (Figure 2, Table 2).
Figure 2.

Venn Diagram illustrating numbers of significant pathways identified by DAVID (count threshold = 2, EASE threshold = 0.1) for Correlation Analyses probe lists: correlation of gene expression with age for normal controls (NC) (left circle) and correlation of gene expression with age for Tourette syndrome (TS) (right circle). Nine pathways are over represented by probes identified for correlation of gene expression with age for NC, with 8 pathways unique to NC and 1 pathway also over represented in TS. Four pathways are over represented by probes identified for correlation of gene expression with age for TS, with 3 pathways unique to TS and 1 pathway also over represented in NC.
Table 2.
Kyoto Encyclopedia of Genes and Genomes (KEGG) pathways over represented by correlation analyses of age with gene expression for Normal Controls (NC) and Tourette syndrome (TS)
| KEGG Pathways Over Represented by Correlation of Age with Gene Expression in Normal Controls | Number of probes | p value |
|---|---|---|
| ONE CARBON POOL BY FOLATE | 5 | 0.0570 |
| DORSO-VENTRAL AXIS FORMATION | 7 | 0.0659 |
| HUNTINGTON’S DISEASE@ | 8 | 0.0130 |
| UBIQUITIN MEDIATED PROTEOLYSIS@ | 12 | 0.0024 |
| ADHERENS JUNCTION@ | 13 | 0.0699 |
| T CELL RECEPTOR SIGNALING PATHWAY | 15 | 0.0692 |
| INSULIN SIGNALING PATHWAY | 20 | 0.0688 |
| NATURAL KILLER CELL MEDIATED CYTOTOXICITY | 22 | 0.0110 |
| MAPK SIGNALING PATHWAY* | 35 | 0.0620 |
| KEGG Pathways Over Represented by Correlation of Age with Gene Expression in Tourette Syndrome | Number of probes | p value |
| NITROGEN METABOLISM | 3 | 0.0883 |
| NOTCH SIGNALING PATHWAY | 4 | 0.0856 |
| HEPARAN SULFATE BIOSYNTHESIS | 4 | 0.0129 |
| MAPK SIGNALING PATHWAY* | 13 | 0.0159 |
pathway over represented by both correlation analyses;
pathway over represented by correlation analysis and t-test analysis
Similarly, we would expect, by chance, that ~ 200 gene probes would demonstrate inverse correlations (positive age/expression correlation for TS AND negative age/expression correlation for NC = 39,634*0.05*0.05 = 99; OR negative TS/positive NC = 99). There were a total of 111 probes whose expression demonstrated inverse relationships between TS and NC (Supplemental Table S6), which again does not exceed the number we would expect to see by chance. However, these probes also did not appear to occur randomly throughout the genome but rather belonged to interferon (IFN) regulation and downstream activation of related viral, interferon, and proteasome pathways (Supplemental Table S7). Moreover, 52 of the 111 are located on five chromosomes (chromosomes 1, 2, 12, 17, and 22) (Supplemental Table S8), which differ from a uniform distribution across all chromosomes [Log-Likelihood (20)=37.122, p=0.01; single probe counts for chromosomes 5, 10, and 11 were pooled]. 82 of 111 probes increased with age in TS but decreased in NC; the remaining 29 probes showed the opposite relationship (e.g. Figure 3).
Figure 3.

Representative correlations between age and gene expression, shown for Tourette syndrome (TS) (dark blue) and normal control (NC) (red) subjects, demonstrating inverse correlation of expression with age. (A) Inverse correlation of gene expression with age for Beta-Adrenergic Receptor Kinase 2 in TS (blue) compared to NC (red) subjects. (B) Inverse correlation of gene expression with age for Huntingtin-Associated Protein for TS (blue) compared to NC (red) subjects.
The 111 probes were over represented on chromosomes 22 (DAVID p = 1.5E-4) and 17 (DAVID p = 3.7E-2). All probes on chromosome 22 (11 probes representing 10 genes) were located within the 22q11-q13 region. Six of 11 probes (6 of 10 genes, 60%) located on chromosome 17 were located in the region 17q21-17q25 region. Two notable genes identified in this analysis that could be related TS pathogenesis were beta-adrenergic receptor kinase 2 (ADRBK2, 22q11.23-q12.1) and huntingtin-associated protein 1 (HAP1, 17q21.2-q21.3) (Figure 3).
3.4. Differences in gene expression by age group
As described above, using p< 0.05 as significant, we would expect random chance significance of t-tests for ~1,983 gene probes (39,634 available gene probes*0.05) for each analysis. There were a total of 2456, 1715, and 2680 probes significant at p<0.05 for age group comparisons 5-9, 10-12, and 13-16 respectively (Figure 1, Supplemental Tables S3, S4, and S5). Thus the total number of significant probes exceeds that expected by chance for age groups 5-9 and 13-16. However, as with the correlation analyses, these probes do not occur randomly throughout the genome. They belong to significantly enriched pathways that differ for each age group (Figure 4, Table 3).
Figure 4.

Venn Diagram illustrating numbers of significant pathways identified by DAVID (count threshold = 2, EASE threshold = 0.1) for T-test Analyses probe lists: age 5-9 (left circle); age 10-12 (right circle); age 13-16 (bottom circle). Age 5-9 has 14 total pathways over represented, with 12 pathways unique to this age group, 1 pathway also over represented by age 10-12, and 1 pathway also over represented by age 13-16. Similarly, age 13-16 has 14 total pathways over represented, with 12 pathways unique to this age group, 1 pathway shared with age 5-9, and 1 pathway also over represented by age 10-12. Age 10-12 has 3 total pathways over represented by this age group, with 1 pathway also over represented by age 5-9 and 1 pathway also over represented by age 13-16. Note that no pathways are shared by all groups.
Table 3.
KEGG pathways over represented by t-test analyses comparing Tourette syndrome (TS) with Normal Controls (NC) by age group: 5-9, 10-12 and 13-16 years old.
| KEGG Pathways Overrepresented for T-test Analysis of Tourette Syndrome vs Normal Controls, Age Group 5-9 | Number of probes | p value |
|---|---|---|
| FATTY ACID ELONGATION IN MITOCHONDRIA | 5 | 1.70E-02 |
| HUNTINGTON’S DISEASE @ | 8 | 2.60E-02 |
| NEURODEGENERATIVE DISORDERS | 9 | 3.00E-02 |
| PROTEASOME * | 10 | 4.30E-03 |
| TYPE I DIABETES MELLITUS | 10 | 2.10E-02 |
| FATTY ACID METABOLISM | 10 | 8.50E-02 |
| BENZOATE DEGRADATION VIA CoA LIGATION | 11 | 4.40E-02 |
| LONG-TERM POTENTIATION | 15 | 7.20E-03 |
| B CELL RECEPTOR SIGNALING PATHWAY | 15 | 8.30E-03 |
| ADHERENS JUNCTION @ | 15 | 3.10E-02 |
| GAP JUNCTION | 16 | 9.00E-02 |
| PHOSPHATIDYLINOSITOL SIGNALING SYSTEM | 17 | 5.50E-02 |
| RIBOSOME * | 23 | 8.50E-03 |
| WNT SIGNALING PATHWAY | 27 | 6.60E-03 |
| KEGG Pathways Over represented for T-test Analysis of Tourette Syndrome vs Normal Controls, Age Group 10-12 | Number of probes | p value |
| BASAL TRANSCRIPTION FACTORS | 8 | 2.10E-02 |
| UBIQUITIN MEDIATED PROTEOLYSIS *@ | 10 | 1.30E-02 |
| RIBOSOME * | 38 | 4.90E-13 |
| KEGG Pathways Overrepresented for T-test Analysis of Tourette Syndrome vs Normal Controls, Age Group 13-16 | Number of probes | p value |
| PHENYLALANINE, TYROSINE AND TRYPTOPHAN BIOSYNTHESIS | 5 | 3.30E-02 |
| GLYOXYLATE AND DICARBOXYLATE METABOLISM | 5 | 6.00E-02 |
| REDUCTIVE CARBOXYLATE CYCLE (CO2 FIXATION) | 7 | 7.70E-04 |
| ONE CARBON POOL BY FOLATE | 8 | 1.40E-03 |
| PROPANOATE METABOLISM | 10 | 3.10E-02 |
| VALINE, LEUCINE AND ISOLEUCINE DEGRADATION | 12 | 5.70E-02 |
| CITRATE CYCLE (TCA CYCLE) | 13 | 2.40E-05 |
| LYSINE DEGRADATION | 13 | 6.60E-02 |
| AMINOACYL-tRNA SYNTHETASES | 14 | 3.50E-05 |
| PROTEASOME * | 17 | 7.30E-08 |
| UBIQUITIN MEDIATED PROTEOLYSIS *@ | 17 | 4.30E-05 |
| PYRIMIDINE METABOLISM | 17 | 8.30E-02 |
| CELL CYCLE | 26 | 1.20E-03 |
| OXIDATIVE PHOSPHORYLATION | 30 | 1.60E-04 |
pathway over represented by more than one t-test analysis;
pathway over represented by correlation analysis and t-test
Between group comparisons for TS compared to NC subjects, stratified by age, showed the 5-9 age group is more likely to have down regulated probes, while the 10-12 and 13-16 age groups are more likely to have upregulated probes (Figure 1, Supplemental Tables S3, S4, S5).
3.4.1. Biological Pathways by Age Group and Diagnosis
The TS vs NC comparisons for each age group yielded over representation of different sets of biological pathways (Figure 4, Table 3). This suggests activation of different functional pathways associated with age in TS compared to NC subjects.
3.5. Correlation and dependent t-test overlap
DAVID identified three pathways involved in the interferon-mediated inflammatory response that were over-represented by at least one correlation analysis and at least one dependent t-test probe list (noted by “@” in Tables 2 and 3). Additionally, the same chromosomes were generally over represented by both the correlation and the t-test analyses (Figure 5). This strongly suggests that these are robust findings independent of the statistical approaches used; i.e., consistent biological effects, concentrated on eight chromosomes, found for both correlation differences and age-stratified mean differences between TS and NC (Figure 5).
Figure 5.

Significant probes identified within correlation analyses and t-test analyses show similar distributions across chromosomes. Table shows significant enrichment for genes (number of probe sets, Y axis) as identified by DAVID (count threshold = 2, EASE threshold = 0.1) on chromosome numbers 1-22 (X axis). (A) Correlation analyses of gene expression with age for normal controls (NC) (white bars) and Tourette Syndrome (TS) (black bars) probe lists. (B) T-test analyses for the three age groups: ages 5-9, white bars; ages 10-12, black bars; ages 13-16, red bars. X-axis shows chromosomes 1 to 22. Y-axis shows the number of probes located on each chromosome. No significant enrichment was detected on the X or Y chromosomes (not shown).
3.6. Presence of previously identified genes
Expression of 7 probes, representing 6 genes analogous to those previously found differentially expressed in TS compared to controls (Lit et al., 2007), was also significantly different in this study between TS and NC for the 10-12 age group (Table 4). As in the previous study (Lit et al., 2007), these genes showed increased expression for TS compared to NC (Figure 6; Table 4). A genes (Pearson correlation, p ≥ 0.95)-by-samples (smooth correlation, p ≥ 0.95) unsupervised cluster using these 7 probes demonstrates good separation of TS from NC (Figure 7A). Using these seven genes as input, a Principal Component Analysis using the correlation between conditions and each principal component vector (Genespring, 2004) was performed (Dai et al., 2006) to indicate gene expression patterns for this group of 7 genes across TS and control subjects (Figure 7B). The first three principal components (eigenvectors) accounted for 90.4% of the variance in expression of these seven genes in the 24 samples in the 10-12 age group. The PCA demonstrates that the diagnosis of TS is significantly associated with increased expression of these genes (Fisher’s Exact Test, p = 0.011) in this age group (Figure 7B).
Table 4.
Analogous probes for previously identified significant probes (Lit et al., 2007) found significant within current analyses.
| Gene ID | Gene name | Chromosome | Fold Change |
|---|---|---|---|
| (t-test analyses, age group 10-12 years) | |||
| 209160_at | AKR1C3 | 10p15-p14 | 1.9 |
| 205488_at | GZMA | 5q11-q12 | 1.92 |
| 210164_at | GZMB | 14q11.2 | 1.55 |
| 213915_at | NKG7 | 19q13.41 | 1.52 |
| 214617_at | PRF1 | 10q22 | 1.73 |
| 217143_s_at | TRA@,TRD@ | 14q11.2 | 1.87 |
| 216191_s_at | TRA@,TRD@ | 14q11.2 | 1.96 |
Figure 6.

Scatter plot showing the group mean expression of 7 probes (representing 6 genes) previously identified in TS (Lit et al., 2007) for Tourette syndrome (left; diamonds) and Controls (right; triangles). The data represents the mean of the 13 Tourette subjects and 11 normal control subjects in the 10 to 12 year old age group. Range of fold changes for probes in this figure is 1.52 to 1.96.
Figure 7.
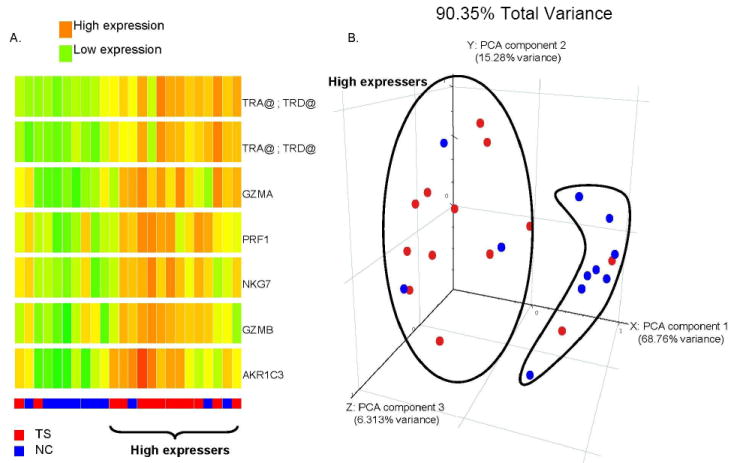
(A) Unsupervised hierarchical cluster analysis of 7 probe sets (6 genes) (Y-axis) previously identified in TS (Lit et al., 2007) and also found significant in the current study (dependent t-test, p≤.0.05, fold change > |1.5|) for 13 Tourette’s Syndrome (TS) subjects (Red at bottom) compared to 11 control subjects (NC) (blue at bottom) (X-axis) in the 10-12 age group. High expression is red and low is green. (B) Principal Components Analysis scatter plot showing separation of most TS subjects (red) from normal controls (NC, blue) based on seven NK genes. The first three principal components were selected (accounting for >90% of the total variance) for visualization in a 3-dimensional figure. Red, TS; Blue, NC.
4. Discussion
This study examined whole blood gene expression differences in TS compared to controls. Although we did not find evidence for a TS gene expression signature in blood, we did find, on cross sectional analysis, some findings that bear further study with regard to age-related differences between TS children and control children.
Despite high heritability, TS appears not to be a single gene disorder. However, there may be certain processes that occur in TS that correspond to critical final common pathways in TS. If there are such processes, we might expect them to differ at different time points in childhood, a time where TS symptoms can fluctuate dramatically. As infections are common in childhood, findings related to differences in responses to infections are worth investigating.
Although previous analyses by our groups utilized a fold change cutoff in conjunction with a p-value subjected to a multiple comparison correction (e.g., Lit et al., 2007; Tang et al., 2005), we adopted an alternate analysis strategy in this report in part because vast age heterogeneity of the current sample and increased number of probes examined contributed to difficulty surpassing the resulting FDR. We also were interested in considering as broadly as possible how changes in gene expression across age groups differed in TS compared to controls.
Our findings suggest that in children with TS, it may be important to analyze children longitudinally, as they pass through different stages of their disorder. Cross sectional studies such as this one may yield more informative results if the child’s age is used as a stratifying variable. This principle may be generalizable to other complex disorders that evolve through different stages in childhood. Our findings provide a novel approach for future functional studies of a relatively common neurodevelopmental disorder likely to have complex genetic and environmental etiologies and interactions. Gene expression profiling provides one of the few approaches for examining genetic and environmental interactions within a single subject.
4.1 Hypothesis generation for further study
Expression of the same subset of NK cell genes have now been identified in a previous cohort of TS (Lit et al., 2007) and in the current group of TS subjects in the age group 10-12. Reanalysis of the previous data set identified a significant difference in mean age between those in the subgroup over-expressing this group of NK genes and those not in the subgroup (p = 0.027). Importantly, the mean age for the subgroup over-expressing the NK genes was 12.8 years, compared to a mean age of those not in the subgroup of 25.7 years. Thus the age group in the current study showing the NK gene upregulation (10-12) mirrors the mean age with NK gene upregulation in the previous study (Lit et al., 2007). However, although the NK group appeared to be associated with the presence of ADHD in the previous study, we did not find a similar association in this study, further suggesting that the NK genes are associated with age and not comorbidities.
In addition to supporting our previous finding of up-regulated NK cell genes in TS (Lit et al., 2007), we found some evidence of a dampened interferon-alpha (IFNα) pathway in younger children with TS. This corresponds to the time of onset for many children. These data also show age-related changes in viral-response pathways in TS compared to NC, including changes in NK cell and B cell immunoglobulin genes. These findings are intriguing given the high prevalence of viral infections in children and recent longitudinal data showing that only a small fraction of TS exacerbations appear to be linked to streptococcal infections (Kaplan et al., 2007).
These immune-related expression differences also suggest that children with TS may have problems with initial pathogen detection, which is predominantly mediated by toll-like receptors (TLRs) and interferon regulatory factors (IRF) (Malmgaard, 2004; O’Neill & Bowie, 2007; Weber & Haller, 2007). In the current study, we found that many of the genes in the TLR and IRF pathways show decreased expression with age in NC but increased expression with age in TS (Supplemental Table S8). This may suggest altered initial pathogen responses in TS.
Although most IRFs showed no difference between TS and NC, IRF5 was upregulated in the 5-9 age group. IRF5 is involved in delayed induction of TNF-α in response to a viral or bacterial TLR response (Takaoka et al., 2005). This is consistent with the previously reported increased TNF-α in TS (Leckman et al., 2005). Moreover, IRF5 specifically induces IFNα subtype 8 (IFNA8) (Barnes et al., 2001). Thus while total IFNα levels might not show significant differences within TS in this study or previous reports (Leckman et al., 2005), it is possible that the IFNα protein produced in TS might be a different subtype than that in NC (Kumaran et al., 2007). This might account for increased TNF-α in TS, as well as suggest a mechanism for differential viral responses in younger children with TS compared to controls.
Downstream activation pathways for interferons also appear to be differentially regulated in TS. IFNα dependent viral clearance may be altered in TS compared to NC, since expression of genes within interferon activation pathways related to viral clearance (e.g. STAT1, STAT2, OAS1, OAS2, OAS3, EIF2AK2, and MX1) increases with age for TS, but decreases with age for NC (Supplemental Tables S6 and S8). Interferon pathways could also be affected by expression of genes related to proteasome, immunoproteasome, and ubiquitin-mediated proteolysis in the 5-9 age group (Supplemental Table S3). These pathways are also involved in neurodegenerative movement disorders including Huntington’s Disease (Bennett et al., 2005). B cell and antibody function may also be affected since there is down-regulation of precursor B cell immunoglobulin regions necessary for competent B cell receptor (antibody) rearrangement (e.g. IGHD, IGHM, IHKC, IKV, IGL, and IGLV) in the 5-9 TS age group.
In contrast, the cytolytic, proteasome and ubiquitin-mediated proteolysis pathways appear to be enhanced in the 10-12 age group. Up-regulation of 7 probes in the 10-12 age group distinguished most TS samples from NC (Table 4, Figure 7A). These probes included the cytotoxic granule proteins granzyme A, granzyme B, and perforin, all part of a shared killing pathway between NK cells and cytotoxic T cells which represents a major immune mechanism for lysing viral and other infected cells. Coupled with Leckman’s report (2005) of increased plasma IL-12 in TS, our findings also point toward an altered viral response associated with TS.
Our results may also relate to conflicting findings regarding GABHS and viral infections and their role in TS (Allen et al., 1995; Giulino et al., 2002; Hoekstra et al., 2005; Muller et al., 2004). Different strains of influenza generate specific, yet varied immune responses (Kobasa et al., 2007). If children with a genetic predisposition to TS encounter a specific strain of influenza or other virus, they may be unable to mount an appropriately regulated response that could affect the CNS directly or indirectly via altered peripheral cytokines or chemokines. Additionally, studies examining the etiology of pharyngitis suggest the frequent presence of viruses accompanying bacterial infections such as GABHS (Esposito et al., 2004; McMillan et al., 1986). Thus it may be that specific viruses, bacteria, or both contribute to tic onset and/or exacerbation.
Genetically, the over representation of genes on chromosomes 17 and 22 in our study is a very interesting finding, but of unclear significance at present. All probes regulated in TS compared to NC located on chromosome 22 were within the 22q11-q13 region where a deletion has been associated with TS (Robertson et al., 2006) and other neurodevelopmental disorders (Mukaddes & Herguner, 2007; Ousley et al., 2007; Yobb et al., 2005). Notably, 22q11.2 deletion is associated with DiGeorge Syndrome, in which subjects lack T cell responses due to thymic failure (Cancrini et al., 2005; Lischner & Huff, 1975). Additionally, 60% of the probes located on chromosome 17 were located in the 17q21-17q25 region, a region previously implicated in TS (Paschou et al., 2004; Zhang et al., 2002). Tubulin-specific chaperone D (TBCD, 17q25.3) is also in this region and was suggested as a candidate gene for TS (Paschou et al., 2004). We found that expression of TBCD increases with age for NC (r=0.57), with no corresponding increase in expression with age for TS.
4.2. Limitations
This study was limited in that it was cross-sectional rather than longitudinal. In addition, the individuals in the older age group (13-16) represented a biased sample of teenagers whose tics had not diminished. This bias occurred because the older subjects with continued tics would be the ones most likely to be seen and followed in the pediatric neurology clinic in these studies.
Subgroups stratified by age were small, and it was not possible due to the assortment of pharmacological agents to tease apart effects of medication on gene expression. However, because it is a challenge to find Tourette subjects not on medication, most published research studies include medicated subjects. In addition, since the medications used varied greatly from subject to subject, we doubt that a specific drug accounts for a specific gene expression profile shown in this study.
Although we are looking at blood rather than brain, interaction between peripheral immune function and central nervous system function is well-recognized (Szelenyi & Vizi, 2007). Blood markers have been used to differentiate TS subjects on various medications from controls (Kawikova et al., 2007; Leckman et al., 2005). Changes of gene expression in peripheral blood have been demonstrated in subjects with stroke, which only affects brain, and in genetic neurological diseases where there are brain and peripheral manifestations of the diseases (Tang et al., 2001; Tang et al., 2003). Hence, gene expression in peripheral blood could detect genetic effects, effects of brain injury, and peripheral immune responses that might occur in subgroups or in all subjects with TS.
Because leukocyte cell types were not analyzed separately, the findings may indicate aberrant expression levels across cell types or differences in numbers of cell types. Further studies after cell sorting might clarify this but might also introduce additional confounders or difficulties, since the method of obtaining whole blood in PAXgene tubes used in this study is acknowledged to be the only way to stabilize RNA immediately during the blood draw and avoid ex vivo changes of gene expression that would occur with cellular isolations.
Finally, we did not perform repeated analyses or confirmations of our findings using RT-PCR.
Overall, the biological cohesiveness of findings across analyses and age groups, the association of findings with age groups independent of tic severity scales, together with previous findings of immune dysregulation in TS (including replication of an NK dysregulation profile), suggest important age-dependent mechanisms associated with and possibly contributing to the TS phenotype.
Supplementary Material
Supplementary information is available at the Journal of Psychiatric Research website.
Footnotes
Publisher's Disclaimer: This is a PDF file of an unedited manuscript that has been accepted for publication. As a service to our customers we are providing this early version of the manuscript. The manuscript will undergo copyediting, typesetting, and review of the resulting proof before it is published in its final citable form. Please note that during the production process errors may be discovered which could affect the content, and all legal disclaimers that apply to the journal pertain.
References
- A.P.A. Diagnostic and statistical manual of mental disorders: DSM-IV-TR. 4. Washington, DC: American Psychiatric Association; 2000. [Google Scholar]
- Allen AJ, Leonard HL, Swedo SE. Case study: a new infection-triggered, autoimmune subtype of pediatric OCD and Tourette’s syndrome. J Am Acad Child Adolesc Psychiatry. 1995;34:307–11. doi: 10.1097/00004583-199503000-00015. [DOI] [PubMed] [Google Scholar]
- Barnes BJ, Moore PA, Pitha PM. Virus-specific activation of a novel interferon regulatory factor, IRF-5, results in the induction of distinct interferon alpha genes. J Biol Chem. 2001;276:23382–90. doi: 10.1074/jbc.M101216200. [DOI] [PubMed] [Google Scholar]
- Bennett EJ, Bence NF, Jayakumar R, Kopito RR. Global impairment of the ubiquitin-proteasome system by nuclear or cytoplasmic protein aggregates precedes inclusion body formation. Mol Cell. 2005;17:351–65. doi: 10.1016/j.molcel.2004.12.021. [DOI] [PubMed] [Google Scholar]
- Bolstad BM, Irizarry RA, Astrand M, Speed TP. A comparison of normalization methods for high density oligonucleotide array data based on variance and bias. Bioinformatics. 2003;19:185–93. doi: 10.1093/bioinformatics/19.2.185. [DOI] [PubMed] [Google Scholar]
- Cancrini C, Romiti ML, Finocchi A, Di Cesare S, Ciaffi P, Capponi C, Pahwa S, Rossi P. Post-natal ontogenesis of the T-cell receptor CD4 and CD8 Vbeta repertoire and immune function in children with DiGeorge syndrome. J Clin Immunol. 2005;25:265–74. doi: 10.1007/s10875-005-4085-3. [DOI] [PubMed] [Google Scholar]
- Dale RC. Autoimmunity and the basal ganglia: new insights into old diseases. QJM. 2003;96:183–91. doi: 10.1093/qjmed/hcg026. [DOI] [PubMed] [Google Scholar]
- Dennis G, Jr, Sherman BT, Hosack DA, Yang J, Gao W, Lane HC, Lempicki RA. DAVID: Database for Annotation, Visualization, and Integrated Discovery. Genome Biol. 2003;4:P3. [PubMed] [Google Scholar]
- DuPaul GJ, Power TJ, Anastopoulos AD, Reid R. ADHD Rating Scale-IV: Checklists, Norms, and Clinical Interpretation. New York: Guilford Publications; 1998. [Google Scholar]
- Esposito S, Blasi F, Bosis S, Droghetti R, Faelli N, Lastrico A, Principi N. Aetiology of acute pharyngitis: the role of atypical bacteria. J Med Microbiol. 2004;53:645–51. doi: 10.1099/jmm.0.05487-0. [DOI] [PubMed] [Google Scholar]
- Feng Z, Davis DP, Sasik R, Patel HH, Drummond JC, Patel PM. Pathway and gene ontology based analysis of gene expression in a rat model of cerebral ischemic tolerance. Brain Res. 2007;1177:103–23. doi: 10.1016/j.brainres.2007.07.047. [DOI] [PubMed] [Google Scholar]
- Genespring. Genespring User Manual Version 7.4. Silicon Genetics; 2004. [Google Scholar]
- Giulino L, Gammon P, Sullivan K, Franklin M, Foa E, Maid R, March JS. Is parental report of upper respiratory infection at the onset of obsessive-compulsive disorder suggestive of pediatric autoimmune neuropsychiatric disorder associated with streptococcal infection? J Child Adolesc Psychopharmacol. 2002;12:157–64. doi: 10.1089/104454602760219199. [DOI] [PubMed] [Google Scholar]
- Hoekstra PJ, Anderson GM, Limburg PC, Korf J, Kallenberg CG, Minderaa RB. Neurobiology and neuroimmunology of Tourette’s syndrome: an update. Cell Mol Life Sci. 2004;61:886–98. doi: 10.1007/s00018-003-3320-4. [DOI] [PMC free article] [PubMed] [Google Scholar]
- Hoekstra PJ, Manson WL, Steenhuis MP, Kallenberg CG, Minderaa RB. Association of common cold with exacerbations in pediatric but not adult patients with tic disorder: a prospective longitudinal study. J Child Adolesc Psychopharmacol. 2005;15:285–92. doi: 10.1089/cap.2005.15.285. [DOI] [PubMed] [Google Scholar]
- Hosack DA, Dennis G, Jr, Sherman BT, Lane HC, Lempicki RA. Identifying biological themes within lists of genes with EASE. Genome Biol. 2003;4:R70. doi: 10.1186/gb-2003-4-10-r70. [DOI] [PMC free article] [PubMed] [Google Scholar]
- Kaplan EL, Johnson DR, McDermott MP, Kurlan R Group, T.S.S. Is PANDAS related to Group A streptococcal infections? A 25 month intensive prospective blinded cohort study of streptococcal infections and exacerbations of tics and OCS. Pediatric Academic Society’s Annual Meeting; Toronto, Canada. 2007. [Google Scholar]
- Kawikova I, Leckman JF, Kronig H, Katsovich L, Bessen DE, Ghebremichael M, Bothwell AL. Decreased numbers of regulatory T cells suggest impaired immune tolerance in children with tourette syndrome: a preliminary study. Biol Psychiatry. 2007;61:273–8. doi: 10.1016/j.biopsych.2006.06.012. [DOI] [PubMed] [Google Scholar]
- Kobasa D, Jones SM, Shinya K, Kash JC, Copps J, Ebihara H, Hatta Y, Kim JH, Halfmann P, Hatta M, Feldmann F, Alimonti JB, Fernando L, Li Y, Katze MG, Feldmann H, Kawaoka Y. Aberrant innate immune response in lethal infection of macaques with the 1918 influenza virus. Nature. 2007;445:319–23. doi: 10.1038/nature05495. [DOI] [PubMed] [Google Scholar]
- Kumaran J, Wei L, Kotra LP, Fish EN. A structural basis for interferon-{alpha}-receptor interactions. Faseb J. 2007 doi: 10.1096/fj.07-8585com. [DOI] [PubMed] [Google Scholar]
- Leckman JF, Katsovich L, Kawikova I, Lin H, Zhang H, Kronig H, Morshed S, Parveen S, Grantz H, Lombroso PJ, King RA. Increased serum levels of interleukin-12 and tumor necrosis factor-alpha in Tourette’s syndrome. Biol Psychiatry. 2005;57:667–73. doi: 10.1016/j.biopsych.2004.12.004. [DOI] [PubMed] [Google Scholar]
- Leckman JF, Riddle MA, Hardin MT, Ort SI, Swartz KL, Stevenson J, Cohen DJ. The Yale Global Tic Severity Scale: initial testing of a clinician-rated scale of tic severity. J Am Acad Child Adolesc Psychiatry. 1989;28:566–573. doi: 10.1097/00004583-198907000-00015. [DOI] [PubMed] [Google Scholar]
- Leckman JF, Zhang H, Vitale A, Lahnin F, Lynch K, Bondi C, Kim YS, Peterson BS. Course of tic severity in Tourette syndrome: the first two decades. Pediatrics. 1998;102:14–19. doi: 10.1542/peds.102.1.14. [DOI] [PubMed] [Google Scholar]
- Lischner HW, Huff DS. T-cell deficiency in diGeorge syndrome. Birth Defects Orig Artic Ser. 1975;11:16–21. [PubMed] [Google Scholar]
- Lit L, Gilbert DL, Walker W, Sharp FR. A subgroup of Tourette’s patients overexpress specific natural killer cell genes in blood: A preliminary report. Am J Med Genet B Neuropsychiatr Genet. 2007;144:958–63. doi: 10.1002/ajmg.b.30550. [DOI] [PubMed] [Google Scholar]
- Malmgaard L. Induction and regulation of IFNs during viral infections. J Interferon Cytokine Res. 2004;24:439–54. doi: 10.1089/1079990041689665. [DOI] [PubMed] [Google Scholar]
- Martino D, Giovannoni G. Autoaggressive immune-mediated movement disorders. Adv Neurol. 2005;96:320–35. [PubMed] [Google Scholar]
- McMillan JA, Sandstrom C, Weiner LB, Forbes BA, Woods M, Howard T, Poe L, Keller K, Corwin RM, Winkelman JW. Viral and bacterial organisms associated with acute pharyngitis in a school-aged population. J Pediatr. 1986;109:747–52. doi: 10.1016/s0022-3476(86)80687-4. [DOI] [PubMed] [Google Scholar]
- Mukaddes NM, Herguner S. Autistic disorder and 22q11.2 duplication. World J Biol Psychiatry. 2007;8:127–30. doi: 10.1080/15622970601026701. [DOI] [PubMed] [Google Scholar]
- Muller N, Riedel M, Blendinger C, Oberle K, Jacobs E, Abele-Horn M. Mycoplasma pneumoniae infection and Tourette’s syndrome. Psychiatry Res. 2004;129:119–25. doi: 10.1016/j.psychres.2004.04.009. [DOI] [PubMed] [Google Scholar]
- O’Neill LA, Bowie AG. The family of five: TIR-domain-containing adaptors in Toll-like receptor signalling. Nat Rev Immunol. 2007;7:353–64. doi: 10.1038/nri2079. [DOI] [PubMed] [Google Scholar]
- Ousley O, Rockers K, Dell ML, Coleman K, Cubells JF. A review of neurocognitive and behavioral profiles associated with 22q11 deletion syndrome: implications for clinical evaluation and treatment. Curr Psychiatry Rep. 2007;9:148–58. doi: 10.1007/s11920-007-0085-8. [DOI] [PubMed] [Google Scholar]
- Paschou P, Feng Y, Pakstis AJ, Speed WC, DeMille MM, Kidd JR, Jaghori B, Kurlan R, Pauls DL, Sandor P, Barr CL, Kidd KK. Indications of linkage and association of Gilles de la Tourette syndrome in two independent family samples: 17q25 is a putative susceptibility region. Am J Hum Genet. 2004;75:545–60. doi: 10.1086/424389. [DOI] [PMC free article] [PubMed] [Google Scholar]
- Robertson MM, Shelley BP, Dalwai S, Brewer C, Critchley HD. A patient with both Gilles de la Tourette’s syndrome and chromosome 22q11 deletion syndrome: clue to the genetics of Gilles de la Tourette’s syndrome? J Psychosom Res. 2006;61:365–8. doi: 10.1016/j.jpsychores.2006.06.011. [DOI] [PubMed] [Google Scholar]
- Scahill L, Riddle MA, McSwiggin-Hardin M, Ort SI, King RA, Goodman WK, Cicchetti D, Leckman JF. Children’s Yale-Brown Obsessive Compulsive Scale: reliability and validity. J Am Acad Child Adolesc Psychiatry. 1997;36:844–852. doi: 10.1097/00004583-199706000-00023. [DOI] [PubMed] [Google Scholar]
- Sharp FR, Xu H, Lit L, Walker W, Apperson M, Gilbert DL, Glauser TA, Wong B, Hershey A, Liu DZ, Pinter J, Zhan X, Liu X, Ran R. The future of genomic profiling of neurological diseases using blood. Arch Neurol. 2006;63:1529–36. doi: 10.1001/archneur.63.11.1529. [DOI] [PubMed] [Google Scholar]
- Szelenyi J, Vizi ES. The Catecholamine Cytokine Balance: Interaction between the Brain and the Immune System. Ann N Y Acad Sci. 2007;1113:311–24. doi: 10.1196/annals.1391.026. [DOI] [PubMed] [Google Scholar]
- Takaoka A, Yanai H, Kondo S, Duncan G, Negishi H, Mizutani T, Kano S, Honda K, Ohba Y, Mak TW, Taniguchi T. Integral role of IRF-5 in the gene induction programme activated by Toll-like receptors. Nature. 2005;434:243–9. doi: 10.1038/nature03308. [DOI] [PubMed] [Google Scholar]
- Tang Y, Gilbert DL, Glauser TA, Hershey AD, Sharp FR. Blood gene expression profiling of neurologic diseases: a pilot microarray study. Arch Neurol. 2005;62:210–5. doi: 10.1001/archneur.62.2.210. [DOI] [PubMed] [Google Scholar]
- Tang Y, Lu A, Aronow BJ, Sharp FR. Blood genomic responses differ after stroke, seizures, hypoglycemia, and hypoxia: blood genomic fingerprints of disease. Ann Neurol. 2001;50:699–707. doi: 10.1002/ana.10042. [DOI] [PubMed] [Google Scholar]
- Tang Y, Nee AC, Lu A, Ran R, Sharp FR. Blood genomic expression profile for neuronal injury. J Cereb Blood Flow Metab. 2003;23:310–9. doi: 10.1097/01.WCB.0000048518.34839.DE. [DOI] [PubMed] [Google Scholar]
- Weber F, Haller O. Viral suppression of the interferon system. Biochimie. 2007 doi: 10.1016/j.biochi.2007.01.005. [DOI] [PMC free article] [PubMed] [Google Scholar]
- Wu Z, Irizarry RA, Gautier L, Cope L, Bolstad BM, Collin F, Cope LM, Hobbs B, Speed TP. Preprocessing of oligonucleotide array data. Nat Biotechnol. 2004;22:656–8. doi: 10.1038/nbt0604-656b. author reply 658. [DOI] [PubMed] [Google Scholar]
- Yobb TM, Somerville MJ, Willatt L, Firth HV, Harrison K, MacKenzie J, Gallo N, Morrow BE, Shaffer LG, Babcock M, Chernos J, Bernier F, Sprysak K, Christiansen J, Haase S, Elyas B, Lilley M, Bamforth S, McDermid HE. Microduplication and triplication of 22q11.2: a highly variable syndrome. Am J Hum Genet. 2005;76:865–76. doi: 10.1086/429841. [DOI] [PMC free article] [PubMed] [Google Scholar]
- Zhang H, Leckman JF, Pauls DL, Tsai CP, Kidd KK, Campos MR. Genomewide scan of hoarding in sib pairs in which both sibs have Gilles de la Tourette syndrome. Am J Hum Genet. 2002;70:896–904. doi: 10.1086/339520. [DOI] [PMC free article] [PubMed] [Google Scholar]
Associated Data
This section collects any data citations, data availability statements, or supplementary materials included in this article.
Supplementary Materials
Supplementary information is available at the Journal of Psychiatric Research website.