Abstract
The nucleophilic addition of the aminothiols homocysteine (HCY), cysteine (CYS), and glutathione (GSH) to the electrogenerated quinone of fluorone black (1) via the ECE mechanism is reported. It is demonstrated that 1 selectively reacts with GSH to form the bis-GSH adduct, 1–(GSH)2, while only the monothiol adducts were generated in the presence of HCY and CYS (1–HCY and 1–CYS, respectively). The more anodic Epa of 1–(GSH)2 relative to 1 and 1–GSH (ΔEpa ~ +0.14) is the voltammetric signature that allows the discrimination of GSH from HCY and CYS. It is also shown that the presence of structurally similar aminothiols–HCY and CYS–posed no interference to the signature voltammetric response of 1–(GSH)2.
It is well established that organothiols play important roles in numerous cellular biochemical reactions.1 The presence of sulfur-containing amino acids in bodily fluids, such as homocysteine (HCY), cysteine (CYS), and glutathione (GSH), provides biomedical scientists an avenue for evaluating a number of clinical conditions.2 The importance of these three specific aminothiols to the biomedical community has grown because these thiols are recognized as valuable biomarkers for a wide variety of diseases.3,4 For instance, elevated levels of these aminothiols have been linked to Alzheimer’s, Parkinson’s, and cardiovascular diseases,5 and increased levels of GSH and CYS have been noted in AIDS-related dementia.3 Depletion of intracellular CYS and GSH has been associated with leukemia, cervical cancer, liver disease, and several other disorders.3–5 Hence, development of a variety of methods that are capable of monitoring aminothiol levels in physiological systems is needed to further investigate their specific role as biomarkers.2,3
The analytical community has focused its attention on the well-documented redox properties of the aminothiols HCY, CYS, and GSH.1–5 Electrochemical techniques hold much potential for the in vitro analysis of these aminothiols because such methods offer the advantage of minimal sample pretreatment, rapid analysis time, and simple experimental approach.3 However, the limitations of electroanalytical methodologies that employ solid electrodes have diminished the broad acceptance of these protocols.6,7 In the case of Hg amalgam-coated electrodes,1,6–8 for instance, the toxicity of the materials used, as well as the more complex and time-consuming configuration of the setup, outweigh the high sensitivity and low limit of detection of the method.1,2 On the other hand, methods that employ direct detection of aminothiols at solid electrode surfaces have limited selectivities because such protocols are impeded by the poor voltammetric responses of the analytes at high anodic potentials.2,8,9 The known voltammetric techniques typically require mediators, derivatizing agents, or complicated sample pretreatments, such that the attainment of optimum sensitivity and low limit of detection is negated by poor selectivity and vice versa.4,8,9 All of the reported electroanalytical methodologies have successfully presented the fundamental characterization technique for biological thiols, but the viability of the electrochemical protocols has remained a matter of speculation,2,3,9b as obstacles are always encountered due to the complex functions of these aminothiols in physiological systems.
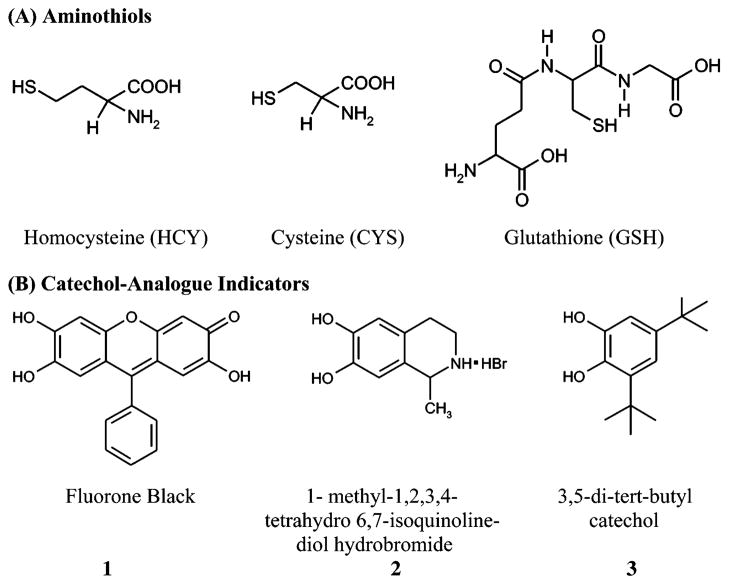
The objective of our work is the development of novel and simple electroanalytical methodologies that employ catechol analogues as redox indicators for the in vitro assay of HCY, CYS, and GSH (Figure 1A). As part of a collaborative program aimed at developing selective and sensitive methods for the detection of these aminothiols,10 we report here initial investigations that target the direct detection and discrimination of GSH from HCY and CYS using inexpensive and readily available materials. The central sensing element of this work utilizes electrochemically generated o-quinones of catechol analogues (Figure 1B) as redox reporters of the aminothiols. The metabolic mechanism of catechol-containing compounds in biological systems11–which involves their oxidation to the corresponding o-quinones and subsequent nucleophilic addition reaction with thiols12–has been investigated in studies of catechol estrogens,13 catecholamines,14 p-cresol (4-methylphenol),15 chlorogenic acid,16 and dopamine.17 This same mechanism forms the basis of the thiol–catechol reactions detailed in Scheme 1, which also outlines the redox-promoted signals generated by the oxidation of catechol–thiol adducts. We specifically propose that the voltammetric discrimination of GSH from HCY and CYS arises from the differences in the electrochemical oxidation potentials of the GSH–indicator adducts from those of HCY– and CYS–indicator adducts.
Figure 1.
Structures of aminothiols (A) and redox indicators (B).
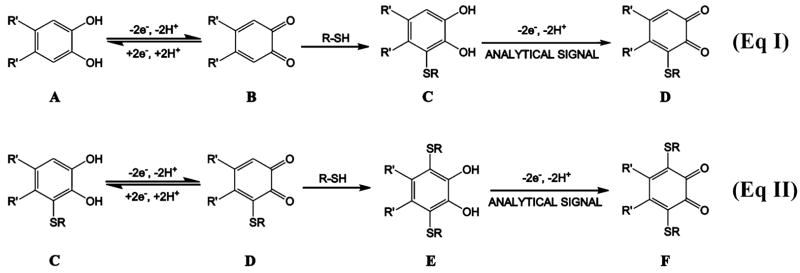
Scheme 1.
Proposed Reaction Pathway for the Addition of Thiols to the Catechol–Analogue Derivative via the ECE Mechanism
EXPERIMENTAL SECTION
Reagents of the highest purity available were purchased from Aldrich and were used as received. Compound 3–GSH was synthesized according to literature procedures.31 All solutions and subsequent dilutions were prepared using triply distilled, deionized water (18 MΩ·cm) from a Barnstead Nanopure water purification system. Solutions of catechol derivatives (1.0 × 10⁻³ M) were prepared in a 70:30 MeOH/H2O (0.050 M phosphate buffer, pH 7.3) solvent system. The catechol solutions were titrated with aliquots of the aminothiols to obtain the desired concentrations for the electrochemical measurements. In all cases, solutions were deaerated with high-purity N2 prior to their evaluation.
The electrochemical measurements were obtained using a computer-controlled EG&G PAR model 273A potentiostat and a standard three-electrode cell of 5-mL volume. Glassy carbon (A = 0.07 cm2, CH Instruments, Austin, TX) served as the working electrode, a homemade 99.9% platinum wire (d = 0.05 cm, CH Instruments) coil as the counter electrode, and Ag/AgCl (3.0 M KCl, CH Instruments) as the reference electrode. The working electrode was polished between measurements on a Buehler microcloth with alumina micropolish (1 μm) paste.
RESULTS AND DISCUSSION
The mechanism of the catechol–thiol adduct formation is detailed in Scheme 1,18 where the electrochemical detection of the aminothiols relies on the analytical signal generated from the oxidation of catechol–thiol adducts C and E. Catechol-analogue indicator A is electrochemically oxidized to quinone B, which then undergoes nucleophilic attack by the thiol species to produce the catechol–thiol adduct C. Oxidation of C, which occurs at a potential similar to that of A, yields quinone D (eq I), which can further react with the thiol to generate catechol–(bisthiol) adduct E (eq II). The oxidation of E to F (eq II) occurs at a potential that is different from either A or C. Such voltammetric discrimina tion between the anodic response of catechol–(bisthiol) E from those of A and catechol–(monothiol) C provides the selectivity of the approach.
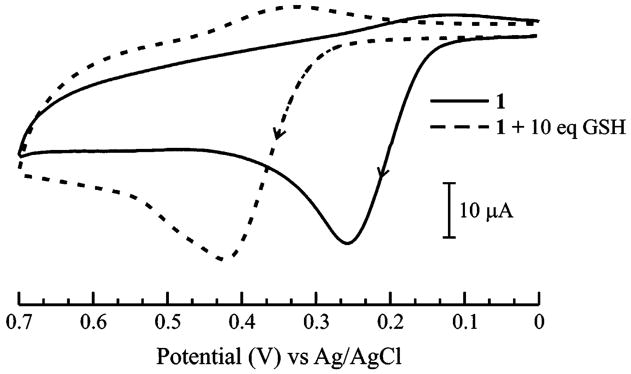
We employed fluorone black (1) as the redox reporter in the electrochemical detection of the aminothiols, as we have shown this catechol analogue to be a promising optical indicator for these thiols.10 The cyclic voltammetric profile of 1 in 70:30 MeOH/H2O (0.050 M phosphate buffer, pH 7.3), shown in Figure 2, exhibits an irreversible oxidation at +0.26 V (vs Ag/AgCl) as the redox signature of the system. Upon addition of 10 equiv of GSH to a solution of 1, the sole voltammetric signal is an oxidation peak at + 0.42 V. We ascribe this response at +0.42 V to the oxidation of 1–(GSH)2 that is formed from the electrochemically initiated reaction pathway shown in Scheme 1 (eq II). Cyclic voltammograms of GSH in the absence of 1 exhibit no significant oxidation or reduction peaks over the potential range shown in Figure 2.
Figure 2.
Cyclic voltammograms of 1.0 × 10⁻³ M 1 before (solid line) and after (dashed line) addition of GSH (1.0 × 10⁻² M) in 70:30 MeOH/H2O (0.050 M phosphate buffer, pH 7.3) solution, ν = 0.1 V·s−1. Arrows indicate the direction of the voltammetric scans.
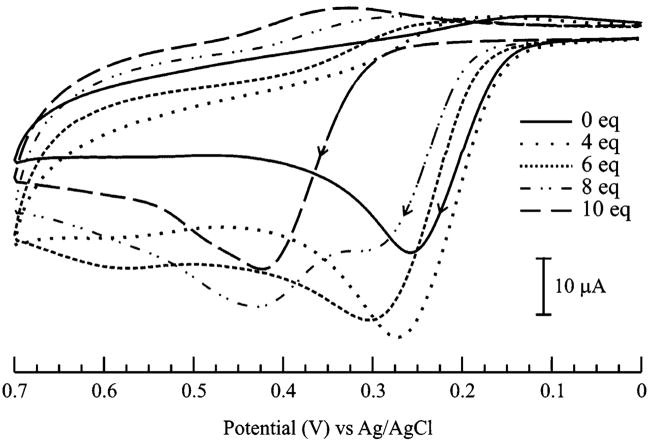
Titration studies were performed in order to investigate the formation of 1–(GSH)2 in more detail. The voltammetric profile for the titration of 1 with GSH (1–10 equiv) in Figure 3 reveals important observations at three GSH/1 ratios: (i) the apparent increase in the anodic current of 1 at low GSH/1 (≤4:1) ratios; (ii) the gradual decrease in anodic current corresponding to the oxidation of 1 at an intermediate ratio of GSH/1 (6:1); and (iii) a progressive appearance of the more anodic oxidation peak at +0.42 V and a concomitant decrease of current at +0.28 V at high GSH/1 (≥8:1) ratios. The result at low GSH/1 (≤4:1) ratios is in agreement with previous reports on related systems, where the anodic current enhancement at the oxidation peak potentials (Epa) of the indicators was attributed to the formation of a catechol–glutathionyl adduct via an ECE mechanism (Scheme 1, eq I).2,9,11a,18–20 In our case, the increase in current21 at +0.28 V corresponds to the formation of a reduced 1–GSH adduct (equivalent of C in Scheme 1) that is governed by the same ECE mechanism (eq I in Scheme 1).18 In analogy to a previous account,19 no shift in Epa was observed for the solutions of 1 containing low amounts of GSH (<4 equiv) because the oxidation of 1–GSH adduct occurs at a potential that is very similar to that of indicator 1. At high GSH/1 (≥ 8:1) ratios, the emergence of the new anodic response at +0.42 V is in contrast to previously studied systems, where the occurrence of a new reduction wave was designated as the signature of the catechol–thiol adduct.19,20 We propose that the Epa at +0.42 V is indicative of the oxidation of 1–(GSH)2 (E → F in Scheme 1), which is produced by the reductive addition of GSH to the electrogenerated o-quinone of 1–GSH (C → D → E in Scheme 1). Thus, at an intermediate ratio of GSH/1 (6:1), the anodic current of 1–GSH at +0.28 V begins to diminish because 1–(GSH)2 is being generated at the expense of 1–GSH. No further increase in the anodic peak current at +0.42 V is observed beyond GSH/1 (>10:1) ratios, which suggests that quantitative conversion of 1–GSH to 1–(GSH)2 is attained at GSH/1 (10:1) ratio. Overall, the signature anodic peak at +0.42 V marks the ability of this novel approach to selectively distinguish the redox response of 1–(GSH)2 from those of 1–GSH and 1.
Figure 3.
Cyclic voltammograms detailing the response of 1.0 ×10⁻³ M 1 upon addition of increasing amounts of GSH (0–10 equiv) in 70:30 MeOH/H2O (0.050 M phosphate buffer, pH 7.3) solution, ν = 0.1 V·s−1
The proposed mechanisms in Scheme 1 are in accord with earlier reports on the formation of catechol–(multi-glutathionyl) conjugates in biological systems, which are known to be driven by the tendency of the aforementioned GSH adducts to undergo autoxidation and redox cycling processes.11b,22,23 Our claim is further supported by previous accounts on the formation of catechol–(bisglutathionyl) conjugates of similar catechol analogues in the presence of excess amounts of GSH.16,17,24 Thus, it is also reasonable to conclude that 1–GSH is predominantly formed at low GSH/1 (≤4:1) ratios and is an intermediate to the eventual formation of 1–(GSH)2. Therefore, increasing the concentrations of GSH beyond 4 equiv shifts the product distribution in favor of 1–(GSH)2, whose anodic potential signature is very much different from that of unreacted 1 and 1–GSH. While the Epa of 1–GSH is very similar to 1, the more anodic Epa of 1–(GSH)2 that is observed at high GSH/1 (≥8 equiv) ratios indicates that 1–(GSH)2 is thermodynamically more difficult to oxidize than 1 and 1–GSH.25
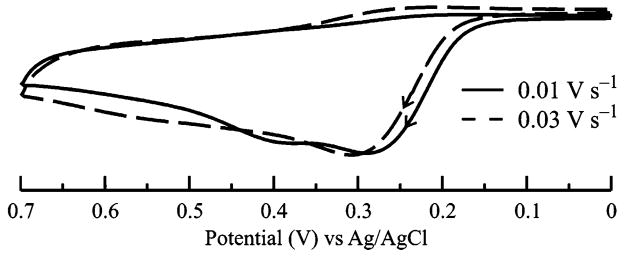
Scan rate-dependence studies further support the anodic peak assignment at +0.42 V (scan rate, ν = 0.1 V·s−1) to the oxidation of 1–(GSH)2. The current-normalized voltammograms of 1 in the presence of 6 equiv of GSH at two different scan rates are shown in Figure 4. When the applied potential is scanned at ν = 0.01 V·s−1, the anodic peak at ~+0.40 V26 that is attributed to the oxidation of 1–(GSH)2 is clearly visible. At this relatively slow ν (i.e., long voltammetric time scale), the reaction between the electrogenerated quinone of 1–GSH and GSH via the ECE mechanism (D → E in Scheme 1) has ample time to occur. At a shorter time scale of ν = 0.03 V·s−1, the anodic response for the oxidation of 1–(GSH)2 is not readily apparent and only the peak at +0.28 V dominates. Taken together, these observations indicate that the slower time scale at ν = 0.03 V·s−1 is insufficient to allow the formation of the bisubstituted conjugate.
Figure 4.
Current-normalized cyclic voltammograms of 1 (1.0 × 10⁻³ M) in the presence of 6 equiv of GSH at ν = 0.01 (solid line) and ν = 0.03 V·s−1 (dashed line).
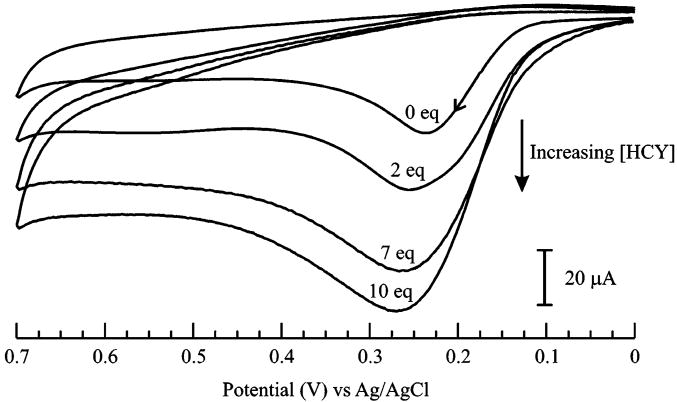
In the case of HCY and CYS, addition of these thiols (up to 10 equiv) to a solution of 1 only results to an increase in current at +0.26 V (Figures 5 and S-1 in Supporting Information). This observation is similar to the voltammetric responses of 1 at low GSH/1 (≤4:1) ratios and has been previously documented for the reaction of HCY and CYS with the electrogenerated o-quinones of catechols via the ECE mechanism (B → C in Scheme 1).2,9a,18,19,20 The increase in current21 at +0.26 V, which corresponds to the formation of a reduced 1–HCY and 1–CYS adducts (equivalent of C in Scheme 1), demonstrates that the catechol–thiol conjugates can be oxidized at potentials that are relatively similar to the Epa values of the respective catechols. Herein, the voltammetric results for indicator 1 in the presence of HCY and CYS complement these earlier accounts and suggest that 1–HCY and 1–CYS were formed via the same ECE mechanism, as outlined in eq I, Scheme 1.18 Based on the absence of a more anodic Epa relative to the oxidation potentials of 1 and 1–thiol adducts, it is suffice to conclude that 1–(HCY)2 and 1–(CYS)2 adducts were not generated.
Figure 5.
Voltammetric responses of 1 (1.0 × 10⁻³ M) upon addition of increasing amounts of HCY (1–10 equiv) in 70:30 MeOH/H2O (0.050 M phosphate buffer, pH 7.3) solution, ν = 0.10 V·s−1.
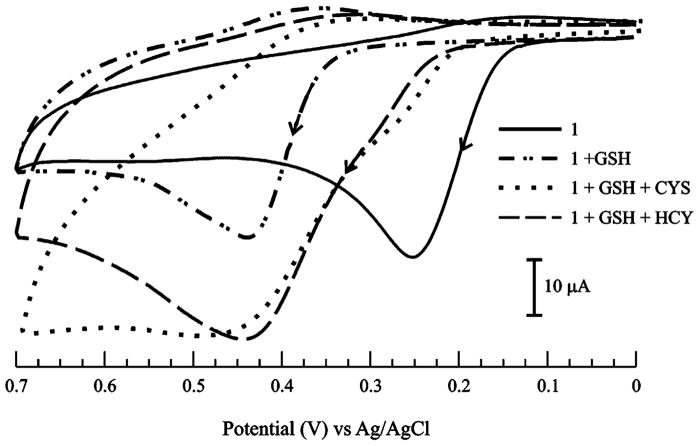
The selectivity of 1–(GSH)2 formation was assessed by examining the possible interference posed by HCY and CYS. It has been reported that the intracellular concentration of GSH is in the millimolar range, while HCY and CYS are present in micromolar amounts.27–29 Hence, control experiments utilizing solutions containing millimolar concentrations of these three thiols constitute an extreme representation of their actual physiological compositions.30 The results of these selectivity studies (Figure 6) convincingly indicate that even though HCY and CYS are present in equimolar amounts as GSH and 1, the signature anodic response of the 1–(GSH)2 was retained.
Figure 6.
Cyclic voltammograms of 1 (1.0 × 10⁻³ M) and GSH (1.0 × 10⁻² M) in the presence of CYS and HCY (1.0 × 10⁻² M each) in 70:30 MeOH/H2O (0.050 M phosphate buffer, pH 7.3) solution. ν = 0.1 V·s−1
To validate the mechanisms outlined in Scheme 1, structurally similar catechol-type indicators 2 and 3 (Figure 1B) were electrochemically evaluated in the presence of GSH, CYS, and HCY. The voltammetric behavior of these indicators was similar in all aspects to those of the 1–thiol mixtures. That is, the effects of HCY and CYS on the voltammograms of 2 and 3 (Figures S-2 and S-3, Supporting Information) are consistent with the formation of the indicator–(monothiol) adducts (2–HCY, 2–CYS, 3–HCY, 3–CYS). On the other hand, the addition of excess amounts (10 equiv) of GSH to 2 and 3 produced the expected Epa shifts (Figures S-4 and S-5, Supporting Information) that correspond to the indicator–(bisthiol) adducts 2–(GSH)2 and 3–(GSH)2. To further validate the anodic peak assignment of the indicator–(monothiol) adducts, 3–GSH was synthesized31 and electrochemically verified by cyclic voltammetry. The voltammogram of the chemically synthesized 3–GSH (Figure S-5, Supporting Information) shows that its voltammetric features are similar to the proposed electrochemically generated 3–GSH conjugate. Based on our current voltammetric evidence, it appears that the rate of formation of E for GSH is larger than that for CYS and HCY. Altogether, these results once again reaffirm the proposed electrochemically initiated addition mechanism in Scheme 1.
The emergence of an oxidation peak that is more anodic than the Epa values (ΔEpa ~0.14 V) of indicators 1–3 and their monothiol adducts is the key signal response that voltammetrically discriminates GSH from HCY and CYS. The fact that the signature oxidation peak (conversion of E to F) is observed only in the presence of GSH (due to the faster apparent rate of E formation with GSH) allows the catechol-type indicators to voltammetrically discern the anodic responses of the indicator–(bis-GSH) conjugates from those of the indicator–(mono-HCY) and indicator–(mono-CYS) adducts. Once again, based on the absence of a more anodic Epa relative to the oxidation potentials of the indicators, it is suffice to conclude that indicator–(bis-HCY) and indicator–(bis-CYS) adducts were not generated. The chemical reason for this distinct behavior of GSH in the presence of the indicators (faster apparent rate of E formation) remains unclear, but current efforts in our laboratory are now focused on effectively isolating and fully characterizing these catechol–thiol adducts. Although a quantitative evaluation in clinically relevant samples has not yet been carried out, the outcome of this investigation may be applied in the fabrication of microdevices for biomedical applications.
CONCLUSIONS
This article summarizes a simple electrochemical approach for detecting and discriminating GSH from HCY and CYS. Catechol derivatives 1–3 were utilized as electrochemical indicators, and their electrochemically initiated reaction with the aminothiols is demonstrated. It was shown that indicators 1–3 selectively formed indicator–(bisthiol) adducts with GSH, while only the indicator–(monothiol) adducts were generated with CYS and HCY under the conditions used here. The Epa values of the indicator–(bis-GSH) adducts are more anodic than their respective indicator–(mono-GSH) adducts (ΔEpa ~0.14 V) and serve as the voltammetric signature for the detection of GSH. The voltammetric features of 1–(GSH)2 were retained even in the presence of the structurally similar aminothiols HCY and CYS. Overall, the direct methodology and the simplicity of the approach, as well as the commercial availability of catechol–analogue indicators, are practical elements that reveal the importance of our contribution to the electrochemical sensing of aminothiols.2–4,19,20 Furthermore, our protocol provides a stable and yet flexible ground from which broad and optimized experimental conditions can be advanced.
Supplementary Material
Additional information as noted in text. This material is available free of charge via the Internet at http://pubs.acs.org.
Acknowledgments
This work was supported by grants from the National Science Foundation (CHE-010896 and EPS-0346411) and National Institutes of Health (R01 GM002044).
References
- 1.Mao L, Yamamoto K. Electroanalysis. 2000;12:577–582. [Google Scholar]
- 2.(a) Hignett G, Threlfell S, Wain A, Lawrence N, Wilkins S, Davis J, Compton R, Cardosi M. Analyst. 2001;126:353–357. doi: 10.1039/b008616i. [DOI] [PubMed] [Google Scholar]; (b) Nekrassova O, White P, Threlfell S, Hignett G, Wain A, Lawrence N, Davis J, Compton R. Analyst. 2002;127:797–802. doi: 10.1039/b202780c. [DOI] [PubMed] [Google Scholar]
- 3.White P, Lawrence N, Davis J, Compton R. Electroanalysis. 2002;14:89–98. and references therein. [Google Scholar]
- 4.Lawrence N, Deo R, Wang J. Talanta. 2004;63:443–449. doi: 10.1016/j.talanta.2003.11.024. and references therein. [DOI] [PubMed] [Google Scholar]
- 5.(a) Refsum H, Smith A, Ueland P, Nexo E, Clarke R, McPartlin J, Johnston C, Engbaek F, Schneede J, McPartlin C, Scott J. Clin Chem. 2004;50:3–32. doi: 10.1373/clinchem.2003.021634. [DOI] [PubMed] [Google Scholar]; (b) Seshadhari S, Beiser A, Selhub J, Jacques P, Rosenberg I, D’Agostino R, Wilson P, Wolf P. N Engl J Med. 2002;346:476–483. doi: 10.1056/NEJMoa011613. [DOI] [PubMed] [Google Scholar]; (c) Refsum H, Ueland P, Nygård O, Vollset S. Annu Rev Med. 1998;49:31–62. doi: 10.1146/annurev.med.49.1.31. [DOI] [PubMed] [Google Scholar]
- 6.Lawrence N, Davis J, Jiang L, Jones T, Davis S, Compton R. Analyst. 2000;125:661–663. [Google Scholar]
- 7.White P, Lawrence N, Davis J, Compton R. Anal Chim Acta. 2001;447:1–10. [Google Scholar]
- 8.(a) Nekrassova O, Lawrence N, Compton R. Talanta. 2003;60:1085–1095. doi: 10.1016/S0039-9140(03)00173-5. [DOI] [PubMed] [Google Scholar]; (b) O’Shea T, Lunte S. Anal Chem. 1993;65:247–250. [Google Scholar]
- 9.(a) Lawrence B, Davis J, Compton R. Talanta. 2001;53:1089–1094. doi: 10.1016/s0039-9140(00)00579-8. [DOI] [PubMed] [Google Scholar]; (b) Carvalho F, Remião F, Vale P, Trimbrell J, Bastos M, Ferreira M. Biomed Chromatogr. 1994;8:134–136. doi: 10.1002/bmc.1130080308. [DOI] [PubMed] [Google Scholar]
- 10.Wang W, Escobedo J, Lawrence C, Strongin R. J Am Chem Soc. 2004;126:3400–3401. doi: 10.1021/ja0318838. [DOI] [PMC free article] [PubMed] [Google Scholar]
- 11.(a) Shahrokhian S, Amiri M. Electrochem Commun. 2005;7:69–73. [Google Scholar]; (b) Srinivasan A, Robertson L, Ludewig G. Chem Res Toxicol. 2002;15:497–505. doi: 10.1021/tx010128+. [DOI] [PubMed] [Google Scholar]
- 12.(a) Zaia D, Ribas K, Zaia C. Talanta. 1999;50:1003–1010. doi: 10.1016/s0039-9140(99)00218-0. [DOI] [PubMed] [Google Scholar]; (b) Tummuru M, Divakar T, Sastry C. Analyst. 1984;109:1105–1106. [Google Scholar]; (c) Sastry C, Satyanarayana P, Tummuru M. Analyst. 1985;110:189–191. doi: 10.1039/an9851000189. [DOI] [PubMed] [Google Scholar]
- 13.Rathathao E, Page A, Jouanin I, Paris A, Debrauwer L. Int J Mass Spectrom. 2004;231:119–129. [Google Scholar]
- 14.Baez S, Segura-Aguilar J, Widersten M, Johansson A, Mannervik B. Biochem J. 1997;324:25–28. doi: 10.1042/bj3240025. [DOI] [PMC free article] [PubMed] [Google Scholar]
- 15.Yan Z, Zhong H, Maher N, Torres R, Leo G, Calwell G, Huebert N. Drug Metabol Dispos. 2005;33:1867–1876. doi: 10.1124/dmd.105.006387. [DOI] [PubMed] [Google Scholar]
- 16.Panzella L, Napolitano A, d’Ischia M. Bioorg Med Chem. 2003;11:4797–4805. doi: 10.1016/s0968-0896(03)00460-7. [DOI] [PubMed] [Google Scholar]
- 17.Zhang F, Dryhurst G. J Electroanal Chem. 1995;398:117–128. [Google Scholar]
- 18.Scheme 1 shows two ECE mechanisms: (i) Equation I (A → D) corresponds to the formation of indicator-monothiol adduct, and (ii) eq II (C → F) corresponds to the formation of indicator-bisthiol adduct.
- 19.Seymour E, Wilkins S, Lawrence N, Compton R. Electrochemistry. 2002;35:1387–1399. [Google Scholar]
- 20.White P, Lawrence N, Tsai Y, Davis J, Compton R. Mikrochim Acta. 2001;137:87–91. [Google Scholar]
- 21.The increase in current at the oxidation potential of indicator 1 has also been suggested to arise from its catalytic reoxidation via an EC′ mechanism. Based on the mechanism presented in Scheme 1, it is possible that, as the reductive addition reaction occurs (eq I), indicator 1 is regenerated through a homogeneous oxidation reaction (C + B → A + D). Hence, this gives the effect of increased concentration of indicator A at the electrode surface and, thus, the increase in current. For details, see: Nematollahi E, Golabi S. J Electroanal Chem. 2000;481:208–214.
- 22.(a) Iverson S, Qing Hu L, Vukomanovic V, Bolton J. Chem Res Toxicol. 1995;8:537–544. doi: 10.1021/tx00046a007. [DOI] [PubMed] [Google Scholar]; (b) Gutierrez P, Siva S. Chem Res Toxicol. 1995;8:455–464. doi: 10.1021/tx00045a018. [DOI] [PubMed] [Google Scholar]
- 23.(a) Lau S, Hill B, Highet R, Monks T. Mol Pharmacol. 1988;34:829–836. [PubMed] [Google Scholar]; (b) Vina J, editor. Glutathione: Metabolism and Physiological Functions. CRC Press; Boca Raton, FL: 1990. [Google Scholar]
- 24.Nickerson W, Falcone G, Strauss G. Biochemistry. 1963;2:537–543. doi: 10.1021/bi00903a025. [DOI] [PubMed] [Google Scholar]
- 25.It has been reported that catechol-(bis-GSH) adducts or, in general, the multi-glutathionyl conjugates of catechol and hydroquinone analogues are oxidized at potentials that are more anodic than their unsubstituted and monosubstituted derivatives (refs 17 and 23).
- 26.The voltammetric behavior of 1 in the presence of GSH was measured at different scan rates (ν= 0.01–0.10 V·s−1), and it was found that the Epa values of 1–GSH and 1–(GSH)2 vary with ν. The dependence of Ep with ν is known to be inherent to irreversible systems. For details, see: Bard A, Faulkner L. Electrochemical Methods and Applications. 2. John Wiley and Sons; New York: 2001. Chapter 6.3; p. 234.
- 27.Keire D, Strauss E, Guo W, Noszal B, Rabenstein D. J Org Chem. 1992;57:1233–1243. [Google Scholar]
- 28.Carmel R, Jacobsen D, editors. Homocysteine in Health and Disease. Cambridge University Press; Cambridge, U.K: 2001. [Google Scholar]
- 29.(a) Bald E, Kaniowska E, Chwatco G, Glowacki R. Talanta. 2000;50:1233–1243. doi: 10.1016/s0039-9140(99)00235-0. [DOI] [PubMed] [Google Scholar]; (b) Wang W, Rusin O, Xu X, Kim K, Escobedo J, Fakayode S, Fletcher K, Lowry M, Schowalter C, Lawrence C, Fronczek F, Warner I, Strongin R. J Am Chem Soc. 2005;127:15949–15958. doi: 10.1021/ja054962n. [DOI] [PMC free article] [PubMed] [Google Scholar]
- 30.Though GSH is known to be the most abundant intracellular aminothiol (up to 0.01 M in liver), it also exists in plasma and other biological fluids in the micromolar range, and only a very small fraction of its total concentration in the physiological system is in its disulfide (GS-SG) form.11–15 The aminothiols HCY and CYS only exist in micromolar amounts in both cells and plasma, and less than 1% of total HCY exists as a free thiol.3,8,10,28,29
- 31.Imai Y, Ito S, Fujita K. J Chromatogr. 1987;420:404–410. doi: 10.1016/0378-4347(87)80197-4. [DOI] [PubMed] [Google Scholar]
Associated Data
This section collects any data citations, data availability statements, or supplementary materials included in this article.
Supplementary Materials
Additional information as noted in text. This material is available free of charge via the Internet at http://pubs.acs.org.


