Abstract
A new generation of high performance, time-of-flight (TOF) PET scanners have recently been developed. In earlier works the gain with TOF information was derived as a reduction of noise in the reconstructed image, or essentially a gain in scanner sensitivity. These derivations were applicable to analytical reconstruction techniques and 2D PET imaging. In this work we evaluate the gain measured in the clinically relevant task of lesion detection with TOF information in fully-3D PET scanners using iterative reconstruction algorithms. We performed measurements in a fully-3D TOF PET scanner using spherical lesions in uniform, cylindrical phantom. Lesion detectability was estimated for 10-mm diameter lesions using a non-prewhitening matched filter signal-to-noise-ratio (NPW SNR) as the metric. Our results show that the use of TOF information leads to increased lesion detectability, which is achieved with less number of iterations of the reconstruction algorithm. These phantom results indicate that clinically, TOF PET will allow reduced scan times and improved lesion detectability, especially in large patients.
1. Introduction
In recent years research in PET system development has once again returned focus towards time-of-flight (TOF) PET systems (Moses and Derenzo, 1999, Moses, 2003, Surti et al., 2003b). The early TOF PET systems were developed in the 1980’s using scintillators such as caesium fluoride (CsF) and barium fluoride (BaF2) (Allemand et al., 1980, Ter-Pogossian et al., 1982, Wong et al., 1984). The very good timing resolution achieved with these scintillators was the primary reason for their use in TOF PET systems. However, compared to the more traditional PET scintillator of choice at that time, bismuth germanate (BGO), their main drawbacks were low stopping power and low light output (Lewellen, 1998, Muehllehner and Karp, 2006). As a result, the benefits of TOF measurement capability were negated by reduced intrinsic sensitivity and spatial resolution.
The last decade has seen the advent of lutetium based scintillators (lutetium oxy-orthosilicate, LSO, and lutetium-yttrium oxy-orthosilicate, LYSO) (Melcher and Schweitzer, 1992a, Melcher and Schweitzer, 1992b, Kimble et al., 2002) which provide very high imaging performance for fully-3D PET scanners (Nutt, 2002). Besides having good characteristics such as high stopping power, short decay time, high light output, and good energy resolution, it was recently demonstrated that these scintillators also achieve very good timing resolution which enables precise TOF measurement (Moses and Derenzo, 1999, Moses, 2003, Kuhn et al., 2004). Another promising new scintillator, lanthanum bromide (LaBr3) (van Loef et al., 2001, Shah et al., 2003, Surti et al., 2003b, Kuhn et al., 2004), which has been used in the development of a proto-type TOF PET system also provides a good combination of properties beneficial for a high performance, fully-3D TOF PET system (Karp et al., 2005).
The development of these scintillators together with the increased emphasis of clinical PET imaging on whole-body oncologic situations provides the impetus for our current investigation. In a non-TOF scanner, the location of the annihilation point along the line-of-response (LOR) is not precisely known, and the reconstruction algorithm assumes a uniform probability for its location along the length of LOR lying within the object boundary. A TOF scanner, however, localizes the annihilation point along the LOR with a precise measurement of the difference in arrival times, t1 and t2, of the two annihilation photons with a Gaussian probability distribution. The error in this localization is determined by the coincidence timing resolution, Δt (full-width at half-maximum, fwhm), of the scanner. The fwhm of the spatial localization along the LOR is then calculated as Δx=c •Δt/2, where c is the speed of light. Based upon this reasoning and its implementation in a back-projection reconstruction algorithm, it was estimated that the TOF measurement is equivalent to a sensitivity gain in the image given by D/Δx (Snyder et al., 1981, Budinger, 1983), where D is the size of the object being imaged. Using a variance reduction argument, Tomitani arrived at a slightly reduced effective sensitivity gain value of D/(1.6 •Δx) (Tomitani, 1981) after including effects from image reconstruction filtering. Both these simple estimates of TOF gain were derived for analytical reconstruction and may not directly extend to iterative image reconstruction. However, they do predict that there is increased benefit with TOF measurement for large objects and improved timing resolution (small value for Δx or Δt).
The new generation of TOF PET scanners that are currently being developed operate in a fully-3D mode and are used primarily for whole body oncology imaging. This can be compared with the 1980’s when the majority of PET scanners operated in 2D mode with septa and were derived primarily for brain and cardiac imaging studies. In addition, image reconstruction is routinely performed using iterative reconstruction techniques for clinical studies instead of the analytical back-projection methods for which the sensitivity gain formulas were originally derived. Recognizing these differences, we evaluated via simulations the feasibility of estimating image improvements in modern-day TOF PET scanners based upon their primary usage in oncologic tasks (Surti et al., 2006). The simulation results showed that as timing resolution improved, the rate of contrast recovery in hot lesions increases. As a result, a fewer number of iterations for the reconstruction algorithm is needed to achieve the same or higher contrast recovery values for TOF PET compared to non-TOF PET. This is especially apparent for small, hot lesions in large phantoms. Also, when the reconstruction is stopped after a fixed number of iterations to achieve a practical reconstruction time, the contrast recovery in TOF images compared to non-TOF images was higher for similar noise levels for a given count statistics or scan time. As a result, for the smallest lesion investigated (10-mm), we found similar contrast recovery and noise behavior in TOF images as compared to non-TOF images, but with less counts or scan time. In fact, the sensitivity gain was similar to the D/Δx factor (Snyder et al., 1981, Budinger, 1983). Lesion detectability studies using a non-prewhitening matched filter signal-to-noise ratio (NPW SNR) as the metric for a signal-known exactly (SKE) task, found a non-linear increase as a function of count statistics and timing resolution. The NPW SNR gains were smaller than those predicted by the sensitivity gain estimate of (D/Δx)1/2, but they also increased with increasing object diameter and improved timing resolution.
Since completion of that simulation work, we have had a successful installation of the Philips Gemini TF PET/CT TOF scanner at our institution in 2005 (Surti et al., 2007). The benefit of time-of-flight PET for improved contrast recovery performance in hot lesions in clinical and phantom measurements was also demonstrated using this scanner (Karp et al., 2008).The primary conclusions from this work were that TOF PET not only provides improved contrast recovery and noise trade-off over non-TOF PET, but also faster convergence of contrast recovery in hot lesions (Karp et al., 2008).
The aim of this work is to experimentally determine the impact of TOF PET on improved lesion detection for oncology studies. We use small spherical lesions placed in a uniform background phantom to evaluate lesion detection with TOF PET for varying count statistics.
2. Scanner description
The Gemini TF PET/CT (Philips Medical Systems, Highland Heights, OH) is a new high performance, time-of-flight (TOF) capable, fully-3D PET scanner together with a 16-slice Brilliance CT scanner (Surti et al., 2007). The PET component of the Gemini TF is comprised of 28 modules, each consisting of a 23 × 44 array of 4 × 4 × 22-mm3 LYSO crystals. The individual modules are coupled together leading to a scanner ring diameter of 90.34-cm. Annular lead shielding (1-inch thick) at the two axial ends is used to reduce detection of events occurring outside the field-of-view (FOV). The patient bore has a diameter of 71.70-cm with active transverse and axial FOVs of 57.6 and 17.98-cm, respectively. This detector design was derived from the pixelated GSO Anger-logic detector (Surti et al., 2000) used in the G-PET brain scanner (Karp et al., 2003), and followed by the commercial whole-body Allegro PET (Surti and Karp, 2004) and Gemini PET/CT (Gregory et al., 2006, Turcotte et al., 2005) scanners from Philips. This Anger-logic detector design has characteristics of good crystal separation with uniform light collection and energy resolution. Thus, the detector performs very well with LYSO crystals that have higher light output and faster timing characteristics than GSO, and with the replacement of the 39-mm diameter photomultiplier tubes (PMTs) with the same size but faster timing performance PMTs. The system energy resolution (fwhm) for the Gemini TF scanner is 11.5% at 511 keV, which allows the default energy window to be set at 440–665 keV. The system timing resolution for this scanner measured with a point source is 585 ps (fwhm), although the data presented here were acquired with system timing resolution in the range of 785 ps. The difference is due to a combination of using early system timing calibration techniques not yet fully optimized, as well as the degradation due to count-rate effects at activity levels in the phantoms that are representative of typical 18F-FDG studies (Surti et al., 2007). With the improved timing calibration, the system timing resolution is 650–700 ps for clinical oncology studies where the detector singles rate (above trigger threshold)) is typically 15–20 Mcps. However, even with an improvement of about 100 ps, we do not expect the detectability results for TOF imaging to change significantly.
Image reconstruction was performed using a blob-based, list-mode iterative algorithm with and without TOF information (Popescu, 2004). In this work the data were arranged in 20 geometrically ordered sub-sets and an un-relaxed (λ=1) OSEM update equation was used for reconstruction. Attenuation correction was performed using the CT transmission data, while scatter was estimated using a recently developed TOF version of model-based single scatter simulation (SSS) that generates a distribution of scatter both in the radial and time bins (Werner et al., 2006). Delayed coincidence window technique was used to estimate the random coincidences in the collected data.
3. Impact of phantom size, number of iterations of reconstruction algorithm, and scan time on lesion visualization
3.1. Method
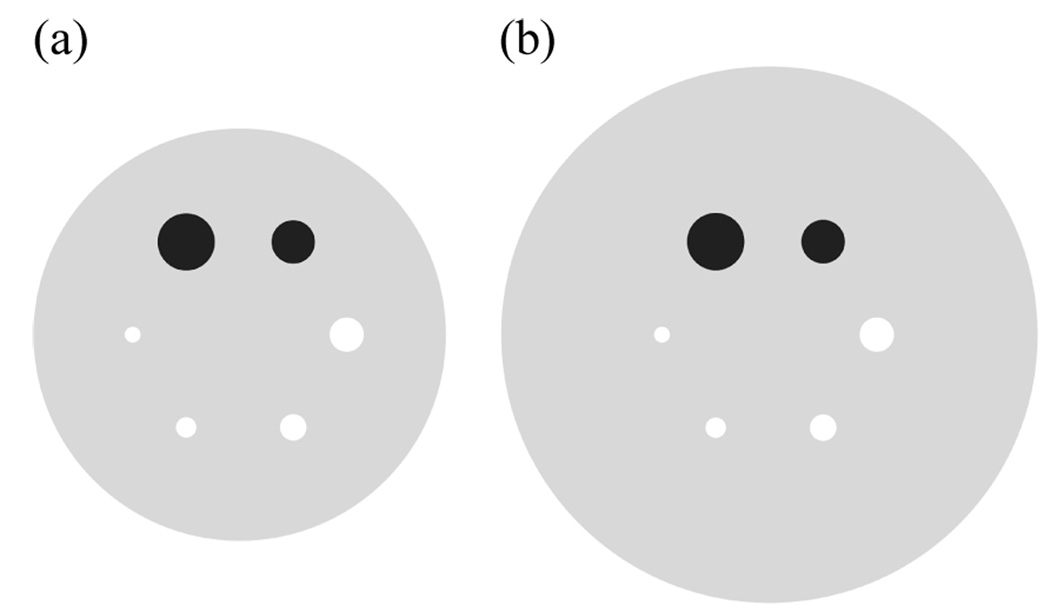
Measurements were performed using two water-filled cylinders with diameters of 27-cm (volume = 23,850 ml) of 35-cm (volume = 52,600 ml). In our experience, the 27-cm cylinder better approximates an average size patient (~140 lbs), while the 35-cm cylinder approximates a heavier patient (~210 lbs) (Surti et al., 2007). Within each of these cylinders we placed six spheres (lesions) in a single plane and at a radial distance of 7-cm from the center of the scanner. Four small spheres with diameters of 10, 13, 17, and 22-mm were filled with activity concentration of 6:1 with respect to the background. The two larger spheres with diameters of 28 and 37-mm were filled with cold water (see Figure 1). The plane containing the spheres in these two lesion phantoms was placed near the center of the FOV for imaging. To simulate activity outside the FOV, a uniform 20-cm diameter by 30-cm long cylinder (volume = 9425 ml) was placed axially adjacent to the lesion phantoms as well. The activity concentration in this adjacent cylinder was the same as that in the background region of the lesion phantoms. Data were acquired at a total activity of 266 MBq (7.2 mCi) and 259 MBq (7.0 mCi) in the 27-cm and 35-cm phantom setups, corresponding to a background activity concentration of 8.2 kBq/ml (0.22 µCi/cc) and 4.1 kBq/ml (0.11 µCi/cc), respectively, at start of scan. The singles rate in the scanner was 21Mcps and 16Mcps for the 27-cm and 35-cm phantoms, which corresponds to effective system coincidence timing resolution of 785 ps. Data reconstruction was performed using the list-mode reconstruction with 20 geometrically ordered sub-sets and a relaxed OSEM update.
Figure 1.
A transverse view of six spherical lesions placed at a radial distance of 7-cm from the center of (a) 27-cm and (b) 35-cm diameter cylindrical phantoms. The two large spheres with diameters of 37 and 28-mm were filled with cold water. The four smaller spheres with diameters of 22, 17, 13, and 10-mm had an activity concentration of 6:1 with respect to the background.
3.2. Results
In Figure 2 we show the central slices from TOF and non-TOF reconstructed images from the 40 minutes scan as a function of iteration number for the 35-cm lesion phantom. Visually, we observe that while the noise texture in both sets of images changes as the iteration number increases, the visual detectability of the small 10-mm diameter sphere does not change significantly after the first few iterations. The TOF images appear to have higher detectability than the non-TOF images over all iterations. Since the visual detectability of the lesions does not change appreciably after 20 iterations, we limit the numerical detectability evaluation to reconstructed images with up to 20 iterations for practical reasons.
Figure 2.
Central slices from reconstructed images (scan time of 40 minutes) of the 35-cm lesion phantom. The top row contains images from TOF reconstruction while the bottom row has the non-TOF reconstruction images. Moving from left to right, the images represent iteration numbers of 1, 5, 10, 15, 20, 25, and 30.
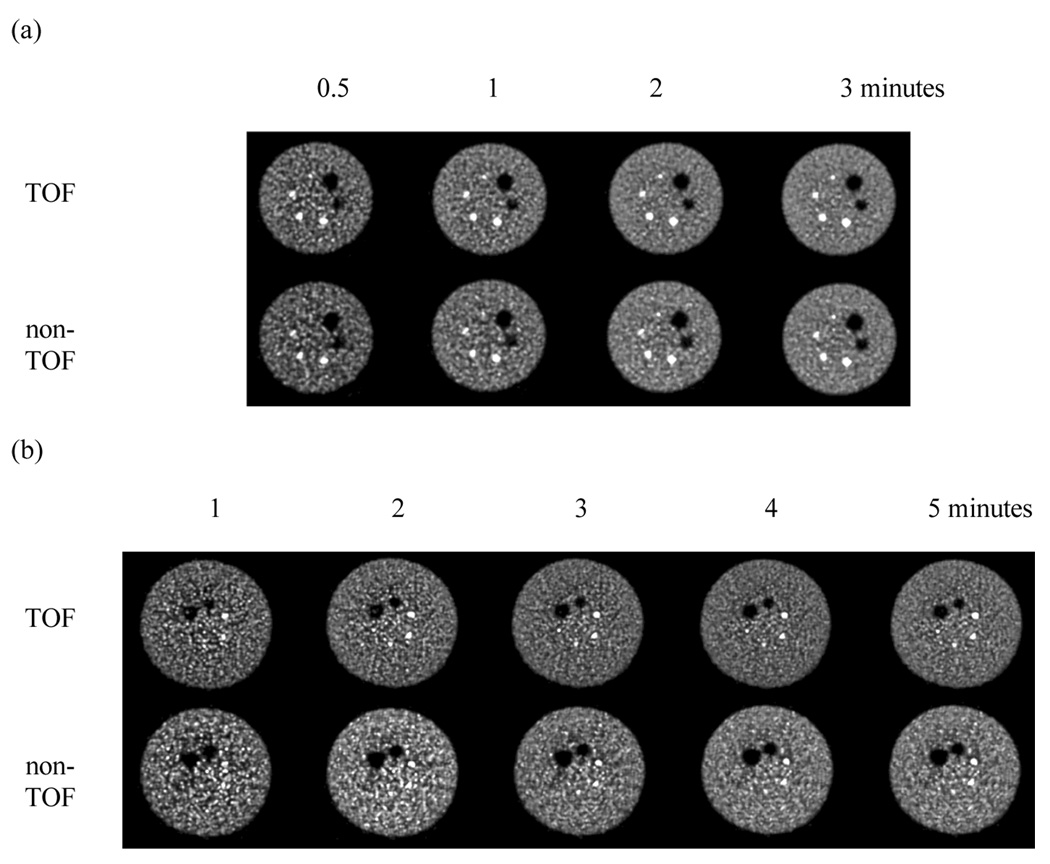
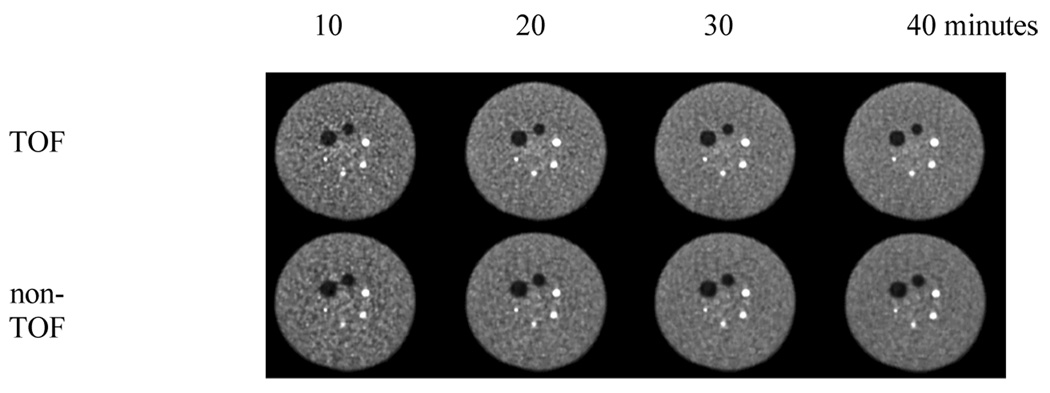
Figure 3 shows representative slices from reconstructed images of the 27-cm and 35-cm lesion phantoms with and without TOF reconstruction for varying scan times (images after 20 iterations are shown). As expected, images within each series (same phantom and type of reconstruction) look less noisy as the imaging time is increased. The noise characteristics in the TOF and non-TOF images for both phantoms are similar for the same number of iterations. However, the sharpness of the small hot lesions is improved with the TOF reconstruction. For practical scan times of 5 minutes or less and non-TOF reconstruction, we observe that the 10-mm hot lesion in the larger 35-cm phantom is not visible, but it is visible after 2–3 minutes scan time and TOF reconstruction. To further demonstrate that longer scan times are needed for better detection of the small lesion with non-TOF reconstruction, we show in Figure 4 representative slices for the 35-cm lesion phantom after longer scan times of 10–40 minutes. After a 10 minutes scan, the small lesion is now clearly visible in the non-TOF images. Based upon these results, for quantitative evaluation of lesion detection, we restricted ourselves to the challenging setup of 10-mm spheres in the 35-cm diameter phantom. Also, we restricted our evaluation to practical and clinically relevant scan times of 5 minutes.
Figure 3.
Central slices from reconstructed images of the (a) 27-cm and (b) 35-cm lesion phantoms. In both sets the top row contains images from TOF reconstruction while the bottom row has the non-TOF reconstruction images. In (a), moving left to right, the images represent scan times of 0.5, 1, 2, and 3 minutes. Similarly, in (b) moving left to right, the images represent scan times of 1, 2, 3, 4, and 5 minutes. All images are after 20 iterations and 20 subsets.
Figure 4.
Central slices from reconstructed images of the 35-cm lesion phantoms. The top row contains images from TOF reconstruction while the bottom row has the non-TOF reconstruction images. In moving left to right, the images represent scan times of 10, 20, 30, and 40 minutes. All images are after 20 iterations and 20 subsets.
4. Lesion detectability measurement
4.1. Method
Measurements were performed using a 35-cm diameter water-filled (volume = 30,100 ml). Within this cylinder we placed six spheres in a single plane and at a radial distance of 8-cm from the center of the scanner (Figure 5). All six spheres had a diameter of 10-mm and were filled with an activity concentration of 6:1 with respect to the background. The plane containing the spheres was placed at ¼ the center of the FOV for imaging. To simulate activity outside the FOV, a uniform 20-cm diameter by 30-cm long cylinder (volume = 9425 ml) was placed axially adjacent to the lesion phantom as well. The activity concentration in this adjacent cylinder was the same as that in the background region of the lesion phantoms. Data were acquired at a total activity of 237 MBq (6.4 mCi), corresponding to a background activity concentration of 3.8 kBq/ml (0.16 µCi/cc) at start of scan. The singles rate in the scanner was 20Mcps, which corresponds to effective system coincidence timing resolution of 785 ps. Data reconstruction was performed using the list mode-reconstruction for varying scan times with eight replicates for each scan time. Lesion detectability for a signal known exactly and background known exactly (SKE/BKE) task was estimated using the signal-to-noise ratio of a matched non-prewhitening observer (NPW SNR). As shown previously (Myers and Barrett, 1987, Myers et al., 1985), the matched non-prewhitening observer agrees well with human observer performance for SKE/BKE situation in a uniform, non-lumpy background with correlated noise. Furthermore, the non-prewhitening SKE/BKE observer has been shown to be proportional to the average performance of human observers in simple detection tasks (Wagner and Brown, 1985). Lesion detection in a uniform background, while not generally being the case in all clinical oncology tasks, is relevant in some clinical tasks such as lesions present in the liver, which is somewhat uniform. The non-prewhitening observer is a linear observer and its observer response variable is given by the scalar (dot) product
| (1) |
where fi is a sample reconstructed image and 〈fi〈 is the ensemble mean, for the i-th class with i=1 for signal present class and i=0 for signal absent class of images. Lesion detectability or NPW SNR is then defined as:
| (2) |
where is the mean of the observer response variable of the i-th class and its corresponding variance.
Figure 5.
A transverse view of six spherical 10-mm diameter lesions placed at a radial distance of 8-cm from the center of 35-cm diameter cylindrical phantom for lesion detectability measurements. The spheres had an activity concentration of 6:1 with respect to the background.
In the reconstructed images, four slices centered over the spheres were summed (8-mm thick resultant “signal” slice) in order to reduce variability in the data due to imperfect centering of spheres in a single slice. For the target present class, a square template of 21 pixels wide (4.2-cm) was placed around each of the six spheres in the “signal” slice for all eight independent data replicates. This results in a total of 48 realizations for the signal present class. For signal absent class the process was repeated with the templates placed at the exact same positions as the spheres, but in a summed slice (8-mm thick “background” slice) in the same axial position but opposite to “signal” slice (at ¼ the axial FOV from the opposite end of the scanner to the “signal” slice) (Moore et al., 2000, Surti et al., 2003a, El Fakhri et al., 2004). Error estimation was performed using standard error propagation techniques (Abbey et al., 1997).
4.2. Results
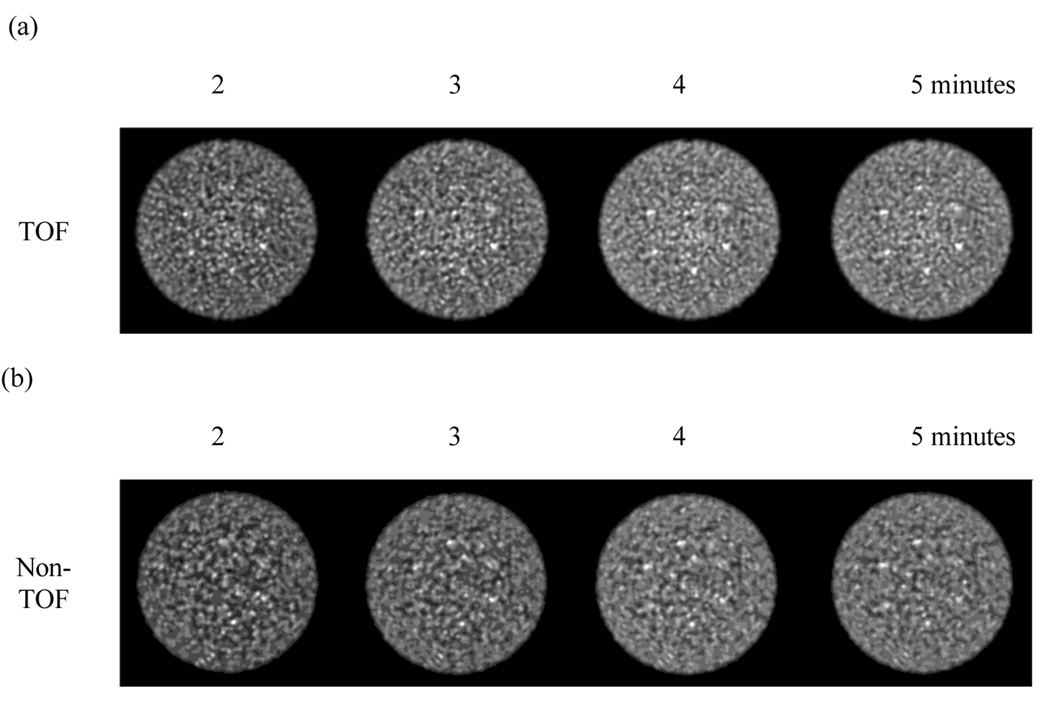
Figure 6 shows a central 10-mm thick slice for the reconstructed images of the lesion phantom for detectability studies with and without TOF information. These images are shown after 20 iterations of the reconstruction algorithm. Although we show a single realization in this figure, these images are representative and show that the 10-mm lesions are just visible with non-TOF reconstruction after a 5 minutes scan time, whereas TOF reconstruction renders them visible after a 2–3 minutes scan.
Figure 6.
Central 10-mm thick slice from reconstructed images) of the 35-cm lesion detectability phantom. In (a) we show images from TOF reconstruction while (b) shows the non-TOF images. Moving left to right within each set represents increasing scan times of 2, 3, 4, and 5 minutes. All images are after 20 iterations and 20 subsets.
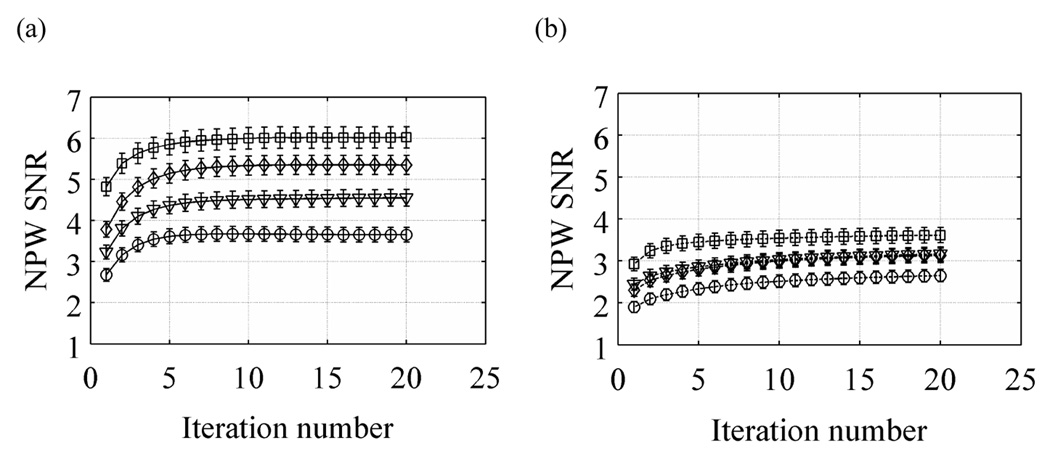
In Figure 7 we show selected plots for lesion detectability as measured with the NPW SNR metric. Results are shown as a function of iteration number for scan times of 2, 3, 4, and 5 minutes. These results show that with TOF information the NPW SNR increases faster as a function of iteration number compared to the non-TOF images. Also, in both cases the convergence rate to highest detectability is independent of scan time. These results also show that, overall, TOF information leads to improved lesion detectability (NPW SNR) for all scan times. In particular, the NPW SNR value after a 5 minutes scan with non-TOF information is similar to the NPW SNR value for a 2 minutes scan with TOF information.
Figure 7.
Plot of NPW SNR as a function of iteration number for varying scan times in the 35-cm lesion detectability phantom. Left column shows results from TOF reconstructions while the right column has the non-TOF reconstruction results. The curves within each plot are for varying scan times of 2 (○), 3 (▽), 4 (◊), and 5 minutes (◻). The error bars represent one sigma error estimate.
In order to better understand the behavior of NPW SNR values, we also calculated the contrast recovery coefficient (CRCj) and pixel noise (Noisej) for each of the 48 sphere realizations. The count density, CH,j, in the j-th sphere was determined by the mean number of counts in a circular region-of-interest (ROI) drawn over the center of that sphere in the “signal slice” (10-mm diameter). Similarly, the background count density, CB,j, was determined by the mean number of counts in a circular ROI drawn at the sphere location in the “background slice” (10-mm diameter). The CRCj and Noisej were then calculated as
| (3) |
and
| (4) |
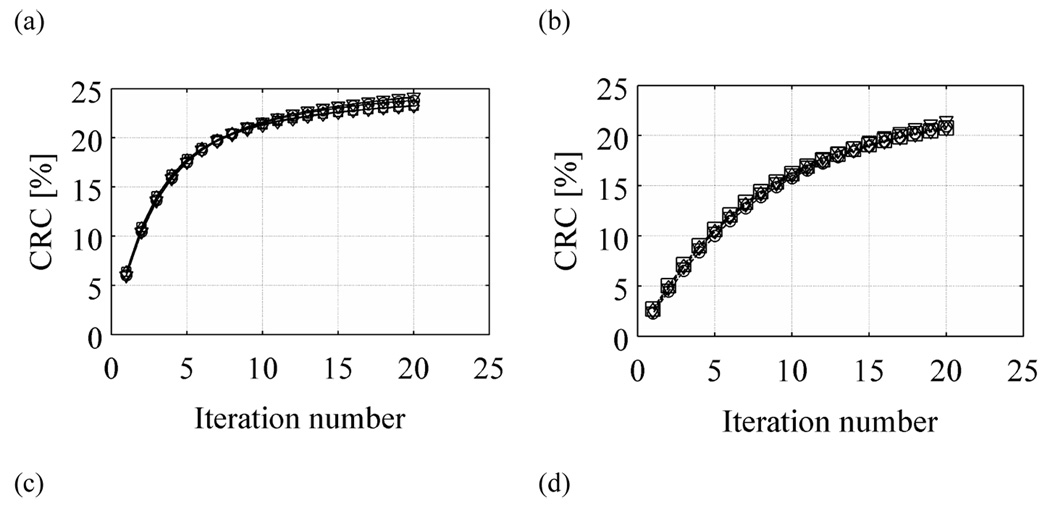
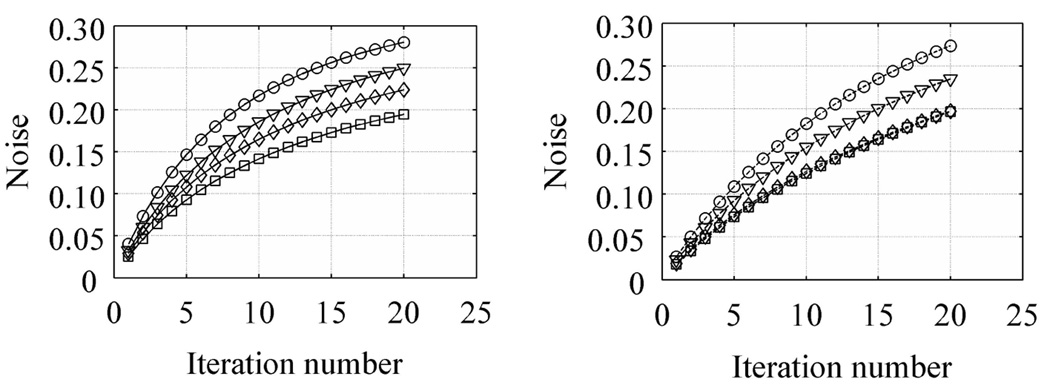
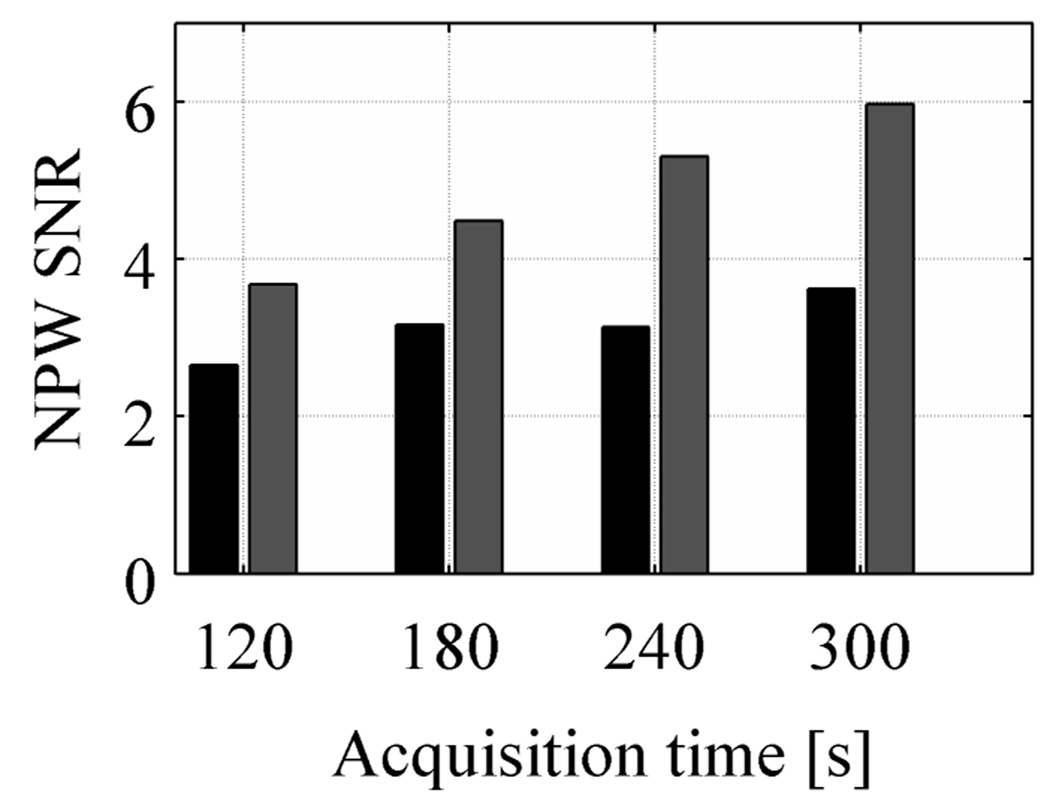
where uptake is the real activity concentration in the sphere with respect to background (6 here), and σB,j is the standard deviation of counts in the background ROI for sphere number j. The CRC is defined in a manner analogous to that in the NEMA NU2-2001 standards (2001). In Figure 8 we plot the average CRC and Noise measures over all 48 real sphere realizations as a function of iteration number. Our results show that for both TOF and non-TOF reconstruction, and for all scan times, similar CRC values can be achieved after iterating longer. However, due to a faster convergence of TOF reconstruction, the CRC value achieved after the first few iterations is higher for TOF reconstruction. The Noise in the two reconstructions is similar for a given iteration number. Hence, the NPW SNR value in TOF reconstruction converges faster and to higher value compared to the non-TOF reconstruction of the same data set. In Figure 9 we plot the maximum NPW SNR value for varying scan times and TOF and non-TOF reconstructions. There is improved lesion detectability with TOF information. The relative gain in NPW SNR due to TOF varies between 1.4 for short acquisition times to 1.6 for longer acquisition times. We also notice that the NPW SNR values for a 2 minutes scan time with TOF is similar to the NPW SNR value for a 5 minutes scan time without TOF information.
Figure 8.
Plots of CRC (a and b) and Noise (c and d) as a function of iteration number for varying scan times in the 35-cm lesion detectability phantom. Left column (a and c) shows result from TOF reconstructions while the right column (b and d) has the non-TOF reconstruction results. The curves within each plot are for varying scan times of 2 (○), 3 (▽), 4 (◊), and 5 minutes (◻).
Figure 9.
A chart showing the NPW SNR values as a function of scan time for TOF (light bars) and non-TOF (dark bars) reconstructions. There is a systematic improvement with TOF reconstruction for all scan times.
5. Discussion and conclusions
With a series of measurements we have evaluated the imaging benefits achieved with a TOF PET scanner for a simplified routine clinical oncology task of lesion detection. Our data confirm previous results (Karp et al., 2008) which showed that TOF information leads to an improved CRC-Noise trade-off compared to non-TOF PET. Improved lesion detection in TOF PET, while explainable as a consequence of improved CRC-Noise trade-off, is, however, not an obvious conclusion to reach. Our results show that for a fixed scan time and iteration number, both non-TOF and TOF reconstructed images have similar noise behavior, with TOF being slightly worse especially for shorter scan times. However, because of its fast convergence, the CRC value is higher with TOF information for the same number of iterations. This leads to improved lesion detectability in a uniform background as measured with the NPW SNR metric for SKE/BKE task. These results are shown in Figure 7. Increasing the number of iterations leads to increased CRC values for both TOF and non-TOF reconstructions but at the expense of increased noise. As a result, TOF reconstructed images achieve close to a maximum NPW SNR value after six iterations and slowly increases after that. With non-TOF reconstruction the NPW SNR value increases slowly up to the maximum 20 iterations that we investigated here. Even after 20 iterations the NPW SNR value with non-TOF reconstruction is not as high as the TOF reconstruction value. Our results with varying scan times show that in the 35-cm diameter phantom, the maximum NPW SNR value achieved after a 2 minutes scan and TOF reconstruction is higher than that achieved after a 5 minutes scan and non-TOF reconstruction. The NPW SNR metric indicates an SNR gain of 1.4–1.6 using TOF, which is in agreement with the previous simulation results (Surti et al., 2006).
In this work we were interested in keeping the algorithm the same for both TOF and Non-TOF reconstructions. In order to limit the number of parameters, we chose one algorithm: list-mode OSEM with smooth blobs as the basis function. By using the same unrelaxed OSEM algorithm with blob-based reconstruction (fixed spatial resolution and globally controlled noise) for TOF and Non-TOF data, we show improved lesion detection with TOF data. With minimal parameter values to adjust, these results, in our opinion, reflect a general trend observable with TOF PET.
Previous work has shown that TOF information produces improved images for all patient sizes (Karp et al., 2008), but has a bigger impact as the patient size increases. Also, due to the high conventional imaging capabilities of the new generation of TOF PET scanners together with reduced attenuation in small size patients, it may be more beneficial to reduce the scan times for small to average patients while retaining maximum diagnostic capabilities. However, for heavier patients where there is still a significant loss in image quality for the non-TOF reconstructed images, keeping scan times fixed could lead to improved patient prognosis with TOF PET. Clinically, therefore, we conclude that TOF PET will have maximum benefit in the detection of small lesions in large patients.
6. Future Work
Our investigation involved a simplified task of lesion detection in a uniform background for a SKE/BKE situation. While this has some relevance to a clinical study interpretation, for example searching for lesions in uniform lung or liver backgrounds, in other situations the tissue background is non-uniform and the conclusions of this study may be limited. As a result, an extension of this work will be the evaluation of lesion detectability in a non-uniform background similar to a clinical study. We are proceeding with such an investigation by inserting lesions in a normal patient background in a variety of locations, and plan to vary, scan times, lesion contrast, and reconstruction methdf (TOF vs non-TOF). Numerical observers such as the channelized hotelling observer, as well as human observers, will be used for these evaluations.
Acknowledgments
We would like to thank Dr. Austin Kuhn previously of the Physics & Instrumentation Group at the University of Pennsylvania for his help in acquiring the data, Matthew Werner of the Physics & Instrumentation Group at the University of Pennsylvania for his help with data processing and image reconstruction, and Dr. Georges El Fakhri of Massachusetts General Hospital, Harvard Medical School for useful discussions. Dr. Margaret E. Daube-Witherspoon and Dr. Samuel Matej of the University of Pennsylvania provided important input related to image reconstruction. This work was supported by the National Institutes of Health grant Nos. R33-EB001684 and R01-CA113941.
Contributor Information
S Surti, Email: surti@mail.med.upenn.edu.
J S Karp, Email: joelkarp@mail.med.upenn.edu.
References
- Performance Measurements of Positron Emission Tomographs. Washington, DC: National Electrical Manufacturers Association; 2001. NEMA Standards Publication NU 2-2001. [Google Scholar]
- Abbey CK, Barrett HH, Eckstein MP. Practical issues and methodology in assessment of image quality using model observers. Proc. SPIE Intl. Soc. Opt. Eng. 1997 [Google Scholar]
- Allemand R, Gresset C, Vacher J. Potential advantages of a cesium fluoride scintillator for a time-of-flight positron camera. J. Nucl. Med. 1980;21:153–155. [PubMed] [Google Scholar]
- Budinger TF. Time-of-Flight Positron Emission Tomography - Status Relative to Conventional PET. J. Nucl. Med. 1983;24:73–76. [PubMed] [Google Scholar]
- El fakhri G, Badawi RD, Surti S, Holdsworth CH, Kinahan PE, Karp JS, Lewellen TK. Is Noise Equivalent Count rate a good surrogate of lesion detectability in whole-body PET? J. Nucl. Med. 2004;45:164P. [Google Scholar]
- Gregory R, Partridge M, Flower MA. Performance evaluation of the Philips "Gemini" PET/CT system. IEEE Trans. Nucl. Sci. 2006;53:93–101. [Google Scholar]
- Karp JS, Kuhn A, Perkins AE, Surti S, Werner ME, Daube-witherspoon ME, Popescu LM, Vandenberghe S, Muehllehner G. Characterization of TOF PET scanner based on Lanthanum Bromide. In: Seibert JA, editor. 2005 IEEE Nuclear Science Symposium and Medical Imaging Conference; IEEE Nuclear & Plasma Sciences Society; San Juan, Puerto Rico. 2005. [Google Scholar]
- Karp JS, Surti S, Daube-witherspoon ME, Freifelder R, Cardi CA, Adam LE, Bilger K, Muehllehner G. Performance of a brain PET camera based on anger-logic gadolinium oxyrorthosilicate detectors. J. Nucl. Med. 2003;44:1340–1349. [PubMed] [Google Scholar]
- Karp JS, Surti S, Daube-witherspoon ME, Muehllehner G. Benefit of Time-of-Flight in PET: Experimental and Clinical Results. J Nucl Med. 2008;49:462–470. doi: 10.2967/jnumed.107.044834. [DOI] [PMC free article] [PubMed] [Google Scholar]
- Kimble T, Chou M, Chai BHT. Scintillation properties of LYSO crystals. Nuclear Science Symposium Conference Record, 2002 IEEE. 2002 [Google Scholar]
- Kuhn A, Surti S, Karp JS, Raby PS, Shah KS, Perkins AE, Muehllehner G. Design of a lanthanum bromide detector for time-of-flight PET. IEEE Trans. Nucl. Sci. 2004;51:2550–2557. [Google Scholar]
- Lewellen TK. Time-of-Flight PET. Sem. Nucl. Med. 1998;28:268–275. doi: 10.1016/s0001-2998(98)80031-7. [DOI] [PubMed] [Google Scholar]
- Melcher CL, Schweitzer JS. A Promising New Scintillator - Cerium-Doped Lutetium Oxyorthosilicate. Nucl. Instr. Meth. (A) 1992a;314:212–214. [Google Scholar]
- Melcher CL, Schweitzer JS. Cerium-Doped Lutetium Oxyorthosilicate - a Fast, Efficient New Scintillator. IEEE Trans. Nucl. Sci. 1992b;39:502–505. [Google Scholar]
- Moore SC, El fakhri G, Badawi RD, Van den abbeele AD, Zimmerman RE. Relative lesion detectability in 3D vs 2D dedicated multi-ring PET. In: Seibert JA, editor. 2000 IEEE Nuclear Science Symposium and Medical Imaging Conference; IEEE Nuclear & Plasma Sciences Society; Lyons, France. 2000. [Google Scholar]
- Moses WW. Time of flight in PET revisited. IEEE Trans. Nucl. Sci. 2003;50:1325–1330. [Google Scholar]
- Moses WW, Derenzo SE. Prospects for time-of-flight PET using LSO scintillator. IEEE Trans. Nucl. Sci. 1999;46:474–478. [Google Scholar]
- Muehllehner G, Karp JS. Positron emission tomography. Phys Med Biol. 2006;51:R117–R137. doi: 10.1088/0031-9155/51/13/R08. [DOI] [PubMed] [Google Scholar]
- Myers KJ, Barrett HH. Addition of a channel mechanism to the ideal-observer model. J. Opt. Soc. Am. A. 1987;4:2447. doi: 10.1364/josaa.4.002447. [DOI] [PubMed] [Google Scholar]
- Myers KJ, Barrett HH, Borgstrom MC, Patton DD, Seeley GW. Effect of noise correlation on detectability of disk signals in medical imaging. J. Opt. Soc. Am. A. 1985;2:1752. doi: 10.1364/josaa.2.001752. [DOI] [PubMed] [Google Scholar]
- Nutt R. Is LSO the future of PET? For. Eur. J. Nucl. Med. 2002;29:1523–1525. doi: 10.1007/s00259-002-0987-y. [DOI] [PubMed] [Google Scholar]
- Popescu LM. Iterative image reconstruction using geometrically ordered subsets with list-mode data. In: Seibert JA, editor. 2004 IEEE Nuclear Science Symposium and Medical Imaging Conference; IEEE Nuclear & Plasma Sciences Society; Rome, Italy. 2004. [Google Scholar]
- Shah KS, Glodo J, Klugerman M, Moses WW, Derenzo SE, Weber AJ. LaBr3 : Ce scintillators for gamma-ray spectroscopy. IEEE Trans. Nucl. Sci. 2003;50:2410–2413. [Google Scholar]
- Snyder DL, Thomas LJ, Terpogossian MM. A Mathematical-Model for Positron-Emission Tomography Systems Having Time-of-Flight Measurements. IEEE Trans Nucl Sci. 1981;28:3575–3583. [Google Scholar]
- Surti S, Badawi RD, Holdsworth CH, El fakhri G, Kinahan PE, Karp JS. A multi-scanner evaluation of PET image quality using phantom studies. In: Metzler SD, editor. 2003 IEEE Nuclear Science Symposium and Medical Imaging Conference; IEEE Nuclear & Plasma Sciences Society; Portland, OR. 2003a. [Google Scholar]
- Surti S, Karp JS. Imaging characteristics of a 3-dimensional GSO whole-body PET camera. J. Nucl. Med. 2004;45:1040–1049. [PubMed] [Google Scholar]
- Surti S, Karp JS, Freifelder R, Liu F. Optimizing the performance of a PET detector using discrete GSO crystals on a continuous lightguide. IEEE Trans. Nucl. Sci. 2000;47:1030–1036. [Google Scholar]
- Surti S, Karp JS, Muehllehner G, Raby PS. Investigation of lanthanum scintillators for 3-D PET. IEEE Trans. Nucl. Sci. 2003b;50:348–354. [Google Scholar]
- Surti S, Karp JS, Popescu LA, Daube-witherspoon ME, Werner M. Investigation of time-of-flight benefit for fully 3-D PET. IEEE Trans. Med. Imag. 2006;25:529–538. doi: 10.1109/TMI.2006.871419. [DOI] [PubMed] [Google Scholar]
- Surti S, Kuhn A, Werner ME, Perkins AE, Kolthammer J, Karp JS. Performance of Philips Gemini TF PET/CT scanner with special consideration for its time-of-flight imaging capabilities. J Nucl Med. 2007;48:471–480. [PubMed] [Google Scholar]
- Ter-pogossian M, Ficke D, Yamamoto M, Jt H. Super PETT I: A Positron Emission Tomograph utilizing photon time-of-flight information. IEEE Trans. Nucl. Sci. 1982;M1-1:179–187. doi: 10.1109/TMI.1982.4307570. [DOI] [PubMed] [Google Scholar]
- Tomitani T. Image-Reconstruction and Noise Evaluation in Photon Time-of-Flight Assisted Positron Emission Tomography. IEEE Trans. Nucl. Sci. 1981;28:4582–4589. [Google Scholar]
- Turcotte E, Lepage M, Croteau E, Kolthammer J, Gagnon D, Benard F. Performance evaluation of a new Zr-GSO PET/CT scanner based on the NEMA NU 2-2001 standard. J. Nucl. Med. 2005;46:206P. [Google Scholar]
- Van loef EVD, Dorenbos P, Van eijk CWE, Kramer K, Gudel HU. High-energy-resolution scintillator: Ce3+ activated LaBr3. Appl Phys Lett. 2001;79:1573–1575. [Google Scholar]
- Wagner RF, Brown DG. Unified SNR analysis of medical imaging systems. Phys Med Biol. 1985;30:489–518. doi: 10.1088/0031-9155/30/6/001. [DOI] [PMC free article] [PubMed] [Google Scholar]
- Werner ME, Surti S, Karp JS. Implementation and Evaluation of a 3D PET Single Scatter Simulation with TOF Modeling; 2006 IEEE Nuclear Science Symposium and Medical Imaging Conference; San Diego, CA. 2006. [Google Scholar]
- Ng WH, Mullani NA, Wardworth G, Hartz RK, Bristow D. Characteristics of Small Barium Fluoride (BaF2) Scintillator for High Intrinsic Resolution Time-of-Flight Positron Emission Tomography. IEEE Trans. Nucl. Sci. 1984;31:381–386. [Google Scholar]


