Abstract
Pulmonary influenza infection causes prolonged lymph node hypertrophy while processed viral antigens continue to be presented to virus-specific CD8 T cells. We show that naïve, but not central/memory, nucleoprotein (NP)-specific CD8 T cells recognized antigen-bearing CD11b+ DC in the DLN more than 30 days after infection. After these late transfers the naïve CD8 T cells underwent an abortive proliferative response in the mediastinal lymph node (MLN), where large clusters of partially-activated cells remained in the paracortex until at least a week after transfer. A majority of the endogenous NP-specific CD8 T cells that were in the MLN between 30–50 days after infection also showed signs of a continuing response to antigen stimulation. A high frequency of endogenous NP-specific CD8 T cells in the mediastinal lymph node indicates that late antigen presentation may help shape the epitope dominance hierarchy during reinfection.
Keywords: Antigen presentation, immunodominance, memory CD8 T cells
Introduction
Influenza virus infections induce robust CD8 T cell responses which assist in viral clearance. Although pre-existing virus-specific memory CD8 T cells cannot prevent a new infection, they can provide short-term heterosubtypic immunity as shown by reduced viral titers in the lungs after secondary challenge [1;2]. Although T cell mediated immunity to influenza virus infection has been extensively analyzed it remains unclear why heterosubtypic immunity disappears within a few months [1] while large numbers of virus-specific memory CD8 T cells remain in the circulation for at least two years [3]. Some investigators have suggested that antigen persistence plays an instrumental role in protective cellular immunity particularly for localized infections of peripheral tissues such as the lungs [4;5], however no underlying mechanism has been described. This idea is supported by the presence of activated virus-specific CD8 T cells in the respiratory tract during the months following influenza and other respiratory virus infections [6–9]. Although infectious influenza virus cannot be detected beyond about 10 days post infection (d p.i.) we and others were able to show that processed viral antigens continued to be presented to virus-specific CD8 T cells in the draining lymph nodes (DLN) of the respiratory tract until at least two months after infection [9;10]. Endogenous NP-specific CD8 T cells, which showed signs of a response to late antigen presentation, were retained near the site of infection while the processed viral antigens were present [9]. Although a great deal of attention is currently being focused on elucidating the mechanisms that govern naïve T cell activation during acute infections, very little is known about the antigen presenting cells (APC) that participate in the late antigen presentation (i.e. after the contraction of the effector T cell response), or the role that persistent antigen presentation in discrete anatomical niches such as the DLN may play in shaping the virus-specific T cell response.
To address these questions we used flow cytometry and scanning confocal microscopy to analyze the responses of transferred and endogenous NP-specific CD8 T cells to late antigen-presentation (>30d pi). We show that CD11b+ DC present processed NP antigen to naïve, but not central/memory CD8 T cells long after the contraction of the effector T cell response. High frequencies of activated endogenous NP-specific CD8 T cells in the MLN indicate that late antigen presentation may contribute to a shift in epitope dominance during reinfection. These results have important implications for immunity, since some virus-specific memory T cells are likely to be protected from ‘exhaustion’ or ‘anergy’ during prolonged antigen presentation. In addition, since memory CD8 T cells can kill some DCs in vivo [11] their inability to recognize the CD11b+ APCs could be essential for antigen persistence.
Results
Naïve F5 cells respond to antigen-bearing APCs in the DLN
We previously used NP366–374/Db-specific CD8 T cells from F5 RAG−/− TcR transgenic mice [12] to map the duration of antigen presentation after influenza virus infection [9]. The naïve F5 cells were able to detect NP antigen in the DLN more than a month after infection as shown by CFSE-dilution. To further investigate the mechanism of this late T cell activation we have used scanning confocal microscopy to follow interactions between the transferred F5 cells and antigen-bearing APCs within the anatomical environment of the DLN.
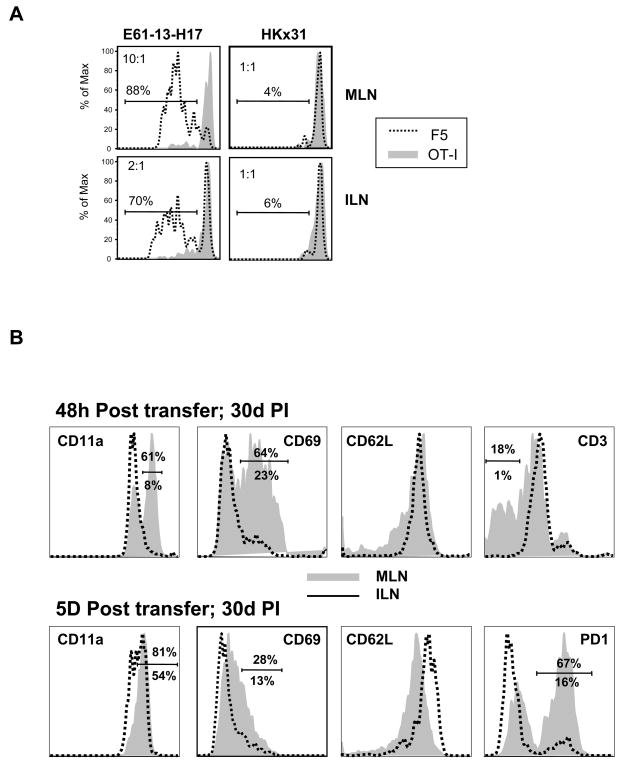
To analyze F5 T cell activation mice were infected with the reassortant influenza virus E61-13-H17 which expresses the NP366–374 peptide sequence that is recognized by CD8 T cells from F5 TcR transgenic mice [12]. Other mice were infected with HKx31 which is an identical to E61-13-H17 except for two amino acids in the NP peptide which prevent F5 activation [13]. C57BL/6 mice clear the E61-13-H17 and HKx31 viruses from the lungs with very similar kinetics (not shown). One month after infection the mice received mixed populations of naïve CFSE-labeled CD8 T cells from CD45.1+ F5 mice or control cells from CD45.1/CD45.2+ OT-I [14] TcR transgenic mice (ratio 1:1 as shown in the control mice). Six days after the transfer peripheral lymph nodes from the recipient mice were analyzed for dividing CD8 T cells by flow cytometry using the CD45.1 and CD45.2 markers (Fig 1A). The transferred F5 cells did not divide in control mice that had been infected with HKx31 and OT-I cells did not divide in either group of animals. The F5 cells only initiated cell division in the mice that had been infected with E61-13-H17 as shown by dilution of the CFSE dye on day 6 after transfer. The CFSE-dull cells that were detected in the ILN of the E61-13-H17 infected mice were most likely cells that entered the circulation after activation, since we have not been able to detect late antigen presentation at this site [9].
Figure 1. Late T cell activation is antigen-specific.
Naïve CD45.1+ F5 and CD45.1/CD45.2+ OT-I cells were CFSE-labeled and then transferred to mice that had been infected with E61-13-H17 or HKx31 30 days earlier.
A) Six days after transfer lymphocytes from the MLN and ILN were analyzed for dividing CD8 T cells using the CFSE-dye, CD45.1 and CD45.2 markers. Gated populations of transferred CD8 T cells are shown. The ratios of F5 to OTI cells are shown (top left). Marked regions indicate percentages of F5 cells that divided at least once.
B) Naïve CD45.1+ F5 cells were CFSE-labeled and transferred to mice 30 days after E61-13-H17 infection. Gated populations of CD45.1+ F5 cells in the MLN and ILN were analyzed for CD11a, CD69, CD62L, CD3 and PD-1 expression 48h (top) and 5 days (bottom) after transfer. Percentages of cells in the marked regions are shown; MLN (top) ILN (bottom).
Most of the F5 cells that reached the MLN upregulated CD11a and CD69 within 48hrs of transfer and CD3 was downregulated (Fig. 1B). By 5d after transfer CD11a was uniformly upregulated and many cells expressed PD-1 at high levels. In contrast to other effector T cells which typically lack CD62L expression, the transferred F5 cells maintained CD62L expression throughout the response to late antigen stimulation and only 10–15% were able to make IFNγ in response to in vitro restimulation (not shown). These data supported our previous conclusion that the transferred F5 cells were only partially-activated during late antigen presentation [9]. The partially-activated phenotype of the transferred cells was not substantially changed when 100 fold fewer cells were transferred on day 30 after infection (not shown). A very similar phenotype was also detected when the transfers were performed between15–25 d p.i. suggesting that a change in the mechanism of antigen presentation, which prevented full effector T cell generation, took place soon after the contraction of the effector T cell response (not shown). Other F5 cells that were transferred to B cell-deficient (uMT) mice 30 days after E61-13-H17 infection gave almost identical results demonstrating that neither B cells nor antibodies played an essential role in late antigen presentation to NP-specific CD8 T cells.
Partially-activated F5 cells remain clustered in the MLN during late antigen presentation
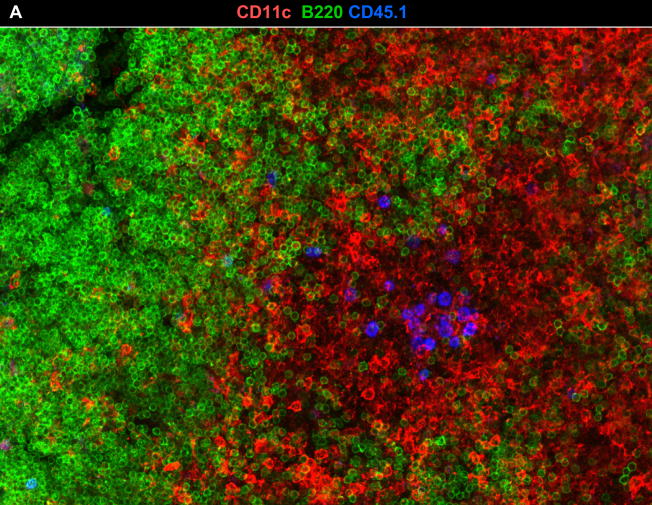
To follow late CD8 T cell activation in situ, CFSE-labeled F5 cells were transferred to E61-13-H17 mice 30d p.i as above. On different days after transfer the MLN from the recipient mice were fixed and cut into 300μm sections using a vibratome to facilitate access to internal tissue. Stained sections were analyzed by scanning confocal microscopy and images were reconstructed from Z-stack composites (Fig. 2). Antibodies to CD11c and B220 were used to identify T and B cell areas of the MLN respectively. These studies revealed increasingly large aggregates of F5 cells in the paracortex of the MLN between 3–7 days after transfer. Representative examples are shown in Figure 2.
Figure 2. Naïve F5 cells formed stable aggregates in the DLN during late activation.
Naïve CD45.1+ F5 cells were transferred to mice that were infected with either E61-13-H17 30 days previously.
A) MLNs were fixed 7d after transfer and 300 μm sections were analyzed with antibodies to CD11c (red), CD45.1 (blue) and B220 (green). A 60μm z stack was acquired using a 20×0.8 NA dry objective. A representative example of clustered F5 cells in the T cell area of the MLN is shown.
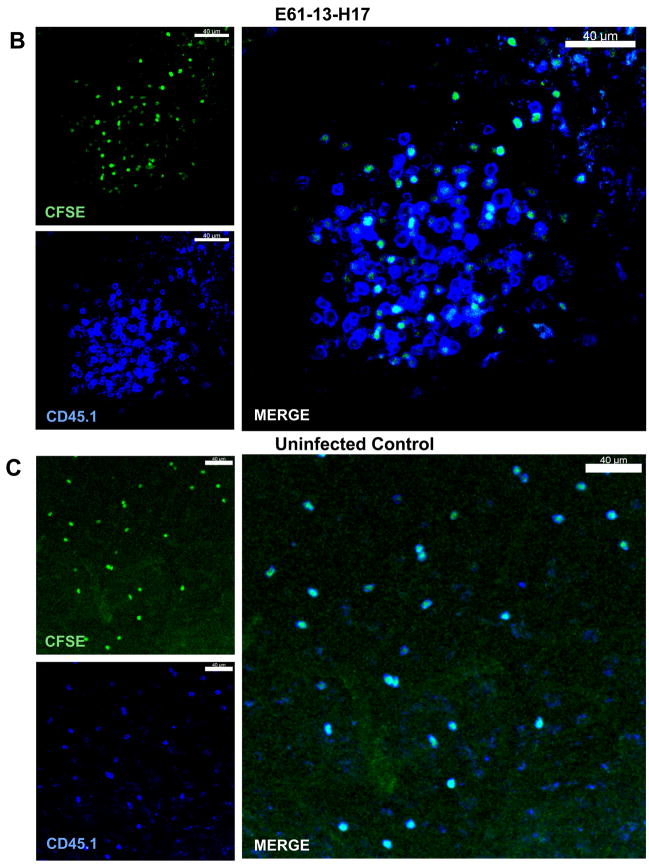
B) Large aggregates of F5 cells in the MLN include both CFSE+ and CFSE− CD45.1+ cells 7d after transfer (top). C) No aggregates of F5 cells were detected in the peripheral lymph nodes of the uninfected control animals. Merged z stacks 24 μm (B) and 40 μm (C) thick are shown. Images were acquired using a 20× 0.8 NA objective.
The spot-check™ function of the Imaris Surpass Suite indicated that there were ~100–120 F5 cells in these clusters on day 3 after transfer (not shown), however some aggregates had increased considerably in size by day 7 after transfer (Fig. 2B top panels). The presence of both CFSE+ and CFSE− F5 cells suggested that the aggregates included late arrivals and were not the progeny of individual T cell clones. No similar groups of transferred F5 cells were found in uninfected control mice (Fig. 2C, bottom panels). An inverse correlation between the size of the transferred F5 cells and the intensity of the CFSE-dye was evident by line scan analysis (not shown) indicating that the F5 cells were blasting as they divided. The aggregates of F5 cells had largely dispersed by day 14 after transfer, although many F5 cells remained in the paracortex of the MLN.
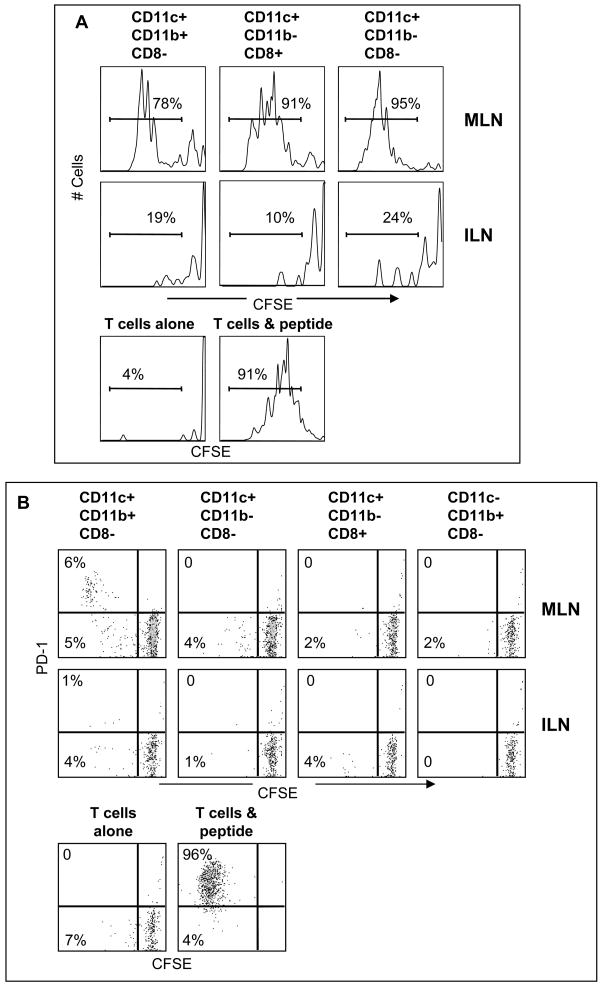
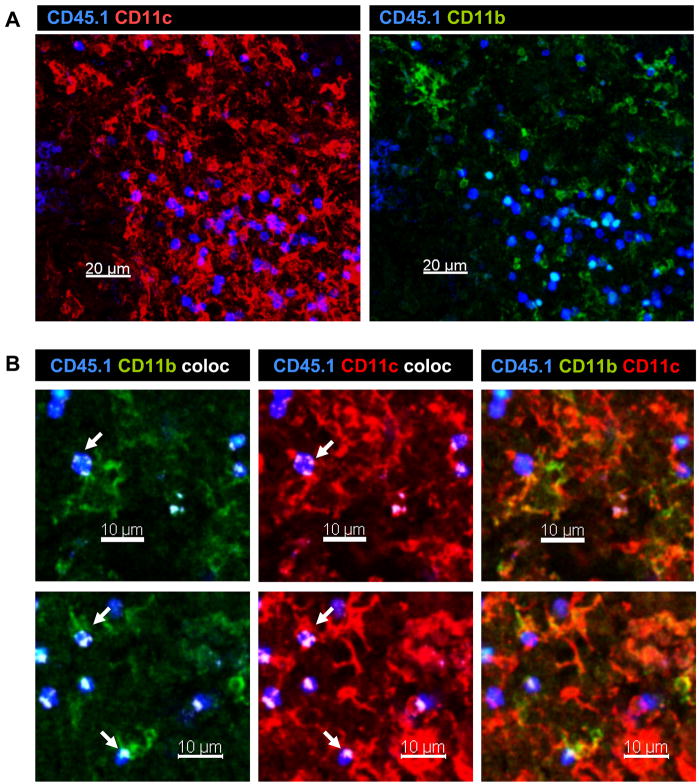
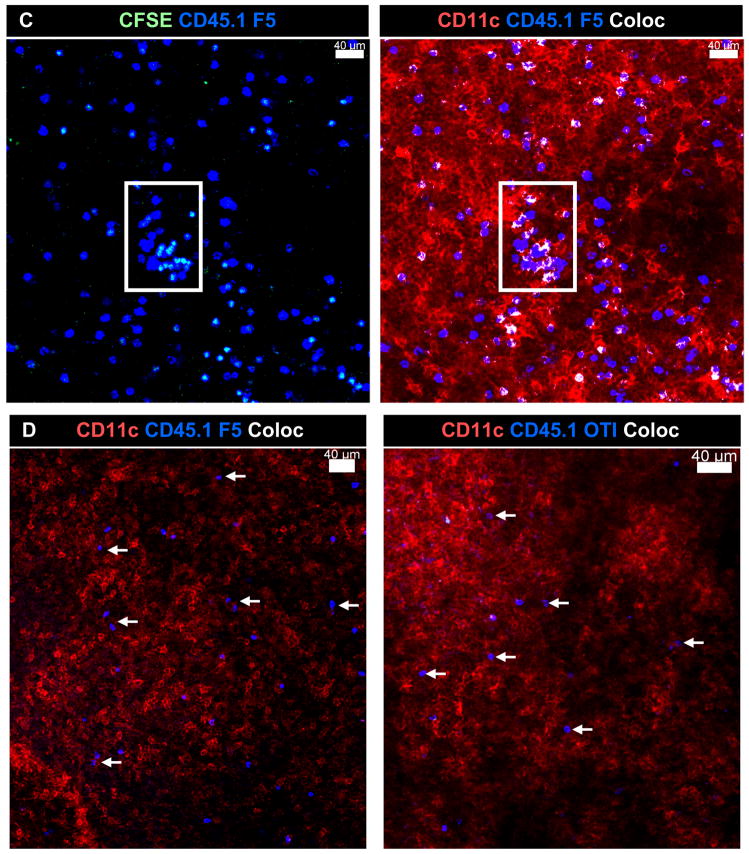
To determine which DC were participating in late antigen presentation (<30d p.i.) we purified different subsets of CD11c+ cells based on CD8 and CD11b expression (Fig 3). When DC were purified from the MLN on day 8 after E61-13-H17 infection both CD11b+ and CD11b− DC induced the naïve F5 cells to initiate cell division in vitro without a requirement for added peptides (Figure 3A). In contrast, by 30d pi only wells that received CD8−CD11b+ DC contained detectable numbers of dividing F5 cells that expressed PD-1 which is a marker of recently stimulated CD8 T cells [15] (Figure 3B). These studies indicated that CD11b+ DC were participating in late antigen presentation to the naïve F5 cells. We used the Imaris® colocalization program to analyze for close contacts between the transferred F5 cells and CD11b+ DC in situ. High magnification images showed extensive areas of close contact (white areas) between CD11c+ CD11b+ DC and transferred F5 cells, as illustrated using single 2μm slices (Figs. 4A–C). Larger areas of white coloring indicate more extensive areas of close contact. The Imaris program did not reveal extensive interactions between transferred F5 cells and CD11c+ APCs in control animals that were preinfected with HKx31, or animals that received naïve OTI cells (Fig. 4D).
Figure 3. Purified CD11b+ DC stimulate cell division by naïve F5 cells in vitro.
A) CD11c+ cells were purified from the MLN and ILN 8d after E61-13-H17 infection. CD11c+ cells were further subdivided using anti-CD11b and anti-CD8 antibodies and sterile FACS sorting. Naïve CFSE-labeled F5 cells were cultured (2×10⁴ cells/well) with 5u/ml rIL-2 and sorted APCs (3–5×10⁴ cells/well) in vitro for 4 days as shown. Gated populations of live CD45.1+ CD8 T cells are shown. The F5 peptide (1ug/ml) was used as a positive control for cell division. Three independent experiments gave very similar results.
B) Different subsets of CD11c+ cells were purified 30d p.i. with E61-13-H17 and cultured (3–5×10⁴ cells/well) with naïve CFSE-labeled F5 cells (2×10⁴ cells/well) 5u/ml rIL-2 in vitro for 4 days as shown. Gated populations of live CD45.1+ F5 cells analyzed for CFSE and PD-1 expression are shown. Three independent experiments gave very similar results.
Figure 4. Naïve F5 cells interact with CD11b+ DC in vivo.
A) CFSE-labeled F5 cells were transferred to E61-13-H17 infected mice 30d p.i. On d3 after transfer fixed sections of MLN were analyzed with antibodies specific for CD45.1 (blue) and CD11c (red) and CD11b (green). Z stack images were acquired using the 20× 0.75 NA dry objective.
B) Two micron slices were analyzed for areas of direct contact (shown in white) between; CD11c (red) and CD45.1 (blue) staining; or CD11b (green) and CD45.1 (blue) staining. Many other similar interactions were detected in the MLN. Representative images are shown.
C) Bystander T cells did not aggregate in the MLN after influenza virus infection. F5 cells were transferred to E61-13-H17 or D) HKx31 (lower left) infected mice 30d p.i. and analyzed 6 days later. OT-I cells were transferred to E61-13-H17 infected mice 30d p.i. and analyzed 6 days later (right). Interactions between transferred T cells and CD11c+ APCs are shown in white. Images were acquired using 20× 0.75 NA dry objective. Voxel size: 0.64 × 0.64 × 2 μm. Merged Z stacks are shown.
NP-specific memory CD8 T cells preferentially express an activated phenotype in the DLN
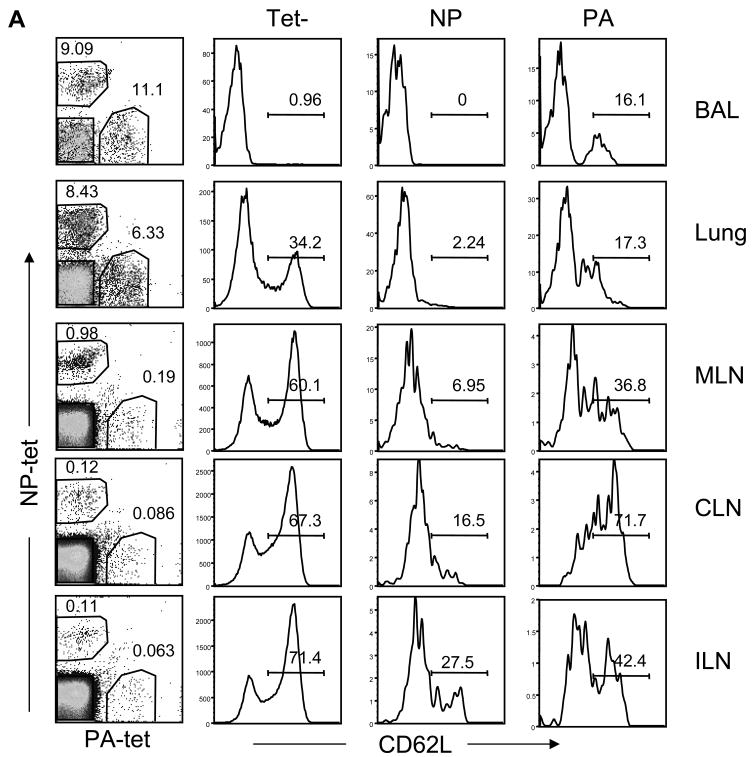
To investigate whether the endogenous NP-specific CD8 T cells were responding to late antigen presentation in the DLN (>30d p.i.), we compared the activation markers on the virus-specific T cells with tetramer-negative CD8 T cells in the different tissues (Figure 5). Others have shown that after primary influenza virus infection, NP-specific CD8 T cells are represented in similar numbers as acid polymerase (PA)-specific CD8 T cells in most tissues, however the NP-specific CD8 T cells become dominant (by about 5:1) during secondary influenza infection [16;17]. Consistent with these studies we found similar numbers of PA and NP-specific cells in the lungs (Fig. 5A) and spleen (not shown) after primary infection. However a majority of the mice had considerably larger numbers of NP- than PA-specific CD8 T cells in the MLN 30d p.i. (~ 4:1), indicating a shift toward NP dominance at the site of late antigen presentation which has not been reported previously. We have obtained consistent results from a large numbers of animals that were analyzed between 20–50 days after E61-13-H17 infection and also mice that were infected with either HKx31 or WSN-OVAI (not shown). This skewing in favor of NP dominance in the MLN during primary infection was very similar to the ratio observed in the lungs during heterosubtypic challenge [16–18](and data not shown).
Figure 5. High frequencies of activated endogenous NP-specific CD8 T cells were detected in the MLN 30d p.i.
(A) The ratios of NP and PA-specific CD8 T cells in different tissues were recorded 30 days after infection with E61-13-H17 (left panels) and analyzed for CD62L expression. Dot plots show gated populations of CD8 T cells with percentages of tetramer+ cells. Histograms are gated tetramer+ and tetramer- CD8 T cells with percentages of cells positive for CD62L. Other experiments with HKx31 and WSN-OVAI infected mice gave similar results (data not shown).
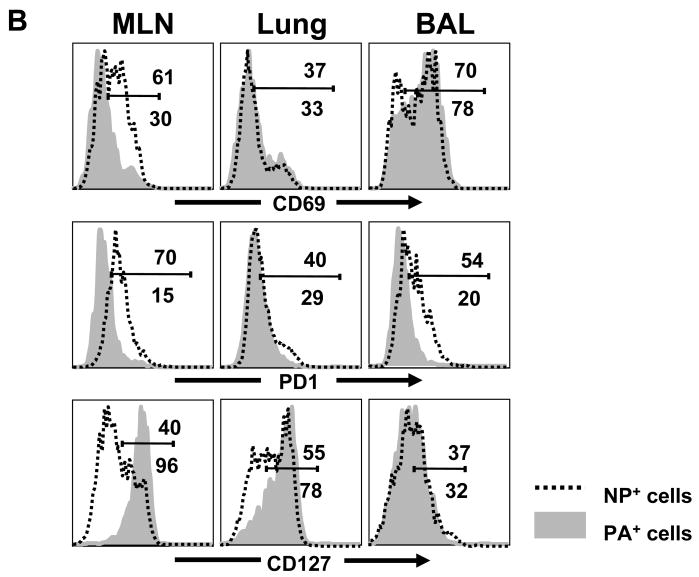
(B) NP and PA-specific CD8 T cells in the MLN, lung and BAL fluid were analyzed for CD69, PD-1, and IL-7R expression. Gated tetramer+ cells are shown with percentages of cells in marked regions: MLN (top) ILN (bottom).
Most of the NP and PA-specific cells that were in the lungs 30d pi lacked CD62L expression indicating that they were effector or effector/memory T cells [19]. More surprisingly, almost all of the endogenous NP-specific T cells that were recovered from the lymphoid tissues also lacked CD62L expression indicating a systemic effector or effector/memory T cell response to the NP antigen. There were only small numbers of PA-specific T cells that in the MLN 30d p.i. which included some CD62L+ cells indicating the presence of some central/memory T cells (Figure 5A).
Reduced CD62L expression is a marker for both effector and effector/memory T cells. We therefore analyzed the NP and PA-specific CD8 T cells for other evidence of recent antigen stimulation (Figure 5B). Although most of the NP-specific CD8 T cells in the MLN lacked IL-7Rα expression, most of the PA-specific cells were IL-7Rα+ which is a characteristic of resting memory T cells [20]. Large percentages of NP-specific T cells in the MLN also expressed CD69 and PD-1, which were largely absent from the PA-specific T cells at this site (Fig 5B). Together these data indicated that the NP-specific CD8 T cell population in the MLN was primarily composed of effector CD8 T cells (more than 65% made IFNγ in vitro), while the PA-specific CD8 T cells were mixed populations of memory CD8 T cells. Although we do not have the means to directly examine presentation of the PA antigen after infection, the contrasting phenotypes of the two subsets of tetramer+ T cells indicated that the NP antigen may have been expressed at higher levels in MLN than the PA antigen.
Visualization of endogenous NP366–374/Db-specific CD8 T cells in the MLN
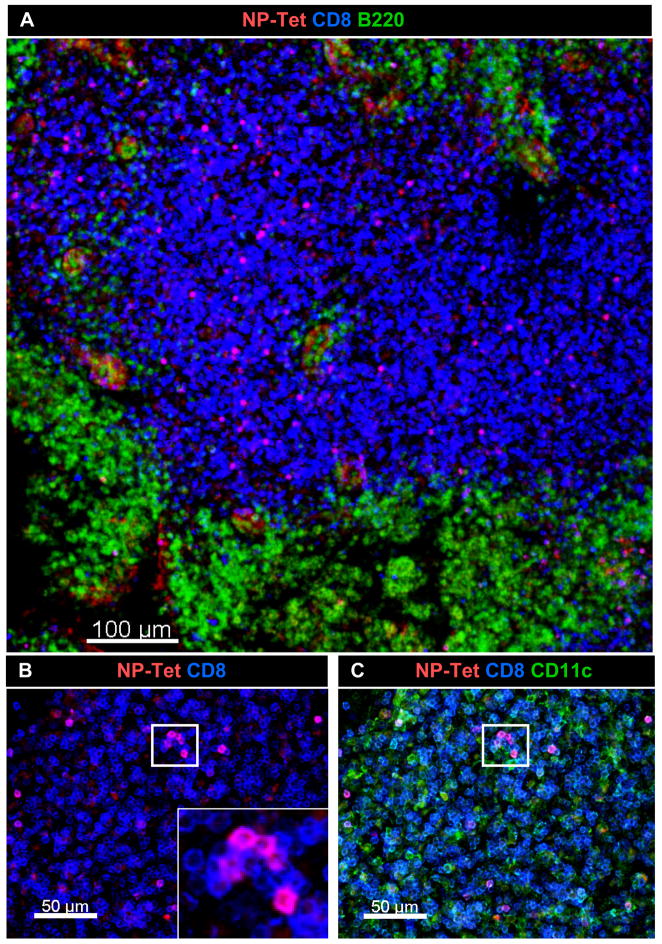
Parabiosis indicated that some endogenous NP-specific CD8 T cells were retained in the MLN during late antigen presentation [9]. Their activated phenotype was also consistent with a continuing response to antigen stimulation (Fig 6B). We used in situ MHC class I tetramer analysis and confocal microscopy [21;22] to examine the spatial arrangement of the NP-specific CD8 T cells in the MLN during late antigen presentation. Sections (300 μm) of MLN were stained with the NP-tetramer (red), anti-CD8 (blue) and either anti-B220 (Fig 7A) or anti-CD11c (green)(Fig 6C). These studies revealed substantial numbers of NP-specific cells CD8 T cells in the paracortex of the MLN (Fig. 6A), with higher concentrations in some areas which included several micro-clusters of tetramer+ cells (Fig 6B and C). This distribution of endogenous NP-specific T cells in the MLN 30d p.i. was similar to the distribution of F5 cells that were analyzed 14 days after transfer (not shown) showing that the endogenous NP specific cells were near the site of late antigen presentation.
Figure 6.
High concentrations of endogenous NP-specific CD8 T cells were found in localized areas of DLN. Thirty days after E61-13-H17 infection, 300 μm sections of MLN were stained with MHC class I tetramers. Sections of fixed MLN were stained with the NP tetramer (red), anti-CD8 (blue) and either (A) anti-B220 or (B &C) anti-CD11c (green). Original images were acquired using 20× 0.75 NA dry objective. Voxel size: 0.64 × 0.64 × 2 μm.
Figure 7. Central memory F5 cells enter the DLN but do not respond to late antigen presentation.
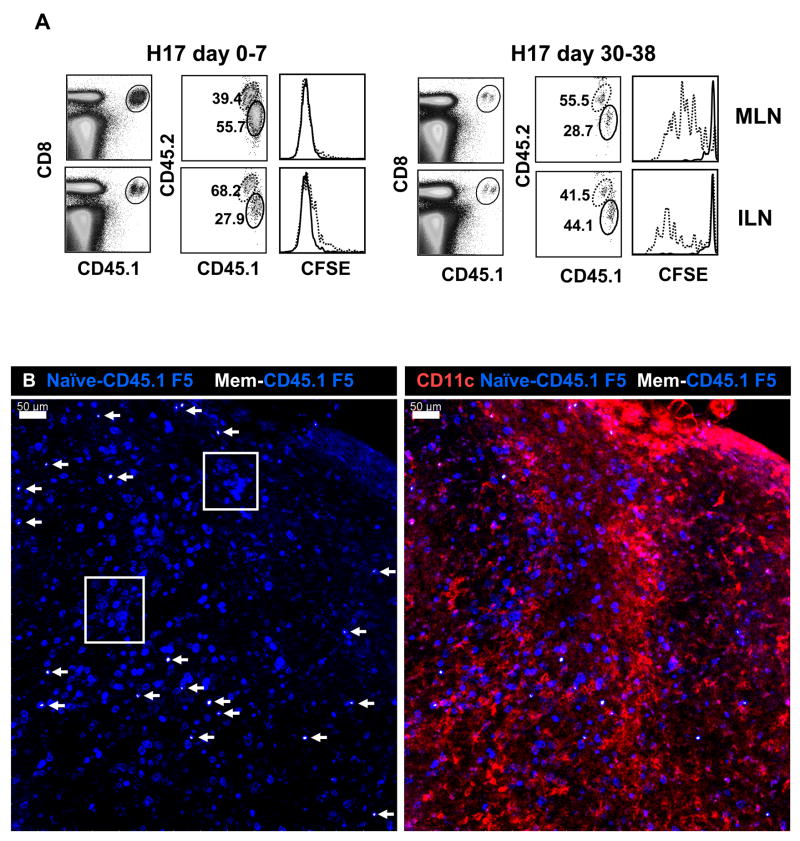
A) CD45.1+ F5 memory cells were isolated from influenza virus infected mice by sterile FACS sorting. The memory cells were mixed (1:1 ratio) with naïve F5 cells (CD45.1+ CD45.2+) before CFSE labeling. Mice received 2×10⁵ mixed cells either one day before (left panel) or 30 days after (right panel) E61-13-H17 infection. Overlaid histograms show CFSE analysis of naïve (dashed) and memory (continuous line) F5 cells on day 8 after transfer.
B) Purified CD45.1+ F5 memory cells were CFSE-labeled and then mixed with naive CD45.1+ F5 cells before transfer to E61-13-H17 infected mice (30d p.i.). On day 7 after transfer, the MLN were cut into 300 μm sections and stained as indicated. Memory cells were identified by CFSE and CD45.1 staining (white/blue) and naïve cells (blue). Merged z stack (60 μm thick) is shown. Boxed regions indicate clusters of naive F5 cells. Image was acquired using a 10× 0.45 NA water objective with a Voxel size of 0.9 × 0.9 × 8.9 μm.
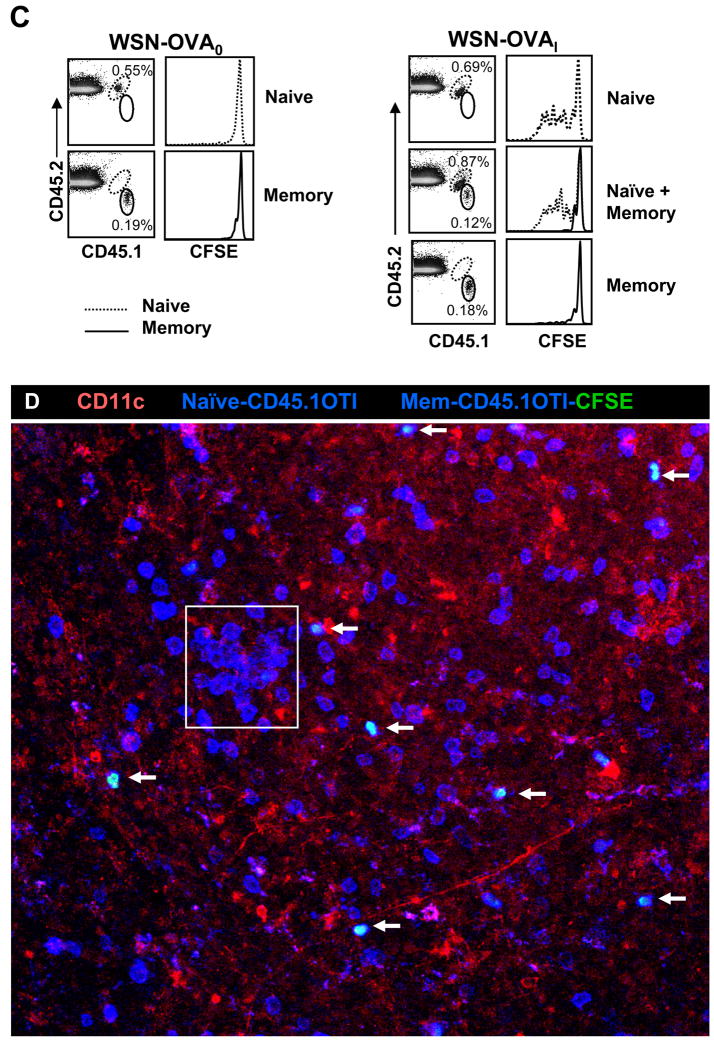
C) OT-I memory CD8 T cells do not respond to antigen in DLN of WSN-OVAI infected mice. Sorted CD45.1+ OT-I memory cells that were induced by LM-OVA infection four months earlier were isolated by negative-selection and transferred separately, or together with naïve CFSE-labeled CD45.1+CD45.2+ OT-I cells, to mice that were infected 30 days earlier with WSN-OVAI or WSN-OVA0. On day 5 after transfer the MLN were analyzed for transferred CD8 T cells using the CD45.1 and CD45.2 markers (dot plots). Overlaid histograms show CFSE analysis of naïve (dotted) memory CD8 T cells (continuous line).
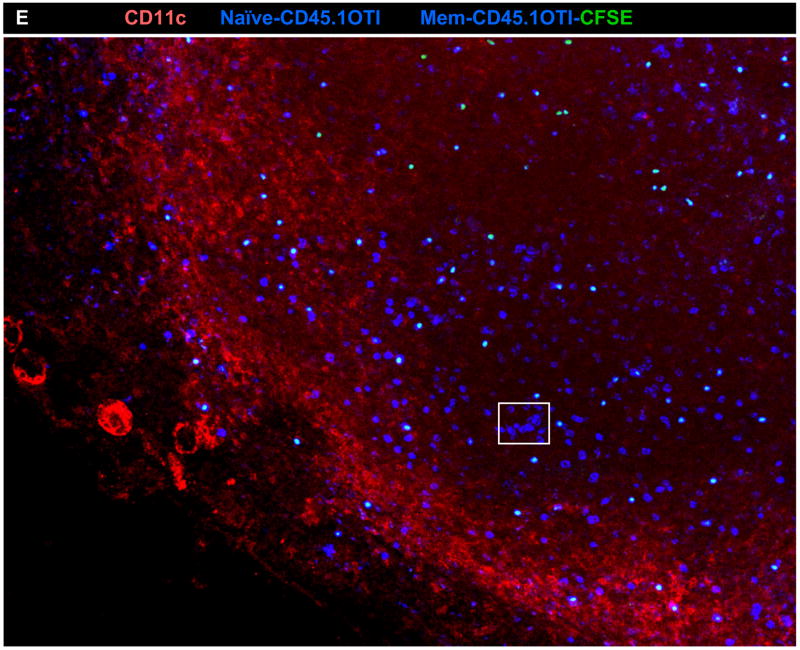
D) Purified CD45.1+ OTI memory CD8 T cells were labeled with CFSE and mixed with naïve F5 cells before transfer to mice that were infected with WSN-OVAI 30 days previously. 300 μm sections were stained with anti-CD45.1 (blue) and anti-CD11c (red). Z stack images taken with (B) 20× 0.75 NA dry objective and (C) 10× 0.45 NA water objective.
Central memory CD8 T cells do not detect antigen in the DLN late after infection
It was recently reported that influenza-specific memory CD8 T cells do not recognize antigens that are presented to naïve CD8 T cells by CD11b− CD8 T cells during acute influenza virus infection [23]. Since our studies showed that CD11b+ DC were responsible for late antigen presentation to naïve F5 cells (Figs 3 and 4), we investigated whether memory CD8 T cells were responsive to late antigen presentation. To make a supply of memory CD8 T cells for the transfer studies, naïve CD8 T cells from CD45.1+ F5 mice were transferred to C57BL/6 mice one day before E61-13-H17 infection. Three months later the CD45.1+ F5 cells were purified from the spleen and peripheral lymph nodes by sterile FACS sorting.
To analyze F5 T cell activation be flow cytometry, purified memory cells were mixed with equal numbers of naïve CD45.1+ CD45.2+ F5 cells before CFSE-labeling. The recipient mice were injected with mixed F5 cells (105 each) either one day before or 30 days after E61-13-H17 infection (Fig. 7A). Both naïve and memory F5 cells responded vigorously to acute infection with E61-13-H17 as evidenced by the loss of CFSE (left panels). Although many naïve F5 cells also began dividing in the MLN 30d p.i. central/memory F5 cells in the same lymph node did not divide as shown by a complete absence of CFSE-dilution during flow analysis (right panels).
We also analyzed the distribution of transferred F5 cells during activation using confocal microscopy (Fig 7B). In this case the purified CD45.1 F5 memory T cells were labeled with the CFSE-dye before they were mixed with unlabeled naive CD45.1+ CD45.2+ F5 cells (Figure 7B). While substantial numbers of transferred memory F5 cells were detected in the paracortex of the MLN on day 7 after transfer (marked with arrows) they remained small in size and did not aggregate in areas where clusters of naive F5 cells were found (Fig. 7B boxed regions). Very similar results were obtained when OT-I[14] memory T cells, were transferred to mice that were previously infected with WSN-OVAI influenza virus [24] (Fig 7C–D). The OTI memory cells did not reveal any sign of activation after transfer by flow cytometry (changed CD69, IL-7R, PD-1 expression or CFSE-dilution) regardless of whether they were transferred alone, or together with naïve OTI cells (Figure 7C and data not shown). Together these data showed that the central/memory CD8 T cells failed to respond to antigen that was presented to naïve CD8 T cells by CD11b+ DC in the DLN 30d p.i. even though they were fully responsive to antigen stimulation during acute viral infection.
Discussion
Influenza infection triggers the migration of large numbers of antigen-bearing DC from the infected lungs to the DLN where they present processed antigens directly to T cells, or transfer the antigen to other DC which stimulate naïve T cell activation [25–27]. We have shown that naïve NP-specific CD8 T cells recognize both CD11b− and CD11b+ DC in the MLN during acute influenza infection (8–10d pi). It is unclear why these results differ from the recent report of Belz et al who found that naïve CD8 T cells were only able to respond to CD11b− DC analyzed 7–11d pi [23], although different influenza epitopes were analyzed. Others have shown that respiratory tract DC (RTDC) which transported inhaled antigens to the DLN after aerosol exposure included both CD11b+ and CD11b− DC which were recognized by naïve CD8 T cells [28]. We further extend our results by showing that the CD11b+ DC are responsible for antigen presentation >30d pi, which has not been analyzed previously. Although naïve F5 cells initiated cell division in the DLN more than a month after infection, many cells underwent an abortive proliferative response and did not become fully differentiated. This incomplete differentiation may have prevented many F5 cells from entering the circulation. Some central/memory F5 cells also entered the MLN 30d pi but did not exhibit any sign of activation (changed CD69, CD127 or PD-1 expression and CFSE-dilution) and remained small in size. We obtained very similar results with two different strains of influenza virus (E61-13-H17 and WSN-OVAI). This difference in the ability of naïve and memory CD8 T cells to recognize antigen-bearing CD11b+ DC was similar to the observations of Belz et al when CD11b− DC were analyzed earlier in the response (before d11). The mechanism that is required for memory CD8 T cells to recognize antigen-bearing DC in vivo is not known but may require an unidentified costimulatory molecule as recently postulated by Belz et al [23]. Alternatively, since naïve and memory T cells express different repertoires of chemokine receptors [29] it is possible that the central/memory T cells were not able to locate the antigen-bearing APC in situ. The inability of the virus-specific memory CD8 T cells to respond to antigen-bearing DC could be important for protective immunity since they may be protected from exhaustion during prolonged antigen-presentation. Conversely, antigen-bearing CD11b+ DC may persist longer in vivo by virtue of the fact that they are not susceptible to deletion by virus-specific memory CD8 T cells.
Because prolonged antigen presentation has important implications for protective immunity, we analyzed the endogenous virus-specific CD8 T cells for signs of a response to continuing antigen stimulation after the contraction of the effector T cell response. Others have shown that in C57BL/6 mice, endogenous CD8 T cells which are specific for the NP and PA epitopes are equally represented in the lungs during the primary response to HKx31 (H3N2) infection, but the NP-specific cells become dominant by approximately 5:1 during the recall response to the serologically distinct A/PR8 (H1N1) strain [16]. Several factors that could influence the magnitude of the response to individual T cell epitopes during viral infections have been identified including: the mechanism of antigen processing [17;18], the concentration of antigenic protein and its binding efficiency to MHC molecules [30], as well as the precursor frequency of T cells which are specific for each epitope [30;31]. Although each of these mechanisms may participate in the selection of dominant T cell epitopes during repeated influenza virus infections no clear explanation for the shift in epitope dominance has been identified. Our studies indicate that additional factors which have not been considered previously may also help shape the dominance hierarchy in this model. We show that there were large numbers of activated NP-specific CD8 T cells in the MLN between 20–50d pi, which is the primary site of late antigen presentation [9]. At the same time we also found a shift toward NP dominance in the MLN during primary infection, which has not been reported previously. Since NP-specific CD8 T cells were slow to leave the MLN during parabiosis [9] our data further suggest that some activated CD8 T cells were retained near the site of late antigen presentation. Similar populations of CD69+ virus-specific CD8 T cells were detected near the site of latent infection in the trigeminal ganglia after intraocular herpes virus infection [21]. Precursor frequencies of virus-specific memory T cells have been shown to influence epitope selection after i.p. challenge with influenza virus [18]. If the recall response to pulmonary influenza infection is mounted preferentially in the MLN, it is likely that the hierarchy of responding T cell specificities will also reflect the local precursor frequencies for each CD8 T cell specificity. Large numbers of antigen-bearing DC migrate to the MLN during the first 48h after infection [27] and participate in memory CD8 T cell reactivation [9;32]. The changing pattern of epitope dominance during secondary infection is likely to be important for immunity, since there is evidence that NP-specific CD8 T cells are more effective at promoting viral clearance than are PA-specific cells [33].
In summary we have analyzed antigen presentation to CD8 T cells at different times after influenza virus infection. Our data show that different subsets of DC activate naïve CD8 T cells in the MLN during acute viral infection and later in the response. By 30d p.i. CD11b+ DC were the only APCs that were able to induce naïve F5 cells to proliferate in vitro. Despite a robust response to acute viral infection, central/memory CD8 T cells were ignorant of the antigen that was in the MLN on day 30. These data support earlier evidence that naïve and memory CD8 T cells use distinct mechanisms to detect antigen in some situations [23] and highlight previously unappreciated intricacies of the mucosal immune response to influenza virus infection. Further deciphering of this complexity should assist in rational vaccine design.
Materials and Methods
Mice and reagents
C57BL/6 mice were purchased from Charles River through the NCI animal program. At 8–14 weeks of age, mice were anesthetized by i.p. injection with avertin (2,2,2-tribromoethanol) before i.n. infection with 300 50% egg infectious doses (EID50) of HKx31 or E61-13-H17 influenza virus or 1×10³ pfu WSN-OVA. Virus stocks were grown in chicken eggs, titered, and stored as described previously [34].
Transfer experiments
Memory CD8 T cells were generated by transferring 2×10⁵ naïve CD45.1+ F5 cells to C57BL/6 mice and one day later, the mice were infected with 300 EID50 i.n. of E61-13H17. Alternatively, C57BL/6 mice received naïve CD45.1+ OT-I cells one day before infection with 104pfu recombinant Listeria monocytogenes (LM-OVA). Between 2–4 months after infection, CD45.1+ memory CD8 T cells were sorted from the spleens and peripheral lymph nodes using antibodies to CD45.2, B220 and CD4 for negative selection. Naïve and memory F5 cells were labeled with 1μM CFSE-dye at 37°C for 10mins [35] and transferred by tail vein injection.
Sample preparation for flow cytometry
Non-adherent cells were collected from the lungs by lavage 5 times in Hank’s balanced saline solution (HBSS). The mice were perfused with PBS with 75 U/ml heparin until the lungs were white in color. Ground glass microscope slides were used to make cell suspensions from spleens and peripheral lymph nodes. Red blood cells were lysed with ammonium chloride and lymphocytes were filtered through cell strainers. Lymphocytes were released from the chopped lung tissues by digestion with 150 U/ml collagenase (Life Technologies, Rockville, MD) in RPMI, 1 mM MgCl2, 1 mM CaCl2 and 5% FCS, at 37°C for one hour. Cells were pushed through strainers and spun on 44/67% Percoll gradients at 400g for 20 mins. Washed lymphocytes were stained with tetramers that are specific for the influenza virus NP366–374/Db and PA324–333/Db epitopes as described previously [16;36] and were supplied by the NIH Tetramer Facility (Emory University Vaccine Center at Yerkes, Atlanta GA). Lymphocytes were stained with APC-conjugated tetramers and anti-CD8 (clone 53.6.72) for 1 h. at room temperature. All other markers were stained at 4°C using mAb specific for CD45.1, CD45.2, CD69, CD11a, CD127, PD-1, and CD62L (EBioscience or BD Pharmingen, San Diego CA). Fixed samples were analyzed on a Becton-Dickinson FACSCalibur or LSR-II flow cytometer and analyzed using Flowjo software (Tree Star Inc.).
DC purification
CD11c+ cells were isolated from the peripheral lymph nodes using 150 U/ml collagenase (Life Technologies, Rockville, MD) in RPMI, 1 mM MgCl2, 1 mM CaCl2 and 5% FCS, at 37°C for one hour. EDTA was used to disrupt T cell/DC conjugates and CD11c+ cells were enriched by magnetic bead separation (Invitrogen Dynal). The enriched CD11c+ cells were further fractionated by sterile FACS sorting using antibodies to CD11b and CD8. Recovered cells were 99–97% pure. Naïve CFSE-labeled F5 cells (5×10⁴ cells/well) were cultured with purified DCs (3–5×10⁴ cells/well) for 4 days with 20u/ml rIL-2.
Whole mount confocal laser microscopy
Whole mount tissue staining [21] [22] was used to visualize the location of transferred naïve or memory F5 T cells after activation in situ. After transfer, fragments of lung tissue, whole lymph nodes or 300μm thick vibratome sections of lymph nodes were fixed in 2% paraformaldehyde for two hours at 4°C. Tissues were washed and stained overnight at 4°C in round bottom 96-well plates with Cy5 labeled anti-CD45.1 (EBiosciences), anti-B 220 Alexa Fluor 488 and hamster anti-mouse or biotin conjugated CD11c antibody (EBiosciences) diluted in 2% normal goat serum and 2% fetal calf serum/PBS solution. The tissues were extensively washed at 4°C in PBS and stained overnight at 4°C with either streptavidin-Alexa flour 546 or Cy3 antibody or Alexa flour 546 conjugated goat anti-hamster IgG (Invitrogen). Stained tissues were washed extensively and then mounted on slides using Immu-Mount (Thermo Shandon, Pittsburgh). B cells were detected with anti-B220 conjugated to Alexa 488. Unless otherwise stated, images were acquired between 25–35 μm beneath the capsule of the peripheral lymph nodes. In situ tetramer staining was performed as described previously [21;37;38] [22]. Fresh intact lymph nodes or fragments of lung tissue were incubated with APC conjugated H-2Db tetramer containing the NP366–374 peptide (1lg/ml) and fluorescently labeled rat anti-mouse CD8 antibodies in cold 2% normal goat serum and FCS/PBS solution at 4°C overnight. The tissues were extensively washed and fixed in 2% paraformaldehyde for two hours at 4°C. The fixed tissues were washed again with PBS and incubated overnight at 4°C with fluorescently labeled anti-B220 mAb or hamster anti-mouse CD11c and rabbit anti-APC (1:1000, Biomeda, Hayword, CA) diluted in 2% normal goat serum and PBS. Next day the tissues were washed extensively and were incubated overnight at 4°C with Alexa Flour 546 goat anti-rabbit IgG and Alexa Fluor 488 goat anti-hamster IgG (1:1000; Invitrogen). After final washing the tissues were mounted on slides using Immu-Mount. Images were collected using a Zeiss LSM-510-Meta confocal microscope mounted on an Axiovert 100M with automated xyz control equipped with an argon laser with emission at 458, 488, and 514nm, and two HeNe lasers with emission wavelengths at 543 and 633 nm. Image analysis was performed using Metamorph® software (Universal Imaging Corp, Downingtown, PA) and Imaris® Suite (Bitplane Inc). The cells In some images were enumerated using the Imaris spot check™ function. Images were first processed using the median filter algorithm. Spots representing CD45.1+ donor TCR transgenic cells were created using basic region of interest algorithm with an estimated cell diameter of >6um.
Acknowledgments
The authors thank Diane Gran for assistance with cell sorting and Dr. Ann Cowan for assistance with confocal microscopy. The WSN-OVAI virus was supplied by David Topham (University of Rochester). This work was supported by the American Lung Association RG1119 (L.S.C.), K.M.K is a Damon Runyon Fellow supported by the Damon Runyon Cancer Research Foundation (DRG-1886-05), National Institutes of Health grants; AI065895 and AI071213 (L.S.C.), and AI41576 and AI56172 (LL). Animal studies were performed is accordance with IACUC regulations.
Abbreviations
- CFSE
5-(and 6-) carboxyfluorescein diacetate succinimidyl ester
- DLN
draining lymph nodes
- MLN
mediastinal lymph node
- NP
nucleoprotein
- PA
Acid polymerase
References
- 1.Liang S, Mozdzanowska K, Palladino G, Gerhard W. Heterosubtypic immunity to influenza type A virus in mice. Effector mechanisms and their longevity. J Immunol. 1994;152:1653–1661. [PubMed] [Google Scholar]
- 2.Kreijtz JH, Bodewes R, van Amerongen G, Kuiken T, Fouchier RA, Osterhaus AD, Rimmelzwaan GF. Primary influenza A virus infection induces cross-protective immunity against a lethal infection with a heterosubtypic virus strain in mice. Vaccine. 2006 doi: 10.1016/j.vaccine.2006.08.036. [DOI] [PubMed] [Google Scholar]
- 3.Doherty PC, Topham DJ, Tripp RA. Establishment and persistence of virus-specific CD4+ and CD8+ T cell memory. Immunol Rev. 1996;150:23–44. doi: 10.1111/j.1600-065x.1996.tb00694.x. [DOI] [PubMed] [Google Scholar]
- 4.Zinkernagel RM. On differences between immunity and immunological memory. Curr Opin Immunol. 2002;14:523–536. doi: 10.1016/s0952-7915(02)00367-9. [DOI] [PubMed] [Google Scholar]
- 5.Gray D. A role for antigen in the maintenance of immunological memory. Nat Rev Immunol. 2002;2:60–65. doi: 10.1038/nri706. [DOI] [PubMed] [Google Scholar]
- 6.Hogan RJ, Usherwood EJ, Zhong W, Roberts AA, Dutton RW, Harmsen AG, Woodland DL. Activated antigen-specific CD8+ T cells persist in the lungs following recovery from respiratory virus infections. J Immunol. 2001;166:1813–1822. doi: 10.4049/jimmunol.166.3.1813. [DOI] [PubMed] [Google Scholar]
- 7.Marshall DR, Turner SJ, Belz GT, Wingo S, Andreansky S, Sangster MY, Riberdy JM, Liu T, Tan M, Doherty PC. Measuring the diaspora for virus-specific CD8+ T cells. Proc Natl Acad Sci USA. 2001;98:6313–6318. doi: 10.1073/pnas.101132698. [DOI] [PMC free article] [PubMed] [Google Scholar]
- 8.Ostler T, Hussell T, Surh CD, Openshaw P, Ehl S. Long-term persistence and reactivation of T cell memory in the lung of mice infected with respiratory syncytial virus. Eur J Immunol. 2001;31:2574–2582. doi: 10.1002/1521-4141(200109)31:9<2574::aid-immu2574>3.0.co;2-v. [DOI] [PubMed] [Google Scholar]
- 9.Zammit DJ, Turner DL, Klonowski KD, Lefrancois L, Cauley LS. Residual antigen presentation after influenza virus infection affects CD8 T cell activation and migration. Immunity. 2006;24:439–449. doi: 10.1016/j.immuni.2006.01.015. [DOI] [PMC free article] [PubMed] [Google Scholar]
- 10.Jelley-Gibbs DM, Dibble JP, Brown DM, Strutt TM, McKinstry KK, Swain SL. Persistent depots of influenza antigen fail to induce a cytotoxic CD8 T cell response. J Immunol. 2007;178:7563–7570. doi: 10.4049/jimmunol.178.12.7563. [DOI] [PubMed] [Google Scholar]
- 11.Tscharke DC, Yewdell JW. T cells bite the hand that feeds them. Nat Med. 2003;9:647–648. doi: 10.1038/nm0603-647. [DOI] [PubMed] [Google Scholar]
- 12.Moskophidis D, Kioussis D. Contribution of virus-specific CD8+ cytotoxic T cells to virus clearance or pathologic manifestations of influenza virus infection in a T cell receptor transgenic mouse model. J Exp Med. 1998;188:223–232. doi: 10.1084/jem.188.2.223. [DOI] [PMC free article] [PubMed] [Google Scholar]
- 13.Townsend AR, Rothbard J, Gotch FM, Bahadur G, Wraith D, McMichael AJ. The epitopes of influenza nucleoprotein recognized by cytotoxic T lymphocytes can be defined with short synthetic peptides. Cell. 1986;44:959–968. doi: 10.1016/0092-8674(86)90019-x. [DOI] [PubMed] [Google Scholar]
- 14.Hogquist KA, Jameson SC, Heath WR, Howard JL, Bevan MJ, Carbone FR. T cell receptor antagonist peptides induce positive selection. Cell. 1994;76:17–27. doi: 10.1016/0092-8674(94)90169-4. [DOI] [PubMed] [Google Scholar]
- 15.Agata Y, Kawasaki A, Nishimura H, Ishida Y, Tsubata T, Yagita H, Honjo T. Expression of the PD-1 antigen on the surface of stimulated mouse T and B lymphocytes. Int Immunol. 1996;8:765–772. doi: 10.1093/intimm/8.5.765. [DOI] [PubMed] [Google Scholar]
- 16.Belz GT, Xie W, Altman JD, Doherty PC. A previously unrecognized H-2D(b)-restricted peptide prominent in the primary influenza A virus-specific CD8(+) T-cell response is much less apparent following secondary challenge. J Virol. 2000;74:3486–3493. doi: 10.1128/jvi.74.8.3486-3493.2000. [DOI] [PMC free article] [PubMed] [Google Scholar]
- 17.Crowe SR, Turner SJ, Miller SC, Roberts AD, Rappolo RA, Doherty PC, Ely KH, Woodland DL. Differential antigen presentation regulates the changing patterns of CD8+ T cell immunodominance in primary and secondary influenza virus infections. J Exp Med. 2003;198:399–410. doi: 10.1084/jem.20022151. [DOI] [PMC free article] [PubMed] [Google Scholar]
- 18.Chen W, Pang K, Masterman KA, Kennedy G, Basta S, Dimopoulos N, Hornung F, Smyth M, Bennink JR, Yewdell JW. Reversal in the immunodominance hierarchy in secondary CD8+ T cell responses to influenza A virus: roles for cross-presentation and lysis-independent immunodomination. J Immunol. 2004;173:5021–5027. doi: 10.4049/jimmunol.173.8.5021. [DOI] [PubMed] [Google Scholar]
- 19.Sallusto F, Geginat J, Lanzavecchia A. Central memory and effector memory T cell subsets: function, generation, and maintenance. Annu Rev Immunol. 2004;22:745–763. doi: 10.1146/annurev.immunol.22.012703.104702. [DOI] [PubMed] [Google Scholar]
- 20.Schluns KS, Kieper WC, Jameson SC, Lefrancois L. Interleukin-7 mediates the homeostasis of naive and memory CD8 T cells in vivo. Nat Immunol. 2000;1:426–432. doi: 10.1038/80868. [DOI] [PubMed] [Google Scholar]
- 21.Khanna KM, Bonneau RH, Kinchington PR, Hendricks RL. Herpes simplex virus-specific memory CD8+ T cells are selectively activated and retained in latently infected sensory ganglia. Immunity. 2003;18:593–603. doi: 10.1016/s1074-7613(03)00112-2. [DOI] [PMC free article] [PubMed] [Google Scholar]
- 22.Khanna KM, McNamara JT, Lefrancois L. In situ imaging of the endogenous CD8 T cell response to infection. Science. 2007;318:116–120. doi: 10.1126/science.1146291. [DOI] [PMC free article] [PubMed] [Google Scholar]
- 23.Belz GT, Bedoui S, Kupresanin F, Carbone FR, Heath WR. Minimal activation of memory CD8(+) T cell by tissue-derived dendritic cells favors the stimulation of naive CD8(+) T cells. Nat Immunol. 2007 doi: 10.1038/ni1505. [DOI] [PubMed] [Google Scholar]
- 24.Topham DJ, Castrucci MR, Wingo FS, Belz GT, Doherty PC. The role of antigen in the localization of naive, acutely activated, and memory CD8(+) T cells to the lung during influenza pneumonia. J Immunol. 2001;167:6983–6990. doi: 10.4049/jimmunol.167.12.6983. [DOI] [PubMed] [Google Scholar]
- 25.Belz GT, Smith CM, Kleinert L, Reading P, Brooks A, Shortman K, Carbone FR, Heath WR. Distinct migrating and nonmigrating dendritic cell populations are involved in MHC class I-restricted antigen presentation after lung infection with virus. Proc Natl Acad Sci USA. 2004 doi: 10.1073/pnas.0402644101. [DOI] [PMC free article] [PubMed] [Google Scholar]
- 26.Schnorrer P, Behrens GM, Wilson NS, Pooley JL, Smith CM, El Sukkari D, Davey G, Kupresanin F, Li M, Maraskovsky E, Belz GT, Carbone FR, Shortman K, Heath WR, Villadangos JA. The dominant role of CD8+ dendritic cells in cross-presentation is not dictated by antigen capture. Proc Natl Acad Sci USA. 2006;103:10729–10734. doi: 10.1073/pnas.0601956103. [DOI] [PMC free article] [PubMed] [Google Scholar]
- 27.Legge KL, Braciale TJ. Accelerated migration of respiratory dendritic cells to the regional lymph nodes is limited to the early phase of pulmonary infection. Immunity. 2003;18:265–277. doi: 10.1016/s1074-7613(03)00023-2. [DOI] [PubMed] [Google Scholar]
- 28.Wikstrom ME, Stumbles PA. Mouse respiratory tract dendritic cell subsets and the immunological fate of inhaled antigens. Immunol Cell Biol. 2007;85:182–188. doi: 10.1038/sj.icb.7100039. [DOI] [PubMed] [Google Scholar]
- 29.Ebert LM, Schaerli P, Moser B. Chemokine-mediated control of T cell traffic in lymphoid and peripheral tissues. Mol Immunol. 2005;42:799–809. doi: 10.1016/j.molimm.2004.06.040. [DOI] [PubMed] [Google Scholar]
- 30.La Gruta NL, Doherty PC, Turner SJ. A correlation between function and selected measures of T cell avidity in influenza virus-specific CD8(+) T cell responses. Eur J Immunol. 2006;36:2951–2959. doi: 10.1002/eji.200636390. [DOI] [PubMed] [Google Scholar]
- 31.La Gruta NL, Kedzierska K, Pang K, Webby R, Davenport M, Chen W, Turner SJ, Doherty PC. A virus-specific CD8+ T cell immunodominance hierarchy determined by antigen dose and precursor frequencies. Proc Natl Acad Sci USA. 2006;103:994–999. doi: 10.1073/pnas.0510429103. [DOI] [PMC free article] [PubMed] [Google Scholar]
- 32.Belz GT, Wilson NS, Smith CM, Mount AM, Carbone FR, Heath WR. Bone marrow-derived cells expand memory CD8+ T cells in response to viral infections of the lung and skin. Eur J Immunol. 2006;36:327–335. doi: 10.1002/eji.200535432. [DOI] [PubMed] [Google Scholar]
- 33.Crowe SR, Miller SC, Shenyo RM, Woodland DL. Vaccination with an acidic polymerase epitope of influenza virus elicits a potent antiviral T cell response but delayed clearance of an influenza virus challenge. J Immunol. 2005;174:696–701. doi: 10.4049/jimmunol.174.2.696. [DOI] [PubMed] [Google Scholar]
- 34.Daly K, Nguyen P, Woodland DL, Blackman MA. Immunodominance of major histocompatibility complex class I-restricted influenza virus epitopes can be influenced by the T-cell receptor repertoire. J Virol. 1995;69:7416–7422. doi: 10.1128/jvi.69.12.7416-7422.1995. [DOI] [PMC free article] [PubMed] [Google Scholar]
- 35.Lyons AB, Parish CR. Determination of lymphocyte division by flow cytometry. J Immunol Methods. 1994;171:131–137. doi: 10.1016/0022-1759(94)90236-4. [DOI] [PubMed] [Google Scholar]
- 36.Flynn KJ, Belz GT, Altman JD, Ahmed R, Woodland DL, Doherty PC. Virus-specific CD8(+) T cells in primary and secondary influenza pneumonia. Immunity. 1998;8:683–691. doi: 10.1016/s1074-7613(00)80573-7. [DOI] [PubMed] [Google Scholar]
- 37.Skinner PJ, Daniels MA, Schmidt CS, Jameson SC, Haase AT. Cutting edge: In situ tetramer staining of antigen-specific T cells in tissues. J Immunol. 2000;165:613–617. doi: 10.4049/jimmunol.165.2.613. [DOI] [PubMed] [Google Scholar]
- 38.McGavern DB, Christen U, Oldstone MB. Molecular anatomy of antigen-specific CD8(+) T cell engagement and synapse formation in vivo. Nat Immunol. 2002;3:918–925. doi: 10.1038/ni843. [DOI] [PMC free article] [PubMed] [Google Scholar]


