

Abstract
The intramolecular reaction of cysteine thiyl radicals with peptide and protein αC-H bonds represents a potential mechanism for irreversible protein oxidation. Here, we have measured absolute rate constants for these reversible hydrogen transfer reactions by means of pulse radiolysis and laser flash photolysis of model peptides. For N-Ac-CysGly6 and N-Ac-CysGly2AspGly3, Cys thiyl radicals abstract hydrogen atoms from Gly with kf = (1.0-1.1)×105 s-1, generating carbon-centered radicals, while the reverse reaction proceeds with kr = (8.0-8.9)×105 s-1. The forward reaction shows a normal kinetic isotope effect of kH/kD = 6.9, while the reverse reaction shows a significantly higher normal kinetic isotope effect of 17.6, suggesting a contribution of tunneling. For N-Ac-CysAla2AspAla3, cysteine thiyl radicals abstract hydrogen atoms from Ala with kf =(0.9-1.0)×104 s-1, while the reverse reaction proceeds with kr = 1.0×10⁵ s-1. The order of reactivity, Gly > Ala, is in accord with previous studies on intermolecular reactions of thiyl radicals with these amino acids. The fact that kf < kr suggests some secondary structure of the model peptides, which prevents the adoption of extended conformations, for which calculations of homolytic bond dissociation energies would have predicted kf > kr. Despite kf < kr, model calculations show that intramolecular hydrogen abstraction by Cys thiyl radicals can lead to significant oxidation of other amino acids in the presence of physiologic oxygen concentrations.
Keywords: thiol, thiyl radical, hydrogen transfer, glycine, glycyl radical, alanine, alanyl radical, peptide, disulfide, pulse radiolysis, laser flash photolysis
Introduction
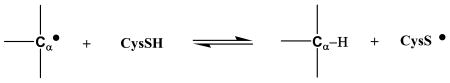
The reversible H-transfer between glycine radicals, GlyC•, and cysteine (reaction 1) plays an important role in various enzymatic processes, such as the activation of pyruvate formate lyase (PFL), ribonucleotide reductase (RNR) III, and benzylsuccinate synthase.1-5
| (1) |
The extent to which equilibrium 1 is located on either side will depend predominantly on the local environment around the Gly residue.2 If the Cα• radical center of GlyC• is part of an ideal planar system, allowing for maximal capto-dative stabilization in a fully extended peptide structure, where Φ,Ψ = 180°, the GlyC• radical will be more stable than CysS•. Under such conditions, theoretical data predict that the Cα-H bond dissociation energy of Gly, BDE(Cα-H) = 330-350 kJ/mol,2,6 is lower than the S-H bond dissociation energy of Cys, BDE(S-H) = 341-370 kJ/mol.2,7 However, the incorporation of Gly into stretches of secondary structure can significantly raise the BDE(Cα-H),8 for example to BDE(Cα-H) = 361 kJ/mol within a β-sheet and BDE(Cα-H) = 402 kJ/mol within an α-helix. In PFL, the forward reaction of equilibrium 1 (between Gly734 and Cys419) triggers the enzymatic turnover, while the reverse reaction of equilibrium 1 restores the resting state of the enzyme.4,5 It appears that moving equilibrium 1 towards one or the other side requires conformational changes around Gly734 which would render the GlyC• radical more or less reactive towards the adjacent Cys residues, i.e. fine-tune the Cα-H BDE.2 An analogous mechanism should operate in RNR III: here, DFT calculations of electron spin resonance (ESR) hyperfine properties of the GlyC• radical were able to confirm a planar configuration of GlyC• in E. coli RNR but a non-planar structure in bacteriophage T4 anaerobic RNR, essentially demonstrating two conformations of GlyC• in two related enzymes.9
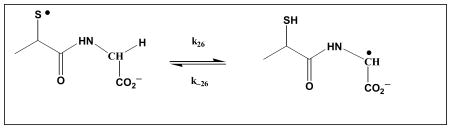
Despite a large number of theoretical calculations, experimental data on the rate constants of equilibrium 1 and the intramolecular reaction of Cys thiyl radicals with amino acids, in general, are scarce. Kinetic NMR measurements at 37°C and acidic pH provided rate constants for the bimolecular reaction of cysteamine thiyl radicals with glycine anhydride (3.2×10⁵ M-1s-1)10 (which favorably agrees with a theoretically predicted rate constant, 1.5×10⁵ M-1s-1, for the reaction of glycine anhydride with CH3S• 11), N-acetylglycine amide (6.4×10⁴ M-1s-1),10 glycyl amide (0.7×10⁴ M-1s-1),12 and Gly (0.3×10⁴ M-1s-1).12 Pulse radiolysis was employed to measure the rate constant for the reaction of Cys thiyl radicals with anionic Gly (3.2×10⁵ M-1s-1).13 An intramolecular H-transfer reaction of Cys thiyl radicals was quantified for the tripeptide glutathione under conditions where the N-terminal amino group is deprotonated;14,15 here, the H-transfer from the Cα-H bond of γ-Glu yields a capto-datively well stabilized radical. However, absolute rate constants for intramolecular H-transfer reactions between Cys thiyl radicals and α-amino acids within a peptide skeleton (i.e. not N-terminal amino acids) are unknown. The present paper will
 |
(2) |
provide kinetic data for such intramolecular H-transfer reaction represented by the general equilibrium 2 for the peptides N-Ac-CysGly6, N-Ac-CysGly2AspGly3, and N-Ac-CysAla2AspAla3. The peptide, N-AcCysGly6, containing six Gly residues, was selected for the following reasons: (i) For an efficient H-transfer to occur, the peptide should be sufficiently flexible to allow for the appropriate geometry. Statistically, this should be easier when multiple Gly residues are present within the peptide, though mass spectrometric data16 with linear heptapeptides suggest that H-transfer to CysS• occurs predominantly with Gly residues in position i+1 and i-1. (ii) The solution conformation of Gly6 within a peptide has been experimentally described17 as significantly more elongated than the ideal α-helix but more compact than β-strand and polyglycine II, i.e. the Gly6 moiety in N-Ac-CysGly6 is expected to possess secondary structure. This observation somehow contradicts the results of gas phase calculations, which predict that poly-Gly should prefer an α-helical conformation18,19 but is consistent with FTIR and Raman spectroscopy data on the even smaller peptide congener Gly3, which clearly demonstrate Φ and Ψ values significantly different from 180°.20 In other words, in the Gly6 sequence of N-Ac-CysGly6 we cannot expect GlyC• to adopt a fully planar conformation, and, consequently, we expect GlyC• to be rather reactive. This expectation is consistent with our experimental results described in this paper. The peptide N-Ac-CysAla2AspAla3 was selected to study the reversible H-transfer between Cys thiyl radicals and Ala, where the amino acid Asp was introduced into the middle of the polyAla sequence in order to prevent hydrophobic association (based on our previous bimolecular rate constants, we do not expect a significant reaction of CysS• with Asp10). For direct comparison of Gly and Ala, we also evaluated the peptide sequence N-Ac-CysGly2AspGly3.
Experimental
Materials
N-Ac-CysGly6 was synthesized in two independent batches using Fmoc chemistry by G.Casi (Laboratorium für Organische Chemie, ETH Zürich, Switzerland) and by the Biochemical Research Service Laboratory (BRSL) at the University of Kansas. N-Ac-CysAla2AspAla3 and N-Ac-CysGly2AspGly3 were synthesized by the BRSL at The University of Kansas. All peptides were purified by reversed-phase HPLC and their purity assessed by mass spectrometry. N-Ac-Cys, N-Ac-Cys-OMe, (CysGly)2 (disulfide), Gly6 and N-Ac-Ala-NH2 (all >99% grade) were obtained from Bachem (Bubendorf, Switzerland). 2-Mercaptopropionylglycine (>97%) and N-Ac-Gly-NH2 were purchased from Fluka AG (Buchs SG, Switzerland) and ABCR GmbH (Karlsruhe, Germany), respectively. Water (H2O) was taken from a Millipore MilliQ system. Deuterium oxide of 99.8% quality was provided by E.I.R. (Switzerland).
Pulse radiolysis
A Febetron 705 (L-3 Communications, San Leandro, CA) 2 MeV accelerator at the ETH Zürich delivered pulses of 5-50 Gy dose. As light source a 75 W Xe arc lamp was used. The detection system consisted of an Acton SP300i monochromator (Roper Scientific, Ottobrunn, Germany) and a Hamamatsu R928 photomultiplier (Hamamatsu Photonics, Solothurn, Switzerland). The signal was digitized and recorded on a Yokogawa DL7100 digital storage oscilloscope (NBN Elektronik AG, Uitikon, Switzerland) and subsequently transferred to a PC. Samples were gas saturated in Schlenk-tubes which were repeatedly evacuated to 10 mbar and refilled with the desired gas. Afterwards, they were taken out via needle into gas tight syringes (Hamilton SampleLock, 10 ml) and introduced into the Hellma 1cm quartz measurement cell (Mülhausen, Germany) through a flow system. The transfer of the samples (transfer to the syringe and from there to the cell) reintroduced some oxygen back into the solutions. The concentration was determined independently to be smaller than 6 μM.
Laser Flash Photolysis
Laser flash photolysis (LFP) experiments were carried out with an Applied Photophysics LKS 50 instument (Leatherhead, UK), equipped with a Quantel Brilliant B Nd:YAG Laser (Les Ulis, France) of which the 4th harmonic was used. The oscilloscope of the original instrument (LKS 50) has been replaced by a LeCroy Waverunner 64Xi oscilloscope (Geneva, Switzerland). The measurement cell consisted of a 1 cm Hellma fluorescence cell, equipped with a Youngs type valve to ensure maximal air-tightness. The cuvettes were several times evacuated to 10 mbar (i.e. boiling) and refilled with the desired gas. They were virtually oxygen free. Unless stated otherwise, samples were irradiated only once.
Errors
All experiments reported here have been reproduced at least five times. Often, additional experiments have been carried out with different detection wavelength, pH or concentration (data not shown or referred to). The rate constants derived from pulse radiolysis are reproducible within 10% between experiments. Controls with a different sample handling and detection system using our laser flash photolysis setup lead essentially to the same rate data as derived by pulse radiolysis. In flash photolysis we can enforce larger uncertainties if we change assumptions (vide infra). Then the rate constants derived by computer simulation vary up to 20%. The dose determination in pulse radiolysis (initial concentration of radicals) has an error lower than 5%.
If we consider, that the rate data we took from the literature may carry an error of 10% each, we estimate the absolute error on our rate constant below a factor of 2 and the one of the equilibrium constants below 20%
Results
1. Peptides
Pulse radiolysis
Radiation-induced chemical processes in water
The pulse irradiation of water leads to the formation of protons, hydrated electrons (eaq-), •H, and hydroxyl radicals (•OH), where hydrated electrons can be converted into HO• through reaction with N2O (k = 9.1 × 10⁹ M−1s−1, [N2O]sat ≈ 2 × 10⁻² M).21 We note that in acidic solution, hydrated electrons also react with protons to yield H• (k = 2.3×10¹⁰ M-1s-1 22), i.e. the relative yields of H• and HO• will depend on the pH. For N2O-saturated solutions, the effective radiation chemical yield of •OH converting a given substrate into substrate-derived radicals can be calculated on the basis of formula I given by Schuler et al.,23 where G refers to the number of species generated/reacted per 100 eV absorbed energy (G = 1.0 corresponds to 0.1036 μM generated/reacted species per 1 J absorbed energy; GN2O refers to G in N2O-saturated solution).
| (I) |
Radical yields
N-Ac-CysGly6
The pulse irradiation of N2O-saturated aqueous solutions containing (2-6)×10-4 M N-Ac-CysGly6 and 1×10⁻² M KH2PO4 (pH 4.2) at room temperature leads to the expected transient optical absorptions with λmax = 260 nm and λmax ≈ 330 nm.24 Figure 1A displays an absorbance-vs-time trace recorded for 2×10⁻⁴ M N-Ac-CysGly6 at 260 nm (applied dose = 18 Gy) (the solid line represents a kinetic simulation, which will be discussed separately below). By comparison to published spectra,24,25 this absorbance is caused by the formation of two radical species, the carbon-centered radical GlyC•, generated through hydrogen abstraction from Gly, and the thiyl radical CysS•, generated through hydrogen abstraction from the sulfhydryl group of Cys (vide infra). The absorbance at 260 nm reaches a maximum of 0.011 absorption units (AU§) at ca. 5 μs after the pulse. The rate constant for the reaction of HO• radicals with the Gly6 moiety in N-Ac-CysGly6 (reaction 3; n = position of GlyC• in the Gly6 moiety; a = n-1; b = 5-a) is taken as k3 = 8×10⁸ M-1s-1 by analogy to published values for a series of Gly peptides at acidic to neutral pH,22 and confirmed by our own kinetic simulations of the experimental data (vide infra).
Figure 1.

Pulse radiolysis of N2O saturated aqueous solutions of 200 μM N-Ac-CysGly6 (Panel A, 18 Gy), 600 μM N-Ac-CysGly6 (Panel B, 20 Gy) and 720 μM Gly6 (Panel C, 15 Gy, control). The experimental traces (dots) are averaged points for specific time periods in order to improve legibility. They are compared with simulations using an identical parameter set. The time-resolved absorption traces in Panels A and B were detected at 260 nm, the one of Panel C at 265 nm. The solutions of N-Ac-CysGly6 contained 10 mM phosphate (pH 4) the one of Gly6 5 mM H2SO4.
Although traces A and B start at different absorption levels, which is due to the reactions of the primary radicals with different concentrations of N-Ac-CysGly6, they reach their maximum at the same time. This indicates a rate determinig step which is 1st order, i.e. intramolecular.
| (3) |
Our kinetic simulation (vide infra) yields k4 = 1×10¹⁰ M-1s-1 for the reaction of HO• radicals with the Cys moiety in N-Ac-CysGly6 (reaction 4), similar to the published rate constant for the reaction of HO• with Cys.22
| (4) |
Taking k(HO•+CH3CONH2) = 1.9×10⁸ M-1s-1 as a representative rate constant for the potential reaction of HO• radicals with the N-acetyl group,22 we calculate that in N-Ac-CysGly6 ca. 90% of the HO• radicals are expected to react with the Cys moiety. The H• atoms will exclusively react with the Cys moiety in N-Ac-CysGly6, where k5 = 2×10⁹ M-1s-1 based on our simulations (vide infra), which corresponds to the published rate constant for the reaction of H• atoms with Cys, i.e. 1.8×10⁹ M-1s-1.22
| (5) |
The H• atoms will not react with the Gly moiety of N-Ac-CysGly6 (cf., for the reaction of H• with N-Ac-Gly, k = 3.5×10⁶ M-1s-1 22). Hence, equation I predicts that the total yield of hydroxyl radicals available for reaction with N-Ac-CysGly6 amounts to G = 5.4, of which 91% react with the Cys residue. In addition, H• atoms formed with an initial yield of G(H•) = 0.6 will react with the Cys residue so that the overall amount of primary water radicals reacting with the Cys moiety in 2×10⁻⁴ N-Ac-CysGly6 amounts to 0.91 GHO• + GH• = 5.5. At an applied dose of 18 Gy, and an absorbance coefficient for CysS• at 260 nm of ε260,CysS• ≈ 73 M-1cm-1 (vide infra), we expect that CysS• radicals would contribute maximally 7.5×10⁻⁴ AU to the experimentally measured absorbance immediately after the pulse. Initially, 8% of the primary HO• radicals react with the Gly moiety in N-Ac-CysGly6 to give GlyC•, responsible for 6.8×10⁻³ AU (based on an absorbance coefficient for GlyC• of ε260 = 8,410 M-1cm-1, vide infra). Therefore, our experimentally measured maximal absorbance yields of 11×10-3 AU at 5 μs after the pulse is significantly higher than expected from the combined initial yields of GlyC• and CysS•, clearly demonstrating the formation of additional GlyC• radicals over the experimental time period. Importantly, the absorbance growth over 5 μs after the pulse occurs with t1/2 ≈ 0.8 μs, i.e. significantly slower as expected based on k4 = 1×10¹⁰ M-1s-1, indicating the formation of GlyC• through (i) a slower process following the initial attack of HO• on Cys or (ii) reaction 5 followed by the reaction of CysS• with Gly. The latter becomes even more obvious when the concentration of N-Ac-CysGly6 is increased to 6×10⁻⁴ M under otherwise similar experimental conditions (Figure 1B). Here, the slow growth of the 260 nm absorbance from 9.5×10⁻³ AU to a maximal yield of ca. 13×10-3 AU (at 5 μs after the pulse; Δ = 3.5×10⁻³ AU) following the initial rise occurs with t1/2 = 0.7 μs, i.e. comparable to that observed with 2×10⁻⁴ M N-Ac-CysGly6. This independence on peptide concentration is an important fact suggesting that the slow process is an intramolecular reaction. Evidence against the involvement of primary water radicals in the slow process comes from two additional features: first, HO• radicals would react with 6×10⁻⁴ M N-Ac-CysGly6 with t1/2 = 0.1 μs, i.e. significantly faster than the observed slow process. Second, the maximal absorbance increase generated by the reaction of H• atoms with the Cys moiety of N-Ac-CysGly6 (reaction 5) would be 8×10⁻⁵ AU, i.e. only about 2.3% of the observed increase by 3.5×10⁻³ AU.
Hence, these data suggest that the absorbance increase through the slow process is indeed an intramolecular process such as the reversible interconversion between CysS• and GlyC• (equilibrium 6).
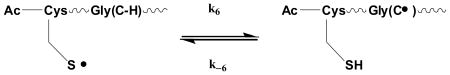 |
(6) |
Reference experiments with Gly6
The pulse irradiation (15 Gy) of 7.2×10⁻⁴ M Gly6 in N2O-saturated aqueous solution, pH 1.7, leads to the absorption-vs.-time trace displayed in Figure 1c. Here, GlyC• radicals are exclusively generated through reaction 7 (a = n-1; b = 5-a).
| (7) |
Within 5 μs after the pulse, the absorbance yield reaches a maximum of 0.052 AU. before it decays slowly. A complete spectrum of GlyanGlyC•Glyb is shown in Figure 2A, from where we derive ε260,GlyC• = 8,410 M-1cm-1 and ε330,GlyC• = 2,690 M-1cm-1. Nearly identical values have been obtained for the GlyC• radical from N-Ac-Gly-NH2#. In general, these values are slightly lower than the previously published absorption coefficient (e.g., ε263 = 12,900 M-1cm-1 24). However, we note that the previous absorption coefficients for GlyC• derived from Gly anhydride25 were also later corrected to lower numbers by others.26
Figure 2.

Spectra of (Gly6)• (Panel A), N-Ac-CysS•-OMe (Panel B, black triangles) and N-Ac-Ala•-NH2 (Panel C). Experimental conditions were: Panel A: 1 mM Gly6, 9 mM H2SO4, N2O-sat., G(•OH) = 3.6. Panel B: The spectrum of the cysteinyl thiyl radical was derived by a subtraction of a mixed spectrum of thiyl radical and t-butanol radicals (grey circles) and a pure t-butanol radical spectrum (grey squares). The t-butanol spectrum was measured in an argon-saturated solution of 90 mM t-butanol and 90 mM H2SO4. For the mixed spectrum 0.35 mM N-acetylcysteinemethylester (N-Ac-Cys-OMe) was added. G(H•) = 3.1. Panel C: 10 mM N-Ac-Ala-NH2, 50 Gy, N2O-sat., 50 Gy
Reference experiments with N-Ac-Cys-methyl ester disulfide
The absorption coefficients of CysS• were independently determined through pulse radiolysis. Figure 2B shows the optical spectra obtained after pulse irradiation of (i) 2×10⁻⁴ M N-acetylcysteinemethylester disulfide, (N-Ac-Cys-OMe)2 in Ar-saturated aqueous solution, pH 1, containing 90 mM 2,2 dimethylpropanol (tert-butanol, tBuOH), and (ii) 90 mM tBuOH in Ar-saturated aqueous solution, pH 1. Under these experimental conditions, all HO• radicals react with tBuOH to yield carbon-centered radicals, HO-C(CH3)2CH2•, while all hydrated electrons convert into H• atoms, which subsequently reduce the disulfide bond to yield thiol and thiyl radicals of the structure N-Ac-(CysS•)OMe. The difference between both spectra represents the absorption spectrum of N-Ac-(CysS•)OMe, from which we calculate ε260,N-Ac-(CysS•)OMe = 73 M-1cm-1 (not corrected for reactant spectra).
N-Ac-CysAla2AspAla3
The pulse irradiation (20.8 Gy) of an N2O-saturated aqueous solution, pH 4, containing 2×10⁻⁴ M N-Ac-CysAla2AspAla3 yields the absorption vs. time profile displayed in Figure 3 (circles). The 260 nm absorption represents predominantly AlaαC• radicals, where ε260,AlaαC• = 9,500 M-1cm-1 (vide infra), and a small fraction of AspαC• (ca. 17%), where it can be assumed that ε260,AlaαC• ≈ ε260,AspαC•. In these experiments we expect the absorbtion after the reaction of the primary radicals to be higher than in the case of N-Ac-Cys-Gly6 because the rate constant for the reaction of the hydroxyl radical with Ala and Asp is higher than with Gly. Therefore we have initially a higher fraction of carbon centered radicals that are formed, based on k8 = 1×10¹⁰ M−1s-1 (vide infra), k9 = 2×10⁹ M-1s-1 (vide infra), k10 = 1.7×10⁹ M-1s-1 22 = (0.83 k11 + 0.17 k12) (a = n-1; b = 5-a), and k(HO•+N-acetyl group) = 1.9×10⁸ M-1s-1 22.
Figure 3.

Pulse radiolysis (20.8 Gy) of 200 μM N-Ac-AlaAlaAspAlaAlaAla, pH 4, N2O sat. The reaction was followed at 260 nm (circles). The absorption after 50 μs is indicative for K14, in the time range 5 – 30 μs the kinetics are governed by the installation of equilibrium 14 (i.e. k14 + k-14). To visualize the sensitivity of the simulation on k14 results for k14 = 8×10⁵ s-1 (too fast, dotted line), k14 = 1×10⁵ s-1 (correct value, full line) and k14 = 2×10⁴ s-1 (too slow, dashed line) for the given K14 are shown.
| (8) |
| (9) |
| (10) |
| (11) |
| (12) |
With radiation yields of G(•OH)=5.3 and G(•H) = 0.6 we calculate Gε(AlaC•)=0.855 × 10⁻³AU/Gy and Gε(CysS•)=0.038 × 10⁻³ AU/Gy. Therefore, with a dose of 20.8 Gy we predict an initial absorption of 18.6 × 10⁻³ AU in accordance with the experimentally measured 18.2 ×10⁻³ AU. Based on the rate constants, we can calculate also an initial product ratio of [AlaC•]/[CysS•] = 0.15.
Importantly, the αC• radicals generated by secondary reactions will exclusively be AlaαC• because our earlier experiments on the bimolecular reaction of thiyl radicals with amino acids have shown that thiyl radicals react significantly faster with Ala as compared to Asp.10 Hence, reaction 13 is quasi irreversible, and any further hydrogen transfer to thiyl radicals would originate from Ala.
| (13) |
Therefore, ultimately the equilibrium for radicals of N-Ac-CysAla2AspAla3 is best represented by reaction 14, analogous to equilibrium 6 for N-Ac-CysGly6. Experimentally we find (Figure 3, 5 – 30 μs), that the equilibrium is installed by a process that is changing the absorbance to lower values (k-14), i.e. K14 < 0.15.
Figure 5.

Identical to figure 4C, but with longer timescale. Instead of a quick installation of an equilibrium in H2O (black squares, see also figure 4C) we find a much slower one in D2O. The kinetic isotope effect for the H/D transfer reactions derived from the fit shown here and the data derived from the experiments represented in figures 1, 2 A+B and 4A are k6,H/k6,D = 6.8 and k-6,H/k-6,D = 17.8. Despite the uncertainty for the latter value we have to assume that there is an influence of tunneling.
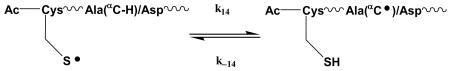 |
(14) |
Reference experiments with N-Ac-Ala-NH2
A reference spectrum of AlaαC• was obtained through pulse irradiation of an N2O-saturated aqueous solution, pH 6, of 10 mM N-Ac-Ala-NH2, which is displayed in Figure 2C. Based on the applied radiation chemical dose, we calculate ε260,AlaαC• = 9,500 M-1cm-1 and ε275,AlaαC• = 8000 M-1cm-1.
Kinetic analysis
N-Ac-CysGly6 and Gly6
N-Ac-CysGly6 and Gly6 show important differences in the formation of the 260 nm absorbance. In Figure 1C, the 265 nm absorbance after pulse irradiation of Gly6 builds up according to first-order kinetics with t1/2 ≈ 1.2 μs, corresponding to a rate constant for reaction 7 of k7 = 8×10⁸ M-1s-1. For N-Ac-CysGly6, in Figure 1A, the slow build-up of the 260 nm absorbance following the initial rise proceeds according to apparent first-order kinetics with t1/2 = 0.8 μs. If this process were to represent a pseudo-first order reaction of a primary water radical with 2×10⁻⁴ μM N-Ac-CysGly6, the bimolecular rate constant for this process would be computed to k = ln 2 / t1/2 [N-Ac-CysGly6] = 4.3×10⁹ M-1s-1. Similarly, in Figure 1B the slow build-up proceeds with t1/2 = 0.7 μs at a concentration of 6×10⁻⁴ M N-Ac-CysGly6, which would correspond to a bimolecular rate constant k = 1.4×10⁹ M-1s-1. If the slow build-up of the 260 nm absorbance were due to the reaction of a primary water radical with N-Ac-CysGly6, we should have obtained similar rate constants (or different half-lives) for both peptide concentrations. Therefore, the slow build-up at 260 nm cannot be assigned to any of the reactions of the primary water radicals with N-Ac-CysGly6. These facts, together with the independence of t1/2 for the slow build-up on peptide concentrations, are consistent with an intramolecular H-transfer from GlyC-H to CysS• according to the forward reaction of equilibrium 6.
The solid lines in Figures 1A and 1B represent kinetic simulations for two different concentrations of N-Ac-CysGly6, where k6 = (1.1±0.1)×105 s-1 and k-6 = (8.9±0.4)×105 s-1, i.e. K6 = 0.123 (for a summary of k6, k-6, and K6 for all peptides, see Table 1). For these simulations, the initial radical concentrations were determined independently by dosimetry, ε260,GlyC• = 8,410 M-1cm-1 and ε260,CysS• = 73 M-1cm-1 were taken from the experimental spectra displayed in Figures 2A and 2B, k3=8×10⁸ M-1s-1 was experimentally determined from the build-up of the 260 nm absorbance during the reaction of HO• radicals with Gly6 (reaction 7; Figure 1C) and k15 = (2.0±0.5)×108 M-1s-1 was determined from the bimolecular recombination of GlyanGlyC•Glyb, generated in reaction 7 (Figure 1C). The rate constants k4 = 1×10¹⁰ M-1s-1 and k5 = 2×10⁹ M-1s-1 are by analogy to the published rate constants for the reactions of OH• and H• with Cys,22 and k16 = 9×10⁸ M-1s-1 was approximated from the known recombination rate constant of small molecular mass thiyl radicals in aqueous solution,28 taking into account the slightly larger size of our peptides. A value of k17 = 5×10⁸ M-1s-1 was taken as the mean value between rate constants k15 and k16.
Table 1.
Rate and equilibrium constants for the reversible hydrogen transfer between Cys thiyl radicals and Gly and Ala in model peptides
| Peptide | C-H donor | RS• + H-C | RSH + •C | K | Method |
|---|---|---|---|---|---|
| N-Ac-CysGly6 | Gly | k6 = (1.1±0.1)×105 s-1 | k-6 = (8.9±0.4) ×105 s-1 | K6 = 0.123 | Pulse radiolysis |
| Gly | k6 = 1.0×10⁵ s-1 | k-6 = 8.9×10⁵ s-1 | K6 = 0.123 | LFP | |
| N-Ac-CysGly2AspGly3 | Gly | k25 = 1.0×10⁵ s-1 | k-25 = 8.0×10⁵ s-1 | K25 = 0.125 | LFP |
| N-Ac-CysAla2AspAla3 | Ala | k14 = 9.2×10³ s-1 | k-14 = 1.0×10⁵ s-1 | K14 = 0.092 | Pulse radiolysis |
| Ala | k14 = 1 × 10⁴ s-1 | k-14 = 1.0×10⁵ s-1 | K14 = 0.100 | LFP |
| (15) |
| (16) |
| (17) |
Importantly, the same data set was used to simulate the kinetics for our control experiment with Gly6, shown in Figure 1C, except for two modifications reflecting the absence of Cys in this peptide: (1) k4, k6, k-6, k16 and k17 were defined as zero, as those reactions are not possible during the pulse irradiation of Gly6; (2) a rate constant k = 5×10⁹ M-1s-1 for the reaction of H• atoms with GlyanGlyC•Glyb was assumed.
N-Ac-CysAla2AspAla3
As k11 ≈ 2 k3, 22 initially the fraction of carbon centered radicals is about double that of the case with N-Ac-CysGly6. If there were similar (K6 ≈ K14) or lower equilibrium values we would expect the equilibrium to be installed starting with an excess of carbon centered radicals. Indeed, in Figure 3, we see this reflected in the decrease of absorbance in the time range 5 – 30 μs. The solid line in Figure 3 represents a simulation for 2×10⁻⁴ M N-Ac-CysAla2AspAla3, where k14 = 9.2×10³ s-1 and k−14 = 1.0×10⁵ s-1, i.e. K14 = 0.092 (Table 1). The initial radical concentrations were determined by dosimetry, and ε260,AlaαC• (≈ ε260,AspαC•) = 9,500 M-1cm-1 and ε260,CysS• = 73 M-1cm-1 were taken from the experimental spectra displayed in Figures 2B and 2C. The other parameters for the simulation were as follows (where [Ala4Asp] represents the molecular composition of the sequence of the peptide, which does not contain the radical site): k8 = 9×10⁹ M-1s-1 and k9 = 2×10⁹ M-1s-1 (approximated from the reactions of HO• and H• with Cys22), k11 = (k12) = 1.7×10⁹ M-1s-1 (by comparison to k1022), k18 = 8×10⁸ M-1s-1 was approximated from the known recombination rate constant of small molecular mass thiyl radicals in aqueous solution,28 taking into account the slightly larger size of our peptides, k19 = 2×10⁸ M-1s-1 by analogy to k15 (vide supra), and a value of k20 = 4×10⁸ M-1s-1 was taken as the mean value between rate constants k18 and k19.
| (18) |
| (19) |
| (20) |
The two dashed lines in Figure 3 were included in order to demonstrate the sensitivity of the kinetic simulation for the value of k−14. Strong deviations from the experimental data are apparent when values of 8×10⁵ s-1 and 2×10⁴ s-1 are used for k−14.
Laser flash photolysis
The double photon ionization of water represents a convenient complementary method to generate primary water radicals (HO•, H•, e-aq).29,30 Generally, our 5 ns pulses of 266 nm light (ca. 100mJ), applied to N2O-saturated water, generated on the order of 3-4 μM hydroxyl radicals, monitored through the oxidation of either Br- to Br2•- or Cl- (at pH≤ 3) to Cl2•−.
All LFP experiments with Cys-containing peptides were performed under conditions of double photon ionization of water at acidic pH (pH < 5). Under these conditions, there are negligible concentrations of thiolate present, and no direct photoionization of thiolate is observed.31 All the absorption coefficients were taken from the pulse radiolysis experiments. The kinetic simulations have been carried out under the assumption, that the products and yields of double photon ionization of water is the same in the presence of the peptides as in the presence of Cl− or Br−. Therefore, experiments with chloride and bromide were used as a calibration for the yields of primary radicals. This process was chosen in order to minimize the number of variables in the simulation and because we believe it to be physically sensible. We find some unspecified photolysis damage of the peptides upon irradiation with laser light of 266 nm, 2 × 10¹² Wm-2 power density and 100 mJ energy. At 275 nm, we treat this mathematically as a constant offset (a stepfunction starting with the laser pulse) of the traces in the order of (3 – 4) × 10-3 AU. In terms of chemistry, this corresponds to products of double photon photolysis of the peptides with low product reactivity. Because of this finding, we made no attempt to use our samples for multiple irradiations. At 330 nm detection wavelength, we find no measurable influence of direct photolysis. At this point it should be noted, that the rate constants we derive are (pseudo-)first order and are rather insensitive to the above assumptions.
In addition, in one experiment with cysteinylglycine disulfide, thiyl radicals were generated through the photolytic dissociation of a disulfide bridge (see below).
N-Ac-CysGly6
Reaction in H2O
Optical detection at 275 nm after LFP of an N2O-saturated aqueous solution of 6.13×10⁻⁴ M N-Ac-CysGly6 (data not shown) yields an absorption vs. time profile similar to that shown in Figure 1B, which was fit well over the first 20 microseconds after the laser pulse with a simulation using essentially the same parameters as described above for the pulse radiolysis data. This simulation yields k6 = 1.0 ×10⁵ s-1 and k-6 = 8.9×10⁵ s-1 (K4 = 0.123) (Table 1), consistent with the pulse radiolysis data.
We then monitored equilibrium 6 at 330 nm, where ε330,GlyC• = 2,690 M-1cm-1 and ε330,CysS• ≈ 100 M-1cm-1 (derived from Figures 2A and 2B). Figure 4a displays the absorption vs. time profile recorded after LFP of 6.13×10⁻⁴ M N-Ac-CysGly6 in N2O-saturated H2O and, as a control, of a mixture of 6.13×10⁻⁴ M N-Ac-Cys and 6.13×10⁻⁴ M N-Ac-Gly-NH2 in N2O-saturated H2O. The latter represents a mixture of the amino acid components of N-Ac-CysGly6, which have no opportunity for intramolecular H-transfer. The intermolecular rate constant is on the order of 105 M-1s-1 10 and the concentrations are below 1 mM. Therefore the intermolecular reaction rate is below 102 s-1, two to three orders of magnitude slower than our timescale. Because the molar absorptivity for glycyl radicals is virtually the same in Gly6 and N-Ac-Gly-NH2, we get a nice reference of a sample identical to N-Ac-CysGly6, but without intramolecular reactions. We do however see some radical recombination reactions (Fig 5). The difference between both traces results in the profile represented by the filled circles, which can be well fitted by first-order kinetics, where kobs,330nm = k6 + k−6 = 106 s-1. Taking the pulse radiolysis values of k6 = 1.1×10⁵ s-1, we obtain k−6 = kobs,300nm - k6 = 8.9×10⁵ s-1, which agrees well with k−6 obtained from the pulse radiolysis data.
Figure 4.

Laser flash photolysis (double photon excitation of water, 100 mM at 266 nm with detection at 330 nm) of N2O sat. solutions of 630 μM N-AcCysGly6 (grey squares in panels A and B) or mixtures of 630 μM N-Ac-Cys and 630 μM N-Ac-Gly-NH2 (grey diamonds in panels A and B). In the former cases, intramolecualr hydrogen transfer (equilibrium 6) is possible, whereas in the latter it is not. The filled circles in panels A and B represent the difference traces, so that the reactions in N-AcCysGly6 are corrected for all second order reactions. These differences represent intramolecular reactions. The kinetic isotope effect between solutions of H2O (panel A) and D2O (panel B) are clearly visible. Panel C directly compares the reactions of N-Ac-CysGly6 in D2O (grey dots, upper trace) with the ones in H2O (black dots, lower trace).
Kinetic isotope effects
Experiments were then performed in D2O in order to evaluate the kinetic isotope effects of equilibrium 6. The double photon ionization in D2O yields DO•, D•, and e-aq, where e-aq reacts further with N2O to give DO• radicals. Figure 4B displays the absorption vs. time profile recorded after LFP of 6.13×10⁻⁴ M N-Ac-CysGly6 in N2O-saturated D2O and, as a control, of a mixture of 6.13×10⁻⁴ M N-Ac-Cys and 6.13×10⁻⁴ M N-Ac-Gly-NH2 in N2O-saturated D2O. Again, a difference trace (represented by the closed circles) is calculated by subtraction of the trace from N-AcCys/N-Ac-Gly-NH2 from that of N-Ac-CysGly6. Figure 4C displays an overlay of the absorbance vs. time profile at 330 nm, recorded for N-Ac-CysGly6 in H2O and D2O. Two important differences between the results in H2O and D2O are apparent. (1) In D2O, the initial absorbance at 330 nm at 500 ns after the laser flash is approximately two-fold higher compared to that in H2O, and this holds also true for the difference traces recorded in H2O and D2O. (2) The difference trace in D2O (Figure 4B) shows a slow decay, measured over ca. 10 μs, in contrast to the difference trace recorded in H2O. Both features can be rationalized. First, the higher initial absorbance at 500 ns after the flash reflects a small increase of the fraction of DO• reacting with the Gly moiety at the expense of the CysSD moiety due to a primary kinetic isotope effect for the reaction of DO• with CysSD (in D2O) vs. HO• with CysSH (in H2O). The absorbance coefficient of GlyC• (ε330,GlyC• = 2,690 M-1cm-1) is significantly higher compared to that of CysS• (ε330,CysS• ≈ 100 M-1cm-1), so that the initial absorbance at 330 nm must be higher in D2O than in H2O. This kinetic isotope effect is also reflected in the control experiments in H2O and D2O, where the LFP of the N-Ac-Cys/N-Ac-Gly-NH2 mixture generates a higher initial absorbance in D2O as compared to H2O. Second, the slow decay over longer times recorded after LFP of N-Ac-CysGly6 in D2O suggests a significantly slower adjustment of equilibrium 6 in D2O compared to H2O. In H2O, the reaction of primary radicals with N-Ac-CysGly6 generates an excess of CysS•, which then equilibrates under the formation of a higher proportion of GlyC•. In contrast, in D2O the reaction of primary radicals with N-Ac-CysGly6 generates an excess of GlyC•, which then equilibrates under formation of a higher proportion of CysS•. In D2O, equilibrium 6 will initially adjust with an overall rate constant Dkobs,1 = k6H+k−6D until all reactive Gly(C-H) bonds are converted into Gly(C-D) when Dkobs,1 changes to Dkobs,2 = k6D+k−6D (our mass spectrometry experiments with linear heptapeptides16 show that the reaction of CysS• is most efficient with Gly in position i+1 and i-1, i.e. we expect that the most reactive Gly residue in N-Ac-CysGly6 is Gly in position i+1 from Cys). A first-order fit of the difference trace in Figure 4B is shown by the solid line. A more detailed analysis is given in Figure 5, where the absorption vs. time trace in D2O is fitted (least differences fit) with biexponential kinetics yielding Dkobs,1 = 1.6×10⁵ s-1 and Dkobs,2 = 6.6×10⁴ s-1. The primary kinetic isotope effects can now be calculated through equations II-V, where in H2O, k−6H = 8.9×10⁵ s-1 and k6H = 1.1×10⁵ s-1 (Table 1).
| (II) |
| (III) |
| (IV) |
| (V) |
The maximal value of a classic primary isotope effect can be estimated through equation VI,32 where represents the wave number of the stretching mode of the reacting X-H bond.
| (VI) |
For the S-H bond of thiols, ≈ 2,600 cm-1 33, so that log (kH/kD)max ≈ 0.83, and (kH/kD)max ≈ 6.8. The latter value agrees well with the experimentally observed k6H/k6D = 6.9. However, the very large kinetic isotope effect k−6H/k−6D = 17.8 would suggest a contribution of tunneling to the hydrogen transfer process.34-36
N-Ac- CysAla2AspAla3
Figure 6 displays an absorption vs. time profile recorded at 275 nm after LFP of 6.13×10⁻⁴ M N-Ac-CysAla2AspAla3 in N2O-saturated H2O. The solid line represents a simulation, where k14 = 1.0×10⁴ s-1 and k−14 = 1.0×10⁵ s-1, i.e. K14 = 0.10 (Table 1). Analogous to the pulse radiolysis experiment, hydroxyl radicals will initially react with Cys, Ala, and Asp (reactions 8, 11 and 12) before final equilibration between CysS• and AlaαC• will occur (reactions 13 and 14). The initial radical concentrations were determined from ε275,AlaαC• (≈ ε275,AspαC•) = 8,000 M-1cm-1 and ε275,CysS• = 78 M-1cm-1 (vide supra). The other parameters for the simulation were as described for the pulse radiolysis experiments, i.e. k8 = 1×10¹⁰ M-1s-1, k11 = k12 = 1.7×10⁹ M-1, k13 = 8.75×10³ s-1, k18 = 8×10⁸ M-1s-1, k19 = 2×10⁸ M-1s-1, and k20 = 4×10⁸ M-1s-1.
Figure 6.

Laser flash photolysis (double photon excitation of water, 100 mJ at 266 nm with detection at 275 nm) of an N2O saturated aqueous solution of 613 μM N-Ac-AlaAlaAspAlaAlaAla. All rate constants for the simulation (full line) are taken the same as in figure 3 except for k14 which differs by 8% (see table 1)
N-Ac- CysGly2AspGly3
Analogous to N-Ac-CysAla2AspAla3, the reaction of HO• radicals with N-Ac- CysGly2AspGly3 will initially target Cys, Gly and Asp (reactions 21-23). Subsequently, AspαC• radicals will almost irreversibly react with Cys (reaction -24) and ultimately allow for equilibration between CysS• and GlyC• (reaction 25). The latter will occur for the same reason discussed already for N-Ac-CysAla2AspAla3, i.e. the fact that the reaction of thiyl radicals with Gly proceeds significantly faster than the reaction of thiyl radicals with Asp.10
| (21) |
| (22) |
| (23) |
| (24) |
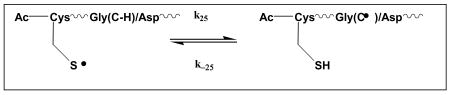 |
(25) |
The LFP of an N2O-saturated aqueous solution of 6.13×10⁻⁴ M N-Ac-(CysSH)Gly2AspGly3 yielded an absorption vs. time trace at 275 nm (Figure S1; Supplementary Materials), which was well simulated with k25 = 1×10⁵ s-1 and k−25 = 8×10⁵ s-1, i.e. rate constants expected based on the data presented for N-Ac-CysGly6 (vide supra). Best values for the H•-transfer rate constant in reaction 24 are k24 < 4 × 10³ s-1, k−24 = 4 × 10⁵ s-1 and, consequently, K24 < 0.01.
 |
(26) |
2. Reversible H-atom transfer in small model compounds
Experiments with two small models were performed to demonstrate the reversible H-atom transfer with (i) a molecule which essentially only contains a mercaptoalkyl-substituted Gly residue (2-mercaptopropionylglycine) and (ii) an alternative entry into thiyl radicals, i.e. the photolysis of a disulfide bond (cysteinylglycine disulfide).
2-Mercaptopropionylglycine
2-Mercaptopropionylglycine represents a simple model compound for the investigation of reversible intramolecular H-transfer processes between a thiyl radical and Gly. Figure 7 displays the absorption vs. time profiles recorded at 330 nm over 50 μs after the LFP of 6×10⁻⁴ 2-mercaptopropionylglycine in N2O-saturated H2O and D2O, respectively. As for N-Ac-CysGly6, we observe a higher initial absorbance in D2O, consistent with a higher relative yield of GlyC• in D2O compared with H2O. Importantly, in H2O there is no further change to the 330 nm absorbance beyond 1 μs after the laser pulse, indicating that any adjustment of equilibrium 26 in H2O must be significantly faster compared to equilibrium 6 or, more probable, that the primary radical reactions directly create a distribution of thiyl and carbon centered radicals that matches equilibrium 26. On the other hand, for the same experiment in D2O, we observe a pronounced decay of the 330 nm absorbance over ca. 25 μs. This observation is consistent with an “overproduction” of GlyC• in D2O, as already described for N-Ac-CysGly6 in D2O, which subsequently equilibrates with the thiyl radical through equilibrium 26. The decay kinetics in D2O can be fitted with first-order kinetics, where Dkobs = 1.38×10⁵ s-1, again comparable to the value of Dkobs,1 = 1.6×10⁵ s-1 obtained for N-Ac-CysGly6 in D2O.
Figure 7.

Laser flash photolysis of 600 μM 2-mercaptopropioglycine in N2O saturated water. The excitation wavelength was 266 nm and 100 mJ pulses were used. Grey squares: Reaction in D2O, black triangles: in H2O. In D2O a distinct change of absorption is visible in the time range 3 – 30 μs, which can be described by a first order process with Dkobs = 1.4×10⁵ s-1.
Cysteinylglycine disulfide, (CysGly)2
The photolytic cleavage of the cystine disulfide bond yields predominantly thiyl radicals.37 These thiyl radicals, (CysS•)Gly, will equilibrate with GlyC• through equilibrium 27. An important parameter in these experiments is, that the initial radical in both solvents, H2O and D2O, is (CysS•)Gly(C-H), and that no GlyC• radicals are initially present. This experimental situation is different from the entry into thiyl radicals via the reaction of primary water radicals with Cys-containing peptides and model compounds.
| (27) |
Figure 7 displays an absorbance vs. time trace, recorded at 330 nm, after 266 nm (20 mJ laser energy) photolysis of 1 mM (CysGly)2 in N2O-saturated H2O or D2O containing 1 M tBuOH, respectively. While the kinetics for absorbance build-up in H2O and D2O are of first order, the respective values for kobs are significantly different, Hkobs = 1.3×10⁶ s-1 and Dkobs = 6×10⁵ s-1, respectively. This can be rationalized by the fact that Hkobs = k27 + k−27 but Dkobs = k27 + k29 In D2O, the product of the forward reaction 27, (CysSH)GlyC•, undergoes H/D exchange at the mercapto group (reaction 28), yielding (CysSD)GlyC•, so that the rate constant for the reverse reaction in D2O, k29, is smaller than that of the analogous process in H2O, k-27,H.
| (28) |
| (29) |
In general, the trend of Hkobs > Dkobs observed for thiyl radicals from cysteinylglycine is comparable to that observed with all the other investigated peptides and model compounds. The only difference is the significantly higher numerical values for Hkobs and specifically Dkobs. The signals in these experiments are very low, (1 – 2) × 10-3 AU, and will therefore have a considerable error. We considered these experiments mainly as “proof of concept” but note the good quantitative agreement with the other experiments.
Discussion
The present data provide absolute rate constants for reversible intramolecular H-atom transfer between Cys thiyl radicals and the αC-H bonds of Gly and Ala in various model peptides. While only αC-H bonds are available in Gly, our previous results on bimolecular reactions12 demonstrate that the αC-H group is also the main target for H-atom transfer from Ala. Several important features must be noted. (i) For all peptides under investigation, the rate constant for H-atom abstraction by thiyl radicals (k6, k14, k25) is lower compared to that for the reverse reaction, H-atom abstraction by the αC• radicals from Cys (k−6, k−14, k−25). (ii) The substitution of Gly with Asp at position i+3 relative to Cys has no significant influence on the rate constants for H-atom transfer, evident through comparable values for k6 and k25 and for k−6 and k−25 for the two peptides N-Ac-CysGly6 and N-Ac-CysGly2AspGly3. This was expected based on our mass spectrometry data with a small linear peptide16, demonstrating that the residues in position i+1 (and i-1) show the highest reactivity with CysS•. (iii) The H-atom transfer reactions show normal primary kinetic isotope effects; however, specifically the large primary kinetic isotope effect of k−6H/k−6D = 17.8 suggest that tunneling contributes to the H-atom transfer reaction.
Our earlier kinetic NMR experiments provided rate constants for the bimolecular reaction of cysteamine thiyl radicals with N-Ac-Gly-NH2 and N-Ac-Ala-NH2 of 6.4×10⁴ M-1s-1 and 1.0×10⁴ M-1s-1, respectively,10 indicating a 6.4-fold faster reaction with the Gly moiety. The intramolecular reactions studied in the present work reveal a ca. 12-fold higher reactivity of Gly over Ala (cf. k6 = 1.1×10⁵ s-1 and k14 =9×10³ s-1). Importantly, a similar trend is observed for the reverse reactions, where the average values are k-6 = 8.5×10⁵ s-1 and k-14 = 0.85×10⁴ s-1, i.e. differ by a factor of 10. Therefore, despite the large differences in the individual rate constants, the average values for the equilibrium constants K6 = 0.125 and K14 = 0.10 are not too different. The close similarity of these equilibrium constants could be rationalized by the comparable homolytic bond dissociation enthalpies of the αC-H bonds of Gly and Ala (BDE = 350 and 345 kJ/mol, respectively), calculated by Rauk et al.6,7 for fully extended conformations of small model peptides. However, the fact that K6, K14 < 1.0 would not be consistent with the absolute numbers, where BDE(αC-H) = 345 and 350 kJ/mol and BDE(S-H) = 330-370 kJ/mol would predict that K6, K14 ≥ 1.0. Hence, the low absolute values of K6 and K14 suggest that BDE(αC-H) > 370 kJ/mol, which would indicate significant secondary structure of the peptides different from a fully extended conformation, and Φ,Ψ ≠ 180°. The latter is consistent with spectroscopic data on small Gly and Ala-containing peptides.17,20
The biological significance of the measured rate constants will be discussed with the help of Scheme 1, where equilibrium 30 represents the general intramolecular H-atom transfer equilibrium between CysS• and αC-H.
Scheme 1.

| (VII) |
The addition of oxygen to CysS• is reversible,38 with k31 = 2.2×10⁹ M-1s-1 and k-31 = 6.3×10⁵ s-1, whereas the addition of oxygen to αC• is irreversible (k33 ≈ 2×10⁹ M-1s-1),39 yielding peroxyl radicals. The latter will serve as precursors for fragmentation pathways as well as potential chain reactions of protein oxidation.40,41 The thiylperoxyl radical, CysSOO•, rearranges to the sulfonyl radicals (CysS•O2) with k32 = 2×10³ s-1 (37°C).38 Assuming steady-state conditions12, equation VII predicts that at a physiologic oxygen concentration of ca. 30 μM42, initial CysS• radicals would yield carbon-centered peroxyl radicals from Gly and Ala to an extent of 97% and 94%, respectively, based on the rate constants summarized in Table 1 and, in a first approximation, neglecting any reaction with endogenous glutathione and ascorbate.
| (34) |
If we include the possibility that CysS• radicals react freely with maximally 1 mM ascorbate (Asc−; reaction 34; k34 = 6×10⁸ M-1s-1 43), ca. 8% of CysS• would convert Gly into carbon-centered peroxyl radicals (reaction 33). Such an efficient reaction with ascorbate is, however, rather unlikely in vivo as specifically protein Cys residues will not necessarily be fully accessible to ascorbate. Hence, initially formed protein thiyl radicals will have a pronounced tendency to attack additional amino acids within proteins, leading to precursors for aggregation and fragmentation. This potential role of thiyl radicals has not been given much attention before,44 as usually thiyl radicals are considered rather stable “sinks” of thiol oxidation processes.
H-atom transfer reactions of thiyl radicals in proteins need also be considered as potential sources for protein degradation in pharmaceutical formulations. Frequently, these formulations contain detergents such as Tween, which accumulate peroxides and react with trace levels of transition metals to yield carbon- and oxygen-centered radicals.45 The latter will react with protein Cys residues under formation of thiyl radicals, which can then attack the αC-H bonds of additional amino acids resulting in peroxyl radical formation and subsequent fragmentation and aggregation. In this way, the protein Cys residues can function as catalysts for the oxidation of additional amino acid residues, which would normally not be attacked by primary oxidants present in the system. The concept of thiols acting as catalysts for H-transfer reaction between organic radicals and H-donors has been recognized in the field of synthetic organic chemistry (referred to as “polarity reversal catalysis” 46,47), but may be equally if not more important in the field of protein oxidation relevant to biological conditions of oxidative stress and the biotechnology industry.
Supplementary Material
Figure S1 is available as supporting information. This material is available free of charge via the internet at http://pubs.acs.org.
Figure 8.

Laser flash photolysis of (CysGly)2 (disulfide photolysis). The installation of the equilibrium between sulfur and carbon centered radicals is observed. The intramolecular reaction is slower in D2O, because of isotope effects. The excitation was done with 20 mJ pulses of 266 nm light. The solutions were N2O saturated and contained 1 mM (CysGly)2. We added 1 M tBuOH to scavenge immediately all putative products of double photon photolysis of water. The traces shown are averages of 5 experiments. As the signals are very small, these experiments are considered as proof of concept, because they provide an alternative entry into the radical reaction cascade. Nevertheless, they agree well with the data obtained by pulse radiolysis or double photon photolysis of water.
Acknowledgments
Financial support from the ETH Zürich and the NIH (PO1AG12993) is gratefully acknowledged.
Footnotes
Absorption units are dimensionless
Nauser, T.; Gebicki, J., unpublished results.
References
- 1.Stubbe J, van der Donk WA. Chem Rev. 1998;98:705–762. doi: 10.1021/cr9400875. [DOI] [PubMed] [Google Scholar]
- 2.Himo F, Siegbahn PEM. Chem Rev. 2003;103:2421–2456. doi: 10.1021/cr020436s. [DOI] [PubMed] [Google Scholar]
- 3.Himo F, Eriksson LA. J Am Chem Soc. 1998;120:11449–11455. [Google Scholar]
- 4.Becker A, Fritz-Wolf K, Kabsch W, Knappe J, Schultz S, Wagner AFV. Nat Struct Biol. 1999;6:969–975. doi: 10.1038/13341. [DOI] [PubMed] [Google Scholar]
- 5.Becker A, Kabsch W. J Biol Chem. 2002;277:40036–40042. doi: 10.1074/jbc.M205821200. [DOI] [PubMed] [Google Scholar]
- 6.Rauk A, Yu D, Shustov TGV, Block DA, Armstrong DA. Biochemistry. 1999;38:9089–9096. doi: 10.1021/bi990249x. [DOI] [PubMed] [Google Scholar]
- 7.Rauk A, Yu D, Armstrong DA. J Am Chem Soc. 1998;120:8848–8855. [Google Scholar]
- 8.Rauk A, Yu D, Armstrong DA. J Am Chem Soc. 1997;119:208–217. [Google Scholar]
- 9.Himo F, Eriksson LA. J Chem Soc Perkin Trans 2. 1998:305–308. [Google Scholar]
- 10.Nauser T, Schöneich Ch. J Am Chem Soc. 2003;125:2042–2043. doi: 10.1021/ja0293599. [DOI] [PubMed] [Google Scholar]
- 11.Reid DL, Armstrong DA, Rauk A, von Sonntag C. Phys Chem Chem Phys. 2003;5:3994–3999. [Google Scholar]
- 12.Nauser T, Pelling J, Schöneich Ch. Chem Res Toxicol. 2004;17:1323–1328. doi: 10.1021/tx049856y. [DOI] [PubMed] [Google Scholar]
- 13.Zhao R, Lind J, Merényi G, Eriksen TE. J Am Chem Soc. 1994;116:12010–12015. [Google Scholar]
- 14.Grierson L, Hildenbrand K, Bothe E. Int J Radiat Biol. 1992;62:265–277. doi: 10.1080/09553009214552111. [DOI] [PubMed] [Google Scholar]
- 15.Zhao R, Lind G, Merényi G, Eriksen TE. J Chem Soc Perkin Trans 2. 1997:569–574. [Google Scholar]
- 16.Mozziconacci O, Sharov VS, Williams TD, Kerwin B, Schöneich Ch. J Phys Chem B. 2008;112:9250–9257. doi: 10.1021/jp801753d. [DOI] [PubMed] [Google Scholar]
- 17.Ohnishi S, Kamikubo H, Onitsuka M, Kataoka M, Shortle D. J Am Chem Soc. 2006;128:16338–16344. doi: 10.1021/ja066008b. [DOI] [PubMed] [Google Scholar]
- 18.Improta R, Barone V, Kudin KN, Scuseria GE. J Chem Phys. 2001;114:2541–2549. doi: 10.1021/ja003680e. [DOI] [PubMed] [Google Scholar]
- 19.Improta R, Barone V, Kudin KN, Scuseria GE. J Am Chem Soc. 2001;123:3311–3322. doi: 10.1021/ja003680e. [DOI] [PubMed] [Google Scholar]
- 20.Schweitzer-Stenner R, Eker F, Huang Q, Griebenow K. J Am Chem Soc. 2001;123:9628–9633. doi: 10.1021/ja016202s. [DOI] [PubMed] [Google Scholar]
- 21.Von Sonntag C. The Chemical Basis of Radiation Biology. Taylor & Francis; London: 1987. [Google Scholar]
- 22.Buxton GV, Greenstock CL, Helman WP, Ross AB. J Phys Chem Ref Data. 1988;17:513–886. [Google Scholar]
- 23.Schuler RH, Hartzell AL, Behar B. J Phys Chem. 1981;85:192–199. [Google Scholar]
- 24.Simic M, Neta P, Hayon E. J Am Chem Soc. 1970;92:4763–4768. doi: 10.1021/ja00719a001. [DOI] [PubMed] [Google Scholar]
- 25.Hayon E, Simic M. J Am Chem Soc. 1971;93:6781–6786. doi: 10.1021/ja00754a013. [DOI] [PubMed] [Google Scholar]
- 26.Mieden OJ, von Sonntag C. Z Naturforsch. 1989;44b:959–974. [Google Scholar]
- 27.Hawkins CL, Davies MJ. J Chem Soc Perkin Trans 2. 1998:2617–2622. [Google Scholar]
- 28.Hoffman MZ, Hayon E. J Am Chem Soc. 1972;94:7950–7957. [Google Scholar]
- 29.Reuther A, Laubereau A, Nikogosyan DN. J Phys Chem. 1996;100:16794–16800. [Google Scholar]
- 30.Görner H, Nikogosyan DN. J Photochem Photobiol B: Biology. 1997;39:84–89. [Google Scholar]
- 31.Tung T, Stone JA. J Phys Chem. 1974;78:1130–1133. [Google Scholar]
- 32.Schowen RL. Prog Phys Org Chem. 1972;9:275–332. [Google Scholar]
- 33.Hesse M, Meier H, Zeeh B. Spektroskopische Methoden in der Organischen Chemie. Thieme Verlag; Stuttgart: 1979. p. 67. [Google Scholar]
- 34.Kwart H. Acc Chem Res. 1982;15:401–408. [Google Scholar]
- 35.Williams F, Sprague ED. Acc Chem Res. 1982;15:408–415. [Google Scholar]
- 36.Klinman JP. Biochim Biophys Acta. 2006;1757:981–987. doi: 10.1016/j.bbabio.2005.12.004. [DOI] [PubMed] [Google Scholar]
- 37.Morine GH, Kuntz RR. Photochem Photobiol. 1981;33:1–5. [Google Scholar]
- 38.Zhang X, Zhang N, Schuchmann HP, von Sonntag C. J Phys Chem. 1994;98:6541–6547. [Google Scholar]
- 39.Mieden OJ, Schuchmann MN, von Sonntag C. J Phys Chem. 1993;97:3783–3790. [Google Scholar]
- 40.Davies MJ. Biochim Biophys Acta. 2005;1703:93–109. doi: 10.1016/j.bbapap.2004.08.007. [DOI] [PubMed] [Google Scholar]
- 41.Neuzil J, Gebicki JM, Stocker R. Biochem J. 1993;293:601–606. doi: 10.1042/bj2930601. [DOI] [PMC free article] [PubMed] [Google Scholar]
- 42.Hogan MC. J Appl Physiol. 1999;86:720–724. doi: 10.1152/jappl.1999.86.2.720. [DOI] [PubMed] [Google Scholar]
- 43.Wardman P, von Sonntag C. Methods Enzymol. 1995;251:31–45. doi: 10.1016/0076-6879(95)51108-3. [DOI] [PubMed] [Google Scholar]
- 44.Schöneich Ch. Chem Res Toxicol. 2008;21:1175–1179. doi: 10.1021/tx800005u. [DOI] [PubMed] [Google Scholar]
- 45.Harmon PA, Kosuda K, Nelson E, Mowery M, Reed RA. J Pharm Sci. 2006;95:2014–2028. doi: 10.1002/jps.20668. [DOI] [PubMed] [Google Scholar]
- 46.Roberts BP. Chem Soc Rev. 1999;28:25–35. [Google Scholar]
- 47.Dang HS, Roberts BP, Tocher DA. J Chem Soc Perkin Trans 1. 2001:2452–2461. [Google Scholar]
Associated Data
This section collects any data citations, data availability statements, or supplementary materials included in this article.
Supplementary Materials
Figure S1 is available as supporting information. This material is available free of charge via the internet at http://pubs.acs.org.