

Abstract
Purpose
For intermediate and high risk prostate cancer, seminal vesicle (SV) is included in clinical target volume (CTV). The purposes of this study were to investigate interfraction motion characteristics of SV and to determine proper margins for online CT image guidance.
Methods and Materials
Twenty-four patients each with 16 daily helical CTs were included in this study. Binary image mask were used for image registration to determine daily organ motion. Two online image-guided radiotherapy (IGRT) strategies (prostate only and prostate+SV) were simulated in a hypo-fractionated scheme. Three margin designs were studied for both 3DCRT and IMRT. In prostate only guidance, Margin-A was uniformly applied to whole CTV, Margin-B was applied to SV with a fixed 3mm prostate margin. In prostate+SV guidance, Margin-C was uniformly applied to CTV. The minimum margins were sought to satisfy the criteria that minimum cumulative CTV dose to be more than those of PTV in the plan for > 95% patients.
Results
Prostate and SV move significantly more in anterior-posterior and superior-inferior than right-left direction. The anterior-posterior motion of prostate and SV are correlated (R2=0.7). The SV moves significantly more than prostate. The minimum margins found were 2.5mm for 3DCRT, and (4.5,4.5,3.0) mm for Margin-(A,B,C) for IMRT. Margins for IMRT were larger, but the irradiated volume and doses to critical structures were smaller. Minimum margins of 4.5mm to SV and 3mm to prostate are recommended for IMRT with prostate only guidance.
Conclusions
SV moves independently from prostate gland and additional margins are necessary for IGRT.
Keywords: Image-guided radiation therapy, Prostate and Seminal Vesicle, Margin, Image registration, Cumulative dose
1 Introduction
For intermediate and high risk prostate cancer patient, the seminal vesicles (SV) is usually involved and included in the clinical target volume (CTV) (1). It has been shown that irradiation of the SV improved the overall and biochemical survivals for these groups of patients (2). The inter-fraction motion and shape change (deformation) of prostate gland and SV can be quite different due to their anatomic locations and structures. Roeske et al. (3) pointed out that prostate volumes varied by ~10% during the treatment course, and the SV volumes by as much as 100%. Deurloo et al. (4) used repeated CT to measure the distance between individual SV contour with the average SV, and found that SV motion in anterior-posterior (AP) direction was mostly driven by the prostate and bladder. However, no studies on the motion and deformation of the composite target volume of prostate and SV, especially the dosimetric effects, have been performed.
With the emergence of image guided radiation therapy (IGRT), the daily target motion could be fully or partially compensated using planning margins (5). Previous simulations had some successes in correcting motion by shifting couch positions (6). Smitsmans et al. (7) studied the feasibility of image guidance using cone beam CT (CBCT), the success rate was determined to be 65% to 83% using manual contour-to-contour registration as reference. The planning margin for IGRT can be reduced, but a certain amount is still required to compensate the deformation. Studies have shown the feasibility to detect daily prostate position using implanted markers (8). However, when SV was included in target volume, the dose reduction for SV could be significant if only prostate is used in image guidance. The SV moves independently of prostate gland and can move significantly more. This constitutes a non-rigid multi-body motion problem and poses a special challenge for IGRT. Several investigators have explored the options of online planning and replanning to handle this type of multi-target deformation involving seminal vesicles (9, 10). However, all of them require the availability of online target contours at treatment time and assume the capability of instant treatment planning, both of which are not yet practical in the clinic.
The purposes of this study were to investigate the interfraction motion characteristics of prostate and SV, and to determine proper margins for online CT image guidance. We assessed the motion of prostate and SV based on multiple daily helical CT (HCT) during treatment course. We evaluated two online image guidance techniques with three margin designs based on prostate alone or prostate+SV. The emphasis is on the online guidance which is more practical currently rather than online replanning. The minimum margins were determined for different IGRT strategies based on pre-defined dosimetric criteria. Two widely adopted treatment modalities in external beam radiotherapy, 3D conformal radiation therapy (3DCRT) and intensity-modulated radiation therapy (IMRT) were both investigated.
2 Methods and Materials
2.1 Patient Data and Treatment Planning
Twenty-four patients (24) were included in this study. Each patient had at least 16 helical CTs (HCT) in supine position during treatment course. Patient legs were placed within the “W” shaped sponge and feet banded together. Urethra contrast was used in planning CT scan. All CTs for the same patient (3 mm slice thickness) were initially registered together based on bony anatomy, therefore, setup error was removed and only the organ motion was investigated. Contours for prostate, SV, bladder, and rectal wall were delineated on each CT.
Two delivery modalities were simulated using 18MV photons: 4-field parallel-opposed 3D conformal radiotherapy (3DCRT) and 5-field non-opposing intensity-modulated radiotherapy (IMRT). Similar to our previous study (5), a hypo-fractionation scheme was simulated with 15 fractions with 3.9 Gy per fraction. For 3DCRT, the planning target volume (PTV)-to-block margin was chosen as 7 mm in the anterior–posterior (AP) and left–right (LR) directions and 12 mm in the superior–inferior (SI) direction, the standard practice in our institution to provide most conformal dose distributions. In IMRT planning, a standard set of optimization objectives and constraints (not shown) were used for all patients. For proper comparisons, both 3DCRT and IMRT plans were normalized so that the D99 of the PTV equals the prescription dose.
A range of CTV-to-PTV margins were investigated. For each patient, an initial plan (3DCRT or IMRT) was constructed based on the planning CT. The density for bladder and rectum was overridden with 1.0g/cm3, which is standard practice at our institution. Then, the initial plan was applied to each daily HCT of the same patient, with the isocenter shifted to simulate the couch translation on each daily treatment. No rotations for collimator angle, gantry angle or couch angle were performed as part of correction. The dose distribution was then recomputed to form the daily dose distribution, which was combined with the deformable organ registration (11) to compute the cumulative dose distributions.
2.2 Organ motion
The organ motion was measured in the following way. Each organ (region of interest) is represented by a binary image mask (BIM) created from the Pinnacle3 based on the organ contours. The BIM has the same resolution of CT image, with the voxel value set to 1 if it belongs to the organ, and 0 otherwise. The rigid registration was then performed between the reference BIM, derived from the planning CT, and the target BIM from daily HCT. The transformation matrix of the registration is considered as the daily organ motion. For this study, the registrations were limited to translations only because we only simulated the standard couch shift to correct the inter-fraction motions. Three separate registrations were performed for each daily CT: prostate only, SV only, prostate+SV. The algorithms used in the registration were based on the Insight Toolkit (ITK) image registration functions (12). The relative motion of SV w.r.t the prostate was obtained by computing the difference form the two transformation matrices.
An alternative to the BIM based registration is to use the grey value based image registrations (13), in which the CT pixel value, a continuous number between 0 and 4096, is directly used in the registration algorithm, and contouring may not be necessary. However, this technique is typically suitable in high-contrast regions where with less ambiguity in identifying tumors and surrounding soft tissues. This is generally not the case for pelvic region where the contrast between prostate/SV and surrounding region is low. Another alternative method commonly used is the translation-only center of mass (COM) method. We evaluated the following three registration methods in our study.
Registration with normalized correlation metric :
Registration with kappa-statistics metric:
Center of mass (COM) difference between A and B.
Where A and B are the reference and target BIM, Ai and Bi is the i-th pixel of A and B. The first two methods were available from ITK software package (12). To evaluate the accuracy of these techniques, we adopted the concept of volume overlap index (OI)
| (1) |
where the subscript 0 represents the reference CT, and k represents daily HCT. Each BIM represents prostate alone, SV alone, or prostate+SV. The TM is the transformation matrix. The best registration technique shall produce the highest OI, and will be used as for online image guidance.
2.3 Online Image Guidance Strategy and Margin Design
A typical treatment session of the hypo-fractionated online IGRT includes patient setup, cone-beam CT (CBCT) scan, image registration, setup correction through couch translation, and treatment delivery followed by optional post treatment imaging. Two image guidance correction methods were simulated in this study:
Online correction is based on prostate only. Currently the CBCT image quality is inadequate for accurate grey-value registration, therefore, we use this method to simulate commonly used marker-based guidance, in which fiducial markers are implanted in the prostate gland. Two margin designs were investigated for this: Margin-A was a uniform margin for whole CTV (prostate+SV). Margin-B was a non-uniform design, in which a fixed 3 mm margin is applied to prostate and a different margin to SV. The fixed margin was chosen based on our previous study that showed a 3 mm margin was adequate for low-risk prostate cancer patient (CTV=prostate) with IGRT (5). The SV margin is usually larger than 3mm because the online correction is based on prostate only.
Online correction is based on whole CTV (prostate+SV). This is to simulate an ideal situation in which both prostate and SV can be clearly identified on daily CT and perfect registration can be made based on whole CTV. In this case, a uniform Margin-C was designed for the whole CTV.
Fig. 1 demonstrates these two methods. Compared with the initial plan (1a), part of the daily CTV was blocked due to the daily change of shape and position (1b). Part of SV was blocked after prostate-only correction (1c). The coverage of SV improved a lot 1(d) when correction was based on whole CTV with only a small part of prostate still blocked. Margin types (A,B,C) are summarized in Table 1.
Figure 1.
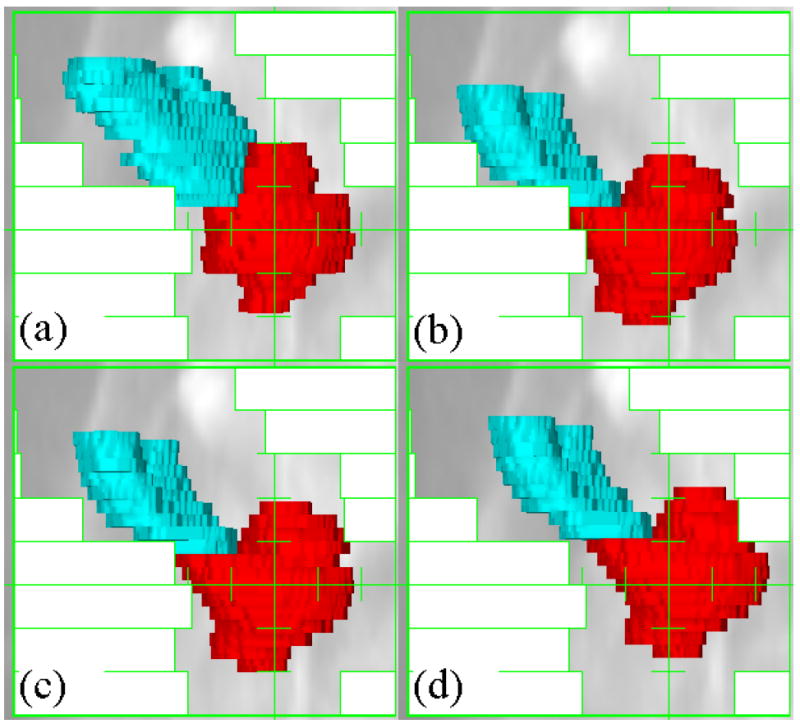
Illustration of the online image guidance in beam-eye views of an IMRT segment. Red = Prostate, Blue = Seminal Vesicles. (a) Initial plan (b) Daily CTV without correction (c) Correction based on prostate. (d) Correction based on the prostate + seminal vesicle.
Table 1.
Margins for different online image guidance strategies. Margins are isotropic and applied to CTV including both prostate and SV.
| Margin Design | Online Image Guidance Type | Margin Type and Ranges |
|---|---|---|
| A | Prostate Only | Variable for both prostate and SV |
| B | Prostate Only | Fixed 3 mm for prostate, Variable for SV |
| C | Prostate + SV | Variable for both prostate and SV |
2.4 Geometric Evaluation
We further extended the concept of volume overlap index (OI) to evaluate the geometry CTV coverage with online image guidance in the margin study
| (2) |
where PTVm is the PTV with margin m, CTVi is the daily CTV at fraction i, and TM is the transformation matrix, CTVcov(m,i) ranges from 0 to 1. Because the CT slice thickness (3 mm) from HCT and is typically larger than the axial resolution, the margin in SI direction is usually rounded up. For example in Pinnacle3, if a margin <1.5mm (half slice thickness) results in zero expansion in SI direction, 1.5mm ≤ margin <4.5mm leads to 3 mm (one CT slice) expansion, and margin of 4.5 mm will create expansions of 2 slices. The CTVcov(m,i) was calculated based on the PTVs created in Pinnacle3 system.
2.5 Dosimetric Evaluation
To reconstruct the daily doses, the plan isocenter was shifted based on the online correction, the MUs and beam/segment apertures remained the same and the dose was re-calculated. Doses for CTV and critical structures were accumulated using a deformable registration method to account for the inter-fractional shape change (11). A range of margins were studied and the minimum margin values were sought to satisfy the predefined criteria: the D99 (minimum dose) and/or generalized equivalent uniform dose (gEUD) of CTV should not be less than prescription dose, or D99 of the PTV in original plan with 95% confidence. In our study, this criteria means that ≤1 patient is permitted to have D99(CTVcumulative) < D99(PTVPlan). The parameter of gEUD was chosen as -10 for CTV. For organs-at-risk (OARs), the parameter of gEUD was chosen as 10 (14). Also, Dmean for OARs were computed.
We also computed the conformity index, CI95, a measure for dose conformity. It is defined as the ratio of 95% isodose line volume to the CTV0 volume. The larger the CI95 was, the more normal tissue were irradiated with high dose. The CI95 is the same for margin-A and margin-C with the same margins because it was computed on planning CT.
3 Results
3.1 Image registration and organ motion
Table 2 lists overlap indices for three registration methods as well as the un-corrected results for all patients. Automatic image registration improved significantly the value of overlap indices. However, there was no major difference among these methods. The normalized cross correlation method produced the best OI values, and its results were used in the subsequent simulations.
Table 2.
Target volume overlap index for different registration methods from all 24 patients each with 15 separate registrations. The first number is the mean, and the second the standard deviation.
| Uncorrected (Bony Registration) | Normalized cross correlation1 | kappa-statistics metric1 | Center of Mass | |
|---|---|---|---|---|
| Prostate only | 0.714±0.115 | 0.892±0.051 | 0.887±0.050 | 0.887±0.052 |
| Prostate + SV | 0.667±0.140 | 0.852±0.070 | 0.847±0.069 | 0.842±0.075 |
| SV only | 0.479±0.216 | 0.753±0.097 | 0.738±0.101 | 0.737±0.101 |
The average OI was 0.89 for prostate, and significantly lower for SV was at 0.75, indicating that the SV shape changes are more pronounced. The OI for prostate+SV was in-between at 0.85. The cumulative distributions of OI is shown in Fig. 2(a). In >48% of treatment fractions the prostate OI was higher than 0.9, it was reduced to only 5% for SV. Fig. 2(b) shows the absolute volume of daily prostate and SV that are outside of their corresponding volumes in reference CT after perfect correction, i.e., Volume(Organk) − Volume(Organ0 ∩ TM[Organk]), k = 1,2,3… The non-overlapping volumes were (5.1±3.1) cc for prostate and (4.5±2.6) cc for SV. The variations in positions was already corrected in Fig. 2, the non-overlap portions of the volume were caused mainly by the shape change. On planning CT, the prostate and SV had volume of (52.4±21.2) cc and (20.1±6.7) cc, respectively. The prostate volumes were twice that of the SV, however, the non-overlap volumes after correction were similar to SV, indicating a larger deformation in SV and a larger margin as well. During treatment course, their volumes decreased slightly to (47.6±20.5) cc and (18.4±6.3) cc. However, there are still a portion of volume outside the initial CTV after correction, indicating the existence of large daily deformation.
Figure 2.
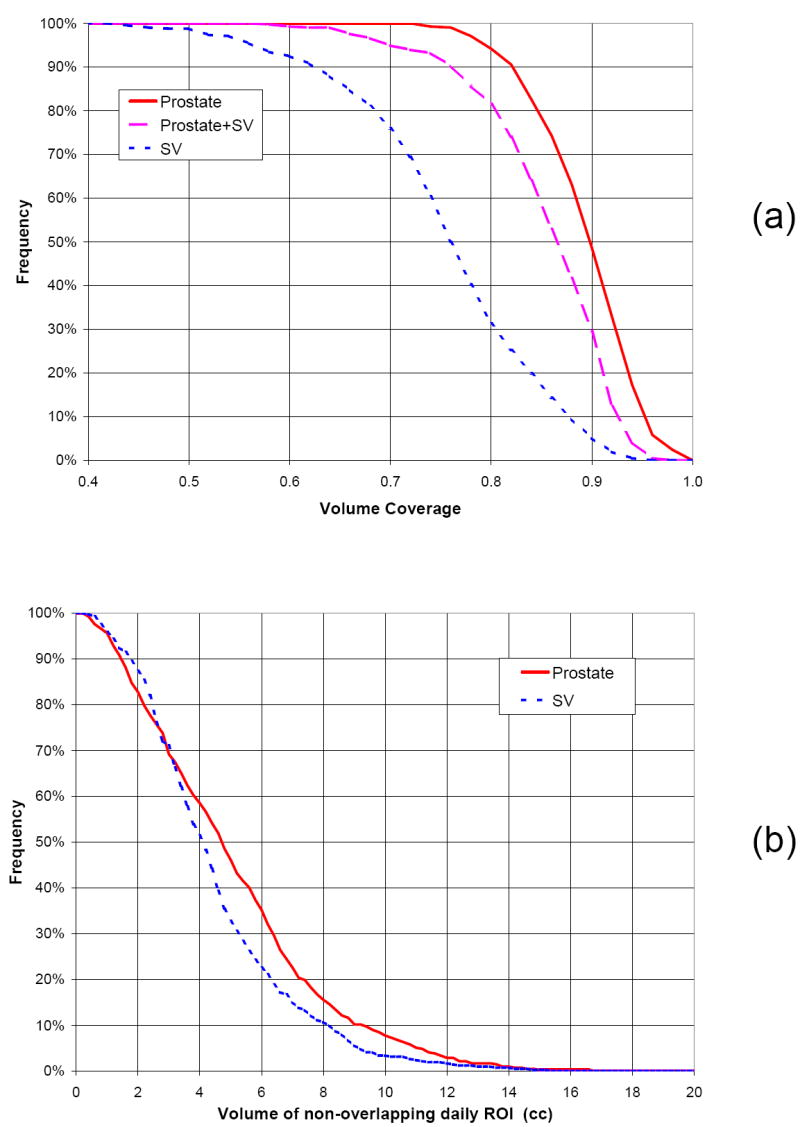
Cumulative histogram of target volume overlap index (a) and non-overlapping volume of daily CTVs (b) after perfect rigid registration.
The rigid registration results (translation only) are listed in Table 3. The magnitude of the random relative motion of SV is in the same order of prostate alone. The absolute and relative motion in AP direction was the largest, followed by the motion in SI direction. As both the AP motion for prostate and SV were driven by the motion/shape variation of bladder and rectum, they are expected to be correlated, as shown in Fig. 3. The gain (1.25) of correlation is more than 1, indicating that the magnitude of SV motion was larger than prostate. However, the relatively low value of R2 (0.7) indicated that there existed other independent factors. No correlation was found in the other directions.
Table 3.
Statistics of target motion from 24 patients with 16 CTs each. All units are in mm. Unless otherwise specified, the motion is relative to bony structures. M(μi) = mean of each patient mean; Σ(μi) = standard deviation of the mean, usually referred as the systematic component; RMS(σi) = root-mean-square of the standard deviation of each patient, commonly known as random component.
| Direction | M(μi) | Σ(μi) | RMS(σi) | |
|---|---|---|---|---|
| Prostate only | RL | -0.2 | 0.5 | 0.8 |
| PA | -1.2 | 3.6 | 2.4 | |
| IS | -0.1 | 2.4 | 2.0 | |
| Prostate + SV | RL | -0.1 | 0.6 | 0.8 |
| PA | -1.2 | 4.0 | 2.6 | |
| IS | -0.2 | 2.6 | 2.1 | |
| SV only | RL | 0.1 | 1.3 | 1.2 |
| PA | -0.1 | 5.3 | 3.8 | |
| IS | 0.1 | 2.6 | 2.6 | |
| SV relative to Prostate | RL | 0.2 | 1.1 | 1.2 |
| PA | 1.2 | 2.9 | 2.4 | |
| IS | 0.2 | 2.2 | 1.9 |
Figure 3.
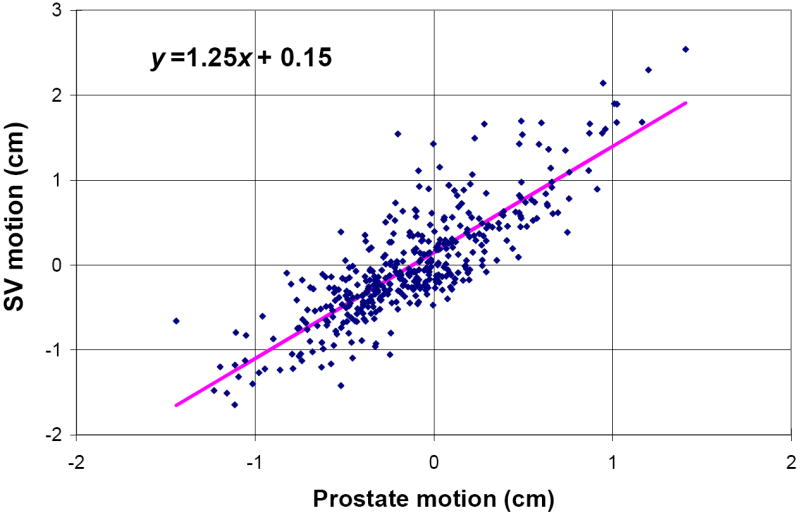
Correlations of prostate and seminal vesicle motion in posterior-anterior direction.
3.2 Geometric evaluations
Fig. 4 illustrates the relations between the margins and the absolute volume of PTV. For comparison, the data for low risk patient (CTV=prostate only), is also shown. The CTVcov(m,i) for different margins and online image guidance strategies are shown in Fig. 5. At zero and small margins, the CTVcov(m,i) for prostate only is much larger than prostate+SV. As margin increases, the difference is getting smaller. At 3mm margin, 99% of daily prostate is covered. This is why we chose 3 mm margin for prostate in Margin-B study. Although PTVs for Margin-A/C are exactly same, the CTVcov(m,i) for Margin-C is higher. This is because the whole CTV is included in the image registration/guidance in Margin-C study. At large margins (>3mm), the CTVcov(m,i) for Margin-A is larger than Margin-B because PTV expanded from prostate may cover more daily SV.
Figure 4.
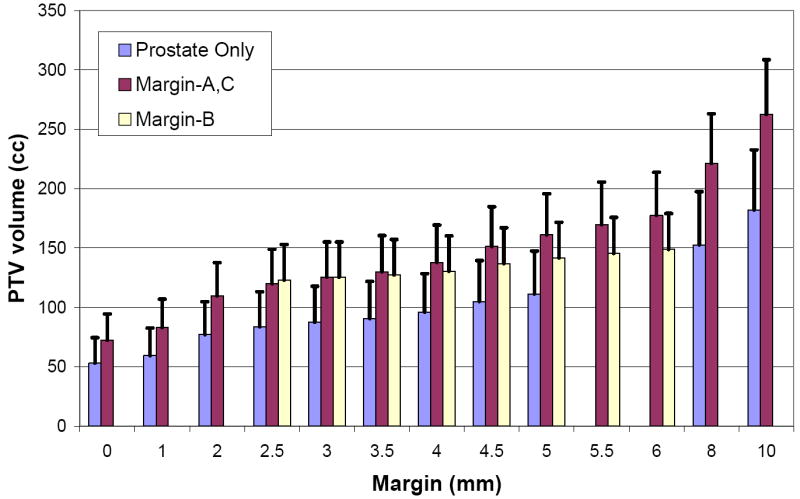
Absolute PTV volume as a function of margins. Error bars are for one standard deviation.
Figure 5.
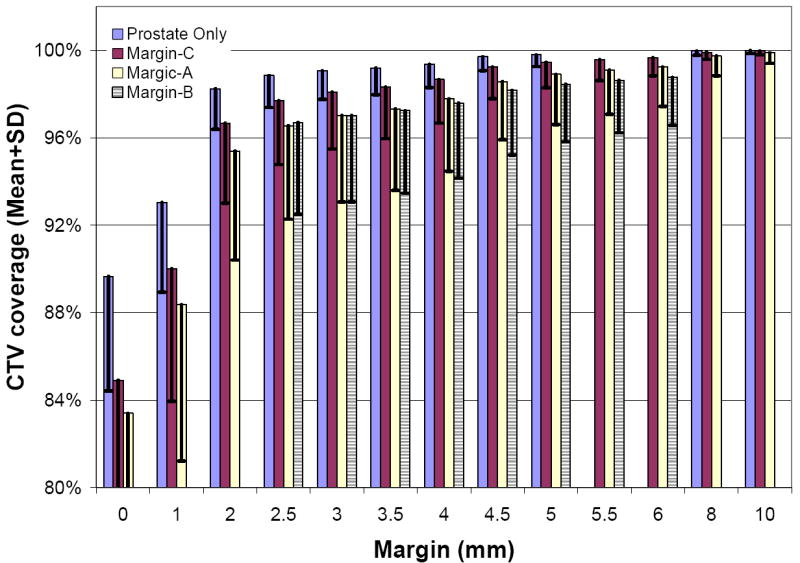
Percentage of daily CTV within initial PTV for different margins for all patients at all fractions. CTV = clinical target volume, PTV = planning target volume. Error bars are for one standard deviation.
Fig. 6 shows the frequency/probability of daily CTVs which are at least 95% covered in PTV, i.e., CTVcov(m,i) >95%. As expected, the probability sharply increases with the margin between 0 and 2.5mm, and slowly saturates at 6mm. A margin of 2.5mm will cover at least 95% of daily target at 90% confidence for Margin-C study, and 4.0mm margin is necessary for Margin-A/B. It should be noticed that these evaluation were for daily CTVs. No cumulative effect can be estimated from these geometric assessment.
Figure 6.
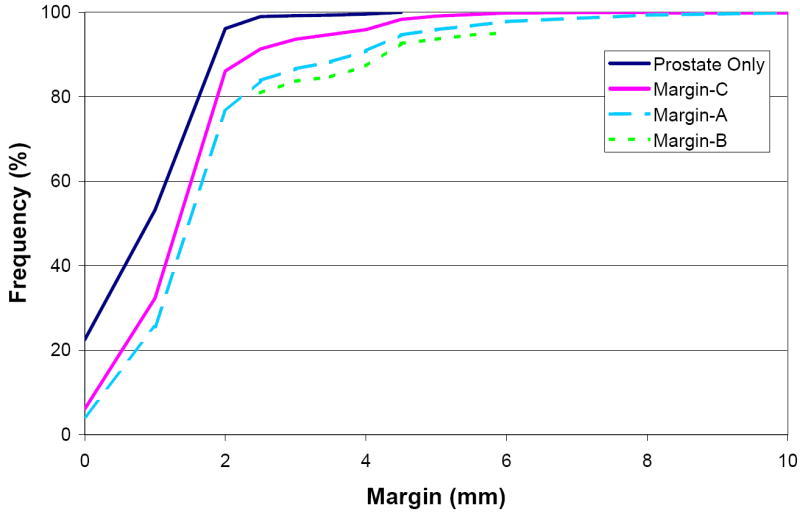
Percent of treatment fractions with at least 95% of daily CTV volume (after correction) within the PTV for different margins.
3.3 Dosimetric evalutions
In dosimetric simulations, we used margins from 2.5mm to 6mm with 0.5mm increment. The results are summarized in Table 4 for 3DCRT and Table 5 for IMRT. The dose variation is defined as
Table 4.
Dose difference (%) between initial 3DCRT plan and cumulative dose. CTV = Clinical-Target-Volume. EUD = Equivalent Uniform Dose. D99 = Dose to 99% of the volume, a representation of minimum dose. D1 = Dose to 1% of the volume, a representation of maximum dose. Dmean = mean dose. Margin types are defined in Table 2.
| Dose Index | Margin (mm) | ||||
|---|---|---|---|---|---|
| Type | 2.5 | 3.0 | 3.5 | 4.0 | |
| CTV δD99 (uncorrected) | AC | 0.3±2.4 | 0.6±1.8 | 0.6±1.9 | 0.9±1.4 |
| B | 0.5±2.0 | 0.6±1.8 | 0.6±1.9 | 0.6±1.8 | |
| CTV δD99 (corrected) | AB | 1.3±0.4 | 1.3±0.4 | 1.3±0.4 | 1.4±0.4 |
| C | 2.4±1.5 | 2.5±1.1 | 2.7±1.2 | 3.0±1.3 | |
| #cases failed | ABC | 0 | 0 | 0 | 0 |
| Bladder δEUD | A | -0.5±3.4 | -0.4±3.1 | -0.5±3.4 | -0.4±3.1 |
| B | -0.4±3.2 | -0.4±3.1 | -0.4±3.1 | -0.4±3.1 | |
| C | -0.6±3.3 | -0.4±3.0 | -0.6±3.2 | -0.4±3.0 | |
| Bladder δDmean | A | 6.6±16.8 | 6.8±16.4 | 6.5±16.8 | 6.8±16.3 |
| B | 6.9±16.5 | 6.8±16.4 | 6.8±16.4 | 6.7±16.3 | |
| C | 6.3±16.6 | 6.7±16.1 | 6.2±16.5 | 6.6±16 | |
| Rectal wall δEUD | A | -0.9±2.1 | -0.8±1.9 | -0.9±2.0 | -0.7±1.8 |
| B | -0.8±1.9 | -0.8±1.9 | -0.7±1.9 | -0.7±1.9 | |
| C | -0.8±1.9 | -0.7±1.7 | -0.8±1.9 | -0.6±1.7 | |
| Rectal wall δDmean | A | 0.6±5.3 | 1.1±4.8 | 0.6±5.3 | 1.1±4.9 |
| B | 1.0±4.8 | 1.1±4.8 | 1.1±4.9 | 1.2±4.9 | |
| C | 0.7±5.6 | 1.1±5.1 | 0.8±5.7 | 1.2±5.2 | |
Table 5.
Dose difference (%) between initial IMRT plan and the cumulative dose.
| Dose Index | Margin (mm) | ||||||||
|---|---|---|---|---|---|---|---|---|---|
| Type | 2.5 | 3.0 | 3.5 | 4.0 | 4.5 | 5.0 | 5.5 | 6.0 | |
| CTV δD99 (uncorrected) | AC | -0.9±4.1 | -0.8±4.4 | -0.5±4.2 | 0.1±4.1 | 0.9±2.9 | 1.5±3.1 | 1.6±2.8 | 1.9±2.1 |
| B | -1.0±3.8 | -0.8±4.4 | -0.5±4.2 | -0.1±3.9 | 0.1±3.8 | 0.1±3.7 | 0.0±3.8 | 0.2±3.9 | |
| CTV δD99 (corrected) | A | 2.2±1.7 | 2.2±1.5 | 2.4±1.5 | 2.7±1.6 | 3.0±0.9 | 3.5±1.2 | 3.5±1.0 | 3.3±0.9 |
| B | 2.1±1.5 | 2.3±1.5 | 2.4±1.4 | 2.6±1.3 | 2.8±1.1 | 2.9±0.8 | 2.7±0.8 | 2.7±0.8 | |
| C | 2.4±1.5 | 2.5±1.1 | 2.7±1.2 | 3.0±1.3 | 3.1±0.7 | 3.6±1.1 | 3.6±0.8 | 3.4±0.7 | |
| # of cases failed | A | 3 | 2 | 2 | 2 | 0 | 0 | 0 | 0 |
| B | 2 | 2 | 2 | 2 | 0 | 0 | 0 | 0 | |
| C | 2 | 1 | 0 | 0 | 0 | 0 | 0 | 0 | |
| Bladder δEUD | A | 0.2±3.9 | 0.1±3.9 | 0.1±3.9 | 0.1±3.8 | 0.1±3.6 | 0.1±3.6 | 0.1±3.5 | 0.1±3.6 |
| B | 0.1±3.9 | 0.1±3.9 | 0.1±3.9 | 0.1±3.8 | 0.0±3.7 | 0.0±3.6 | 0.0±3.6 | -0.1±3.6 | |
| C | 0.2±3.8 | 0.2±3.7 | 0.1±3.7 | 0.1±3.7 | 0.1±3.5 | 0.1±3.5 | 0.1±3.4 | 0.1±3.5 | |
| Bladder δDmean | A | 10.1±20.7 | 10.0±20.6 | 10.0±20.6 | 10.0±20.6 | 9.0±19.3 | 8.8±19.1 | 8.7±18.9 | 8.7±18.7 |
| B | 10.0±20.3 | 9.9±20.2 | 9.9±20.2 | 9.9±20.2 | 8.8±18.8 | 8.6±18.7 | 8.5±18.5 | 8.5±18.3 | |
| C | 10.1±20.7 | 10.0±20.6 | 10.0±20.7 | 9.9±20.5 | 9.2±19.3 | 9.1±19.2 | 8.9±19 | 8.7±18.9 | |
| Rectal wall δEUD | A | -0.5±2.1 | -0.5±2.0 | -0.5±2.0 | -0.5±1.9 | -0.4±1.8 | -0.4±1.8 | -0.4±1.9 | -0.4±1.9 |
| B | -0.5±2.0 | -0.5±2.0 | -0.5±2.0 | -0.4±2.0 | -0.4±2.0 | -0.4±2.0 | -0.3±1.9 | -0.4±2.0 | |
| C | -0.5±1.8 | -0.5±1.8 | -0.5±1.8 | -0.5±1.8 | -0.4±1.8 | -0.4±1.7 | -0.4±1.8 | -0.4±1.8 | |
| Rectal wall δDmean | A | 1.9±6.6 | 2.0±6.7 | 1.8±6.6 | 1.9±6.6 | 1.8±6.3 | 1.8±6.2 | 1.7±6.0 | 1.6±6.0 |
| B | 2.0±6.8 | 2.0±6.7 | 1.9±6.5 | 1.9±6.5 | 1.9±6.4 | 1.9±6.2 | 2.0±6.3 | 1.9±6.1 | |
| C | 1.9±7.4 | 2.0±7.5 | 1.8±7.3 | 1.9±7.4 | 1.9±7.1 | 1.8±6.9 | 1.7±6.7 | 1.6±6.7 | |
| (3) |
For target, the cumulative dose was computed for CTV, and the planning dose was for PTV. For OARs, the planning and cumulative doses were for the same organ. For comparison, the CTV dose variation without online correction for motion are also presented. After correction, dose coverage for target improved significantly. For example, using 3mm margin, the maximum of dose variation in D99 of CTV at 95% confidence level improved from -3% to 0.5% for 3DCRT and from -9.6% to -0.8% for IMRT plan. Those numbers were estimated as 2 standard deviation from the mean. The improvement was larger in IMRT due to its higher dose gradient. Conversely, the sharp dose gradient in IMRT also requires extra margin to compensate for the motion and deformation. With the predefined criteria, the minimum margins were determined as (A=B=C=2.5mm) for 3DCRT, and (A=B=4.5,C=3.0mm) for IMRT. We want to emphasize that these are the minimum margin because we assumed perfect registrations. In reality, non-perfect registration and other residuals may require additional margins.
For OARs (bladder and rectal wall), the cumulative dose varies because changes in their position and shapes were not taken into account in image guidance. During the treatment course, the beam apertures remained same but CTV volume decreased. Therefore, a larger portion of the surrounding OARs tend to move into the field and the mean dose is more likely to increase. This is especially true for bladder, the daily volume was significantly smaller than the planning volume, probably due to the extra procedure such as contrast performed in the initial CT scan, leading to the large increase in the mean dose during treatment. In general, the online correction would increase dose to the nearby OARs compared with no corrections (5), because the guidance procedure brings back the same portions of OARs into the field. This may explain very small changes in gEUD in Tables 4 and 5.
The dose variation for bladder and rectal wall were very small, regardless of margins and online correction strategy. This is because the reference doses were calculated at same margin on the initial plan. The reference doses undoubtedly would increase with the margin. Therefore their cumulative doses are largely dependent on the margins used in the planning. Fig. 7 showed the reference Dmean for rectal wall and bladder with margins. This is also confirmed by the increase of CI95 with margin in Fig. 8. We can separate the data into two groups: margins<4.5mm (actual 3mm margin in SI) and margins ≥4.5mm (actual 6mm margin in SI), the variations of CI95 within each group is small, but significantly large between these two groups. This is because of the round-off effect when PTV was created in the planning system. The CI95 is insensitive to margins for Margin-B study because the varying margin was only applied to SV with smaller volume.
Figure 7.
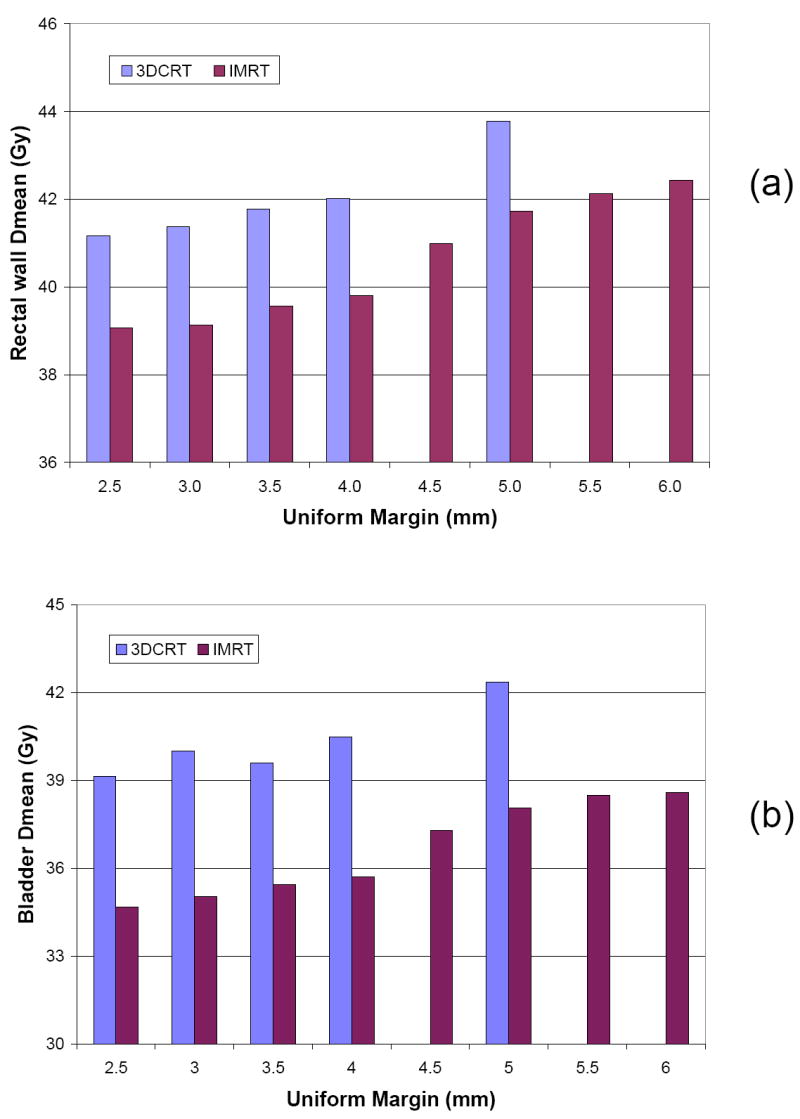
The average of Dmean of rectal wall (a) and bladder (b) for 3DCRT and IMRT plans for different margin.
Figure 8.
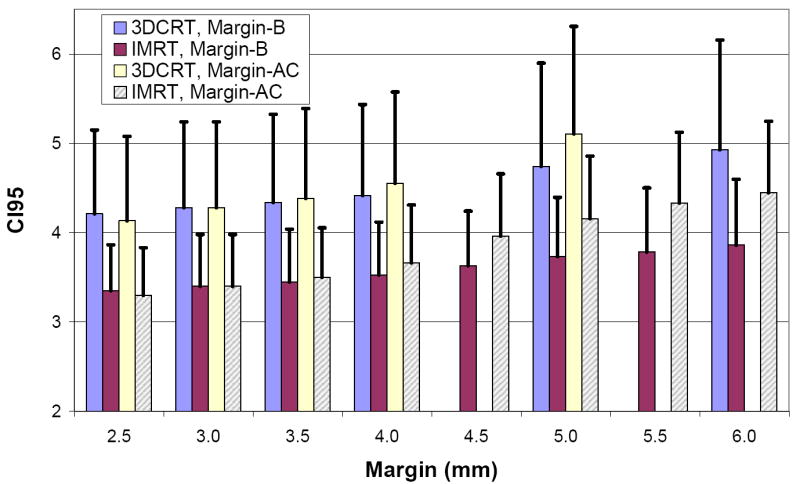
The conformity index CI95 for different margins.
4. Discussion
In this study we measured and corrected the daily organ motion by maximizing its volume overlap with the reference. Because deformations exist in organs and the radiation therapy is 3D in nature, this method should be more accurate than techniques relying on a few control points. Our method requires the contours to be drawn on the daily CT. The advantage is that it is not sensitive to the low contrast of CT images in the pelvic regions. The drawback is that labor-intensive contouring is still required (if no fiducial marker were implanted) for the evaluation and the CTV delineations errors are not included. Therefore, the recommended margins for different guidance strategies and delivery modalities shown in Table 6 are the minimum value.
Table 6.
Recommended planning CTV to PTV margin (mm) for 3DCRT and IMRT. The criteria is D99 of CTV to be more than the plan at 95% confidence level.
| Margin Design | Online Image Guidance Method | 3DCRT (mm) | IMRT (mm) |
|---|---|---|---|
| A | Prostate Only | 2.5 | 4.5 |
| B | Prostate Only | 2.5 | 4.5 |
| C | Prostate + SV | 2.5 | 3.0 |
The accuracy of rigid organ motion is also dependent on the image registration method used. The normalized cross correlation method was adopted because it has been shown to be a powerful and efficient technique for image registration within the same image modality (15). The COM method was chosen for comparison because of its simplicity. The results from COM was surprisingly very close, probably due to the fact that we did not attempt to correct the rotations, for which the COM is unable to do.
The separate margin design (Margin-B) yields the smallest PTV, compared with uniform margins (Margin-A and C) as shown in Fig. 4. As the margin increases, the PTV volume increase is not as fast as when uniform margins are applied to the whole CTV. For example, if the margin was increased from 3.0mm to 6.0mm, the average PTV volume increases by 70%. With Margin-B, the increase was 36%. The advantage of Margin-B is more pronounced with a larger margin.
We included both IMRT and 3DCRT, the two commonly used modalities for external beam radiation therapy for prostate cancer, in our study. The IMRT plan is more conformal than 3DCRT with a higher dose gradient around the PTV and a lower dose to the surrounding OARs. However, the resulting IMRT dose distribution is also more sensitive to the inter-fraction motion and therefore requires a larger margin. To evaluate the efficacy of IMRT plans with 3DCRT plans, we further computed the ratio of CI95 (IMRT over 3DCRT) at their recommended margins respectively in Fig. 9. For example, for Margin-A study, the ratio was computed as CI95 of IMRT at margin=4.5mm divided by CI95 of 3DCRT at margin=2.5mm for each patient. Even though the margins for IMRT plans is larger, the ratios are smaller than 1.0 except for Margin-A, which is primarily caused by the round-up effect of PTV volume. This means that the irradiated volumes for IMRT are smaller than 3DCRT at recommended margins. Similarly, we compared the doses for rectal wall and bladder between IMRT and 3DCRT in Fig. 10. The bladder received less dose in IMRT plans for all margin designs, and rectal wall displayed similar pattern as in target coverage. This can be explained by their relative positions to the CTV. The round-up effect of PTV does not affect bladder which is located anterior-superior of the CTV as much as rectum, which is along the CTV. The ratio of D1 and gEUD (not shown) are close to 1 because they depend on the maximum dose.
Figure 9.
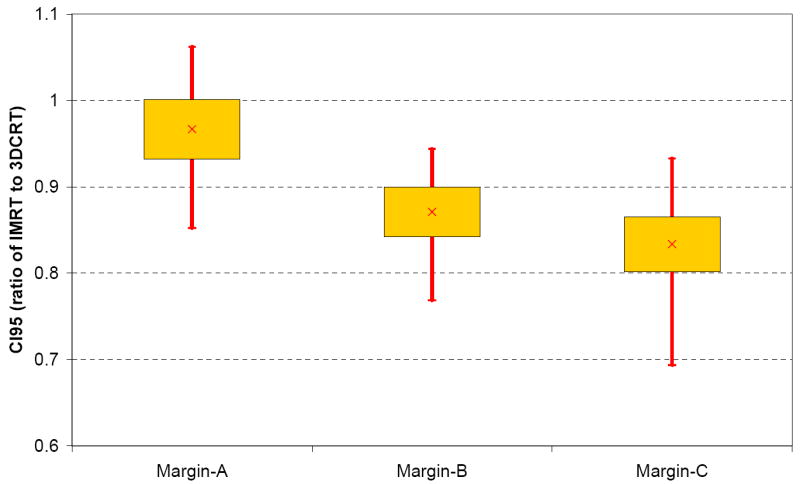
Ratio of CI95 between IMRT and 3DCRT for different margin studies. The box plots show the mean, standard deviation, minimum and maximum. The margin values used for each type are the recommended minimum value, shown in Table 6.
Figure 10.
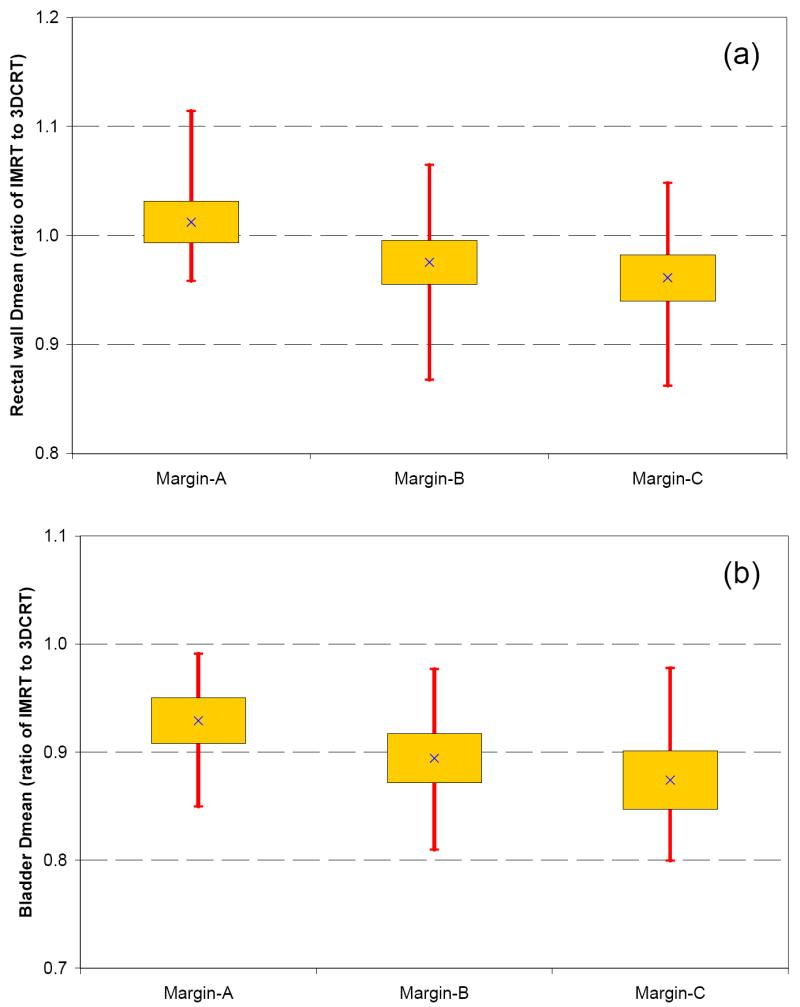
Ratio of Dmean between IMRT and 3DCRT for different margins. (a) Rectal wall, (b) Bladder. The box plots show the mean, standard deviation, minimum and maximum. The margin values used for each type are the recommended minimum value, shown in Table 6.
In summary, we evaluated the daily prostate and seminal vesicles motion and deformation using binary image mask based registration algorithm. We further evaluated two online image guidance strategies and three margin designs for both 3DCRT and IMRT plans, all of them are applicable to current clinical practice. While the cause for motion is the same, SV can move independently from prostate and its motion magnitude is larger. A larger margin is required for these groups of patients than low risk group. Although margins in IMRT plan are larger than 3DCRT, the irradiated volume are smaller and doses to critical structures are lower. At 95% confidence level, the minimum margin for 3DCRT is 2.5 mm. For IMRT, the minimum margin is 4.5 mm if guidance is based on prostate only, whether it is uniform or non-uniform. For this type of online guidance, the non-uniform margins (4.5 mm to SV and 3 mm to prostate) is recommended because it creates smaller PTV. If the daily guidance is based on the combination of prostate and SV, then margin can be reduced to 3.0 mm.
Acknowledgments
This research is supported in part by Grants CA118037 and CA091020 from the National Cancer Institute. The contents are solely the responsibility of the authors and do not necessarily represent the official view of NCI.
Footnotes
Conflict of Interest: None.
Portions of the studies were presented at the 49th AAPM annual meeting, Jul., 2007, Minneapolis, Minnesota.
Publisher's Disclaimer: This is a PDF file of an unedited manuscript that has been accepted for publication. As a service to our customers we are providing this early version of the manuscript. The manuscript will undergo copyediting, typesetting, and review of the resulting proof before it is published in its final citable form. Please note that during the production process errors may be discovered which could affect the content, and all legal disclaimers that apply to the journal pertain.
References
- 1.Kestin L, Goldstein N, Vicini F, et al. Treatment of prostate cancer with radiotherapy: should the entire seminal vesicles be included in the clinical target volume? Int J Radiat Oncol Biol Phys. 2002;54:686–697. doi: 10.1016/s0360-3016(02)03011-0. [DOI] [PubMed] [Google Scholar]
- 2.Nakamura RA, Monti CR, Ferrigno R, et al. Improvement of Disease Control With Seminal Vesicles Irradiation in Intermediate and High-Risk Patients With Prostate Cancer. Int J Radiat Oncol Biol Phys. 2006;66:S376. [Google Scholar]
- 3.Roeske JC, Forman JD, Mesina CF, et al. Evaluation of changes in the size and location of the prostate, seminal vesicles, bladder, and rectum during a course of external beam radiation therapy. Int J Radiat Oncol Biol Phys. 1995;33:1321–1329. doi: 10.1016/0360-3016(95)00225-1. [DOI] [PubMed] [Google Scholar]
- 4.Deurloo KE, Steenbakkers RJ, Zijp LJ, et al. Quantification of shape variation of prostate and seminal vesicles during external beam radiotherapy. Int J Radiat Oncol Biol Phys. 2005;61:228–238. doi: 10.1016/j.ijrobp.2004.09.023. [DOI] [PubMed] [Google Scholar]
- 5.Wu Q, Ivaldi G, Liang J, et al. Geometric and dosimetric evaluations of an online image-guidance strategy for 3D-CRT of prostate cancer. Int J Radiat Oncol Biol Phys. 2006;64:1596–1609. doi: 10.1016/j.ijrobp.2005.12.029. [DOI] [PubMed] [Google Scholar]
- 6.O’Daniel JC, Dong L, Zhang L, et al. Dosimetric comparison of four target alignment methods for prostate cancer radiotherapy. Int J Radiat Oncol Biol Phys. 2006;66:883–891. doi: 10.1016/j.ijrobp.2006.06.044. [DOI] [PubMed] [Google Scholar]
- 7.Smitsmans MH, de Bois J, Sonke JJ, et al. Automatic prostate localization on cone-beam CT scans for high precision image-guided radiotherapy. Int J Radiat Oncol Biol Phys. 2005;63:975–984. doi: 10.1016/j.ijrobp.2005.07.973. [DOI] [PubMed] [Google Scholar]
- 8.Beltran C, Herman MG, Davis BJ. Planning target margin calculations for prostate radiotherapy based on intrafraction and interfraction motion using four localization methods. Int J Radiat Oncol Biol Phys. 2008;70:289–295. doi: 10.1016/j.ijrobp.2007.08.040. [DOI] [PubMed] [Google Scholar]
- 9.Ghilezan M, Yan D, Liang J, et al. Online image-guided intensity-modulated radiotherapy for prostate cancer: How much improvement can we expect? A theoretical assessment of clinical benefits and potential dose escalation by improving precision and accuracy of radiation delivery. Int J Radiat Oncol Biol Phys. 2004;60:1602–1610. doi: 10.1016/j.ijrobp.2004.07.709. [DOI] [PubMed] [Google Scholar]
- 10.Mohan R, Zhang X, Wang H, et al. Use of deformed intensity distributions for on-line modification of image-guided IMRT to account for interfractional anatomic changes. Int J Radiat Oncol Biol Phys. 2005;61:1258–1266. doi: 10.1016/j.ijrobp.2004.11.033. [DOI] [PubMed] [Google Scholar]
- 11.Yan D, Jaffray DA, Wong JW. A model to accumulate fractionated dose in a deforming organ. Int J Radiat Oncol Biol Phys. 1999;44:665–675. doi: 10.1016/s0360-3016(99)00007-3. [DOI] [PubMed] [Google Scholar]
- 12.Lbanez L, Schroeder W, NG L, et al. The ITK Software Guide. 2005 http://www.itk.org.
- 13.Smitsmans MH, Wolthaus JW, Artignan X, et al. Automatic localization of the prostate for on-line or off-line image-guided radiotherapy. Int J Radiat Oncol Biol Phys. 2004;60:623–635. doi: 10.1016/j.ijrobp.2004.05.027. [DOI] [PubMed] [Google Scholar]
- 14.Wu Q, Mohan R, Niemierko A, et al. Optimization of intensity-modulated radiotherapy plans based on the equivalent uniform dose. Int J Radiat Oncol Biol Phys. 2002;52:224–235. doi: 10.1016/s0360-3016(01)02585-8. [DOI] [PubMed] [Google Scholar]
- 15.Meyer J. Histogram Transformation for Inter-Modality Image Registration. IEEE 7th International Symposium on BioInformatics and BioEngineering (IEEE BIBE 2007); Cambridge-Boston, Massachusetts, USA. 2007. pp. 1118–1123. [Google Scholar]