

Abstract
Water located outside the NMR detection coil experiences a reduced RF field intensity. This “faraway water” is known to be very difficult to suppress and often gives rise to a large residual solvent signal. Pre-SAT180 (Pre-Saturation with Adiabatic Toggling of 180 degree pulse inversion) is proposed to cancel the residual water contribution efficiently. Compared with several popular methods such as 1D NOESY with pre-saturation or 270° excitation, Pre-SAT180 has a number of advantages, including: full retention of signal intensity and selectivity, good phase properties, easy set up, and high tolerance to pulse missettings.
Keywords: Pre-SAT180, NMR, water suppression, pre-saturation, metabolomics, urine metabolomics
Introduction
Solvent suppression is of great interest in proton detected high resolution nuclear magnetic resonance spectroscopy of aqueous samples. Popular 1D solvent suppression techniques include gradient-based methods such as WATERGATE [1, 2] and its many variants, weak RF irradiation (pre-saturation, or pre-sat [3]), and combinations of gradient and weak RF pulse such as WET [4] or its variants. In addition, there are 2D or nD oriented methods relying on one or more of the following: isotope filtering (such as HMQC), gradient coherence selection [5], and spin-lock [6] or flip-back [7] pulses. Many of these methods provide excellent suppression under a variety of conditions.
One of the main goals for water suppression is to allow full utilization of receiver dynamic range, which enables the maximal sensitivity for the dilute solute. While WATERGATE and WET type methods frequently suppress the water signal by a thousand fold or more, pre-sat [8] is still widely used due to its simplicity and robustness. Pre-sat remains the preferred method of water suppression in certain cases, especially for small molecule samples where the main disadvantage of saturation transfer associated with pre-sat is minimal.
In a finely tuned system, i.e., a well-shimmed sample and a probe with good B1 homogeneity, water suppression using pre-sat can achieve results comparable to WATERGATE or WET-based methods. In automated operations or when a large number of samples must be analyzed, or when moderate quality NMR tubes are used, excellent shimming may not be always achieved. All three of the above mentioned solvent suppression methods suffer under such non-ideal circumstances. Pre-sat especially is prone to significant residual signals which are contributed by solvent located at the outer edge of the RF coil. Water in this region can be called “faraway water” as it is located some distance from the RF coil center. This term can be extended to include all regions with reduced B1 field (while here we term bulk solvent as the solvent experiencing almost uniform and un-attenuated B1 field, located in the center of the probe). The fraction of the sample that can be considered faraway water is by no means small in a regular NMR tube [9], though its contribution to the FID is negligible compared to the fully unsuppressed water signal. With poor water suppression, faraway water can easily dominate interesting solute signals. Insufficient shimming may further cause a significant offset for faraway water. A large residual solvent signal will arise if the RF field in a pre-sat sequence (typically 10 – 100 Hz) is weaker than or is comparable to the offset experienced by faraway water. A modest RF inhomogeneity, especially in the reduced B1 field region away from the coil center, further limits the faraway water’s “saturability” [10]. In addition, radiation damping, which tends to be much more severe at higher field and when using cryoprobes, may severely broaden the solvent peak and make identification of poorly shimmed water very difficult. Thus, a large residual water signal is one of the main problems frequently observed when a pre-sat sequence is used. The residual water may have a deleterious impact on the resonances around the solvent signal not only by overwhelming them in sheer intensity but also by contributing a non-flat baseline, and in some severe cases, phase or baseline distortion.
WATERGATE-type sequences (including original WATERGATE with shaped pulse [1, 2], or its W3, W4 and W5 variants [11], excitation sculpting [12], MEGA [13] and a recent version of SOGGY [14]) actively select signals that follow the desired coherence transfer pathway, thus they are generally very efficient in suppressing faraway water. However, the consequence of coherence selection in the transverse plane is the influence of homonulcear scalar coupling evolution on the appearance of the multiplet patterns, which limits the shaped pulse selectivity in WATERGATE-type sequences. T2 relaxation and potential diffusion between gradient pulses may take further tolls in signal intensity. It is therefore preferred to have a method that keeps interesting magnetization along the z-axis while the solvent is suppressed. Other than pre-sat, WET-type sequences meet this need.
Though WET was originally designed to be B1 insensitive, the severely reduced B1 field in the faraway water region is not fully compensated and thus still creates a significant residual solvent signal for high resolution and high quality NMR. To address this issue, a composite observe pulse [15] and WET270 [16] have been suggested. In the first approach, the faraway water is suppressed by a composite observe pulse designed to suppress small angle excitation [17]. However, this method suffers from phase distortion, as well as asymmetrical suppression of off-resonance peaks [16, 17]. In WET270, the faraway water is assumed to be a linear system (i.e. a signal intensity that is proportional to excitation angle), thus a 270° excitation would generate a residual water signal three times larger than the normal 90° detection pulse. While residual water is suppressed, WET270 has several problems. First, phase corrections for 90 and 270° excitation slightly differ, due to the finite pulse length off-resonance effect (vide infra). Second, the power level or the pulse length of the WET soft pulses needs to be fine-tuned for best suppression in each individual sample, which hinders full automation. In practice, even for the same sample, a slightly different power level (or pulse length) for the selective pulses is required for the 90 and 270° observe pulses. Third, the larger residual signal generated by the 270° excitation may limit receiver gain and thus dynamic range. Fourth, in a system with a larger RF B1 inhomogeneity (especially when using a cryoprobe), the assumed linear response for the faraway water signal may not hold well: a 270° excitation pulse may create residual signals that are less than three times that of a 90° excitation, yielding incomplete cancellation. In addition, in a system with significant B1 inhomogeneity and faraway water, the actual 90° pulse length is frequently subject to the user’s judgment in practice: e.g. a nominal 360° pulse that generates a null signal can be quite a bit more than 360° for the bulk solvent [9].
Here we propose that faraway water be canceled using a new pulse sequence that we name Pre-SAT180 (Pre-Saturation with Adiabatic Toggling of 180 degree pulse inversion). The sequence is shown in Fig. 1A. Given the fact that the faraway region experiences a significantly attenuated B1 field, our approach focuses on solute signals that are of interest and can be manipulated. As shown in Figure 1B, the pre-sat pulse saturates the bulk water signal, leaving the faraway water and solute magnetizations intact. The 180° adiabatic pulse then inverts the solute magnetization from +z to −z axis, while the faraway water region is minimally affected and largely remains along +z. The observe pulse creates a faraway water signal with the same phase as the solute magnetization of interest (top half of Figure 1B). When the adiabatic inversion pulse is turned off, the solute magnetization has the opposite phase. Toggling the adiabatic pulse sequentially on and off, and taking the difference between these two conditions allows the solute signals from the bulk region to add up while the residual signal from faraway water is canceled. The bulk water signal is largely attenuated by the pre-sat pulse. This approach does not require a linear response to the observe pulse for the residual water. Instead, it performs best when B1 is quickly reduced to a minimal value (no inversion by the adiabatic pulse) for the faraway water. The advantage of such a sequence includes simple set-up, better sensitivity, excellent phase properties for all peaks across the spectrum, and high tolerance to B1 RF homogeneity and pulse calibration.
Figure 1.
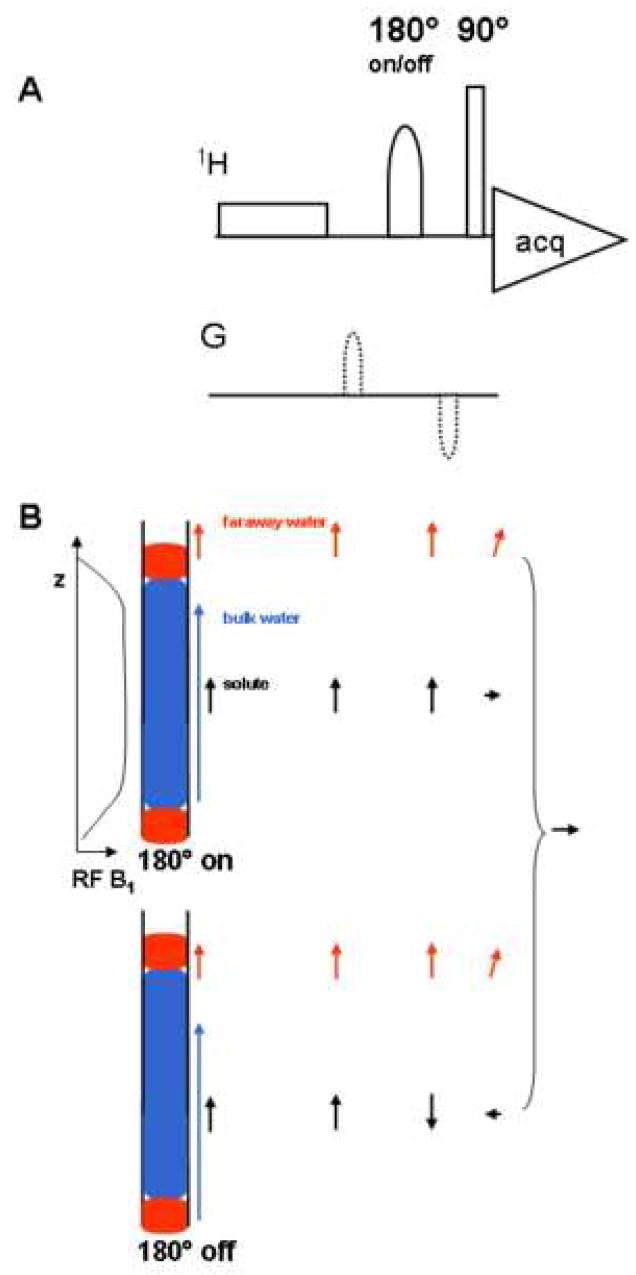
(A) Pre-SAT180 pulse sequence, in which a 180° adiabatic inversion pulse (500 μs duration, smoothed CHIRP shape; 8.1 kHz B1 field peak power) is toggled on and off (with receiver phase changed 180°) to cancel the faraway water contribution. The adiabatic pulse is optionally flanked by two weak gradients (500 μs, 2.5 Gauss/cm) of opposite signs before the 90° observe pulse. (B) A schematic diagram shows the faraway water region (corresponding to the rapidly diminishing RF B1 field) and how its suppression is achieved. Arrows after each pulse indicate the contribution to the transverse magnetization from the different portions of the sample, including bulk solvent, faraway water and the solute. Top and bottom portions of the figure indicate inversion pulse on or off conditions. Receiver phase shifting creates the difference spectrum with improved solvent suppression.
Results and Discussion
Fig. 2 compares the results of Pre-SAT180 with several popular methods which keep interesting magnetizations on along the z axis during solvent suppression: 1D pre-sat, 1D pre-sat NOESY, WET and WET270. Using a concept similar to WET270, pre-sat270 may suppress faraway water efficiently and was thus included as well. Pre-SAT180 provides very clean water suppression, as evidenced by a reduction of the residual water signal by a factor of ten in intensity and two in line-width (at half height), as compared with 1D pre-sat. The reduction in the residual water intensity is to be expected since it is further suppressed by toggling the adiabatic inversion pulses. The residual water line-width improves because the “shoulders” of the water signal are largely contributed by faraway water, which are more efficiently canceled in Pre-SAT180. The phase or baseline distortion around the water region of the spectrum remains small. In fact, peaks only 0.2 ppm away from the water signal such as those from sugars and amino acids can be easily analyzed. Because of the improved water suppression, quite a number of peaks near water can be readily identified, which may not be possible when using a normal 1D pre-sat method alone.
Figure 2.

Several popular 1D water suppression methods (as labeled) are compared using the same urine sample. The RF field strength of 90 Hz is the same for all pre-saturation or selective pulses in WET. Pre-SAT180, pre-sat270 and pre-sat NOESY achieve better overall residual water suppression (in intensity and line-width). WET and WET270 have high residual water intensity but the line width is narrower than that achieved using pre-sat only.
Pre-SAT180 also shows clean phase corrections. Contrary to suggestions that the 270° excitation in WET270 can be phase-cycled along with 90° excitation pulses [16], we found those excitations need to be acquired and processed separately in practice, after realizing that they required significantly different phase corrections due to finite pulse length (or limited RF field). In our case, a 15.5 μs 90° pulse creates an 8° phase shift for peaks with an offset of 2500 Hz, which translates to an 8 degree first-order phase correction. On the other hand, the 270° excitation would require a −8 degree first-order phase correction. The phase shift difference as much as 16 degrees between two excitation angles can create line-shape distortions if the FID’s are summed for those scans without phase correction consideration. While phase distortion of this size may not be so apparent for peaks in the center of the spectrum or for broad peaks in proteins, it can be easily observed for peaks with larger offsets and/or for small molecules (with sharp peaks) such as TSP. On the other hand, Pre-SAT180 does not suffer from this problem, since the magnetization of interest is aligned along z axis and the same observe pulse is used for all acquisitions. As such, Pre-SAT180 is clearly superior to WET270 and pre-sat270 in that all scans can be accumulated in one FID, and can be phased as a single pulse acquisition.
More importantly, Pre-SAT180 retains full signal intensity: there is no apparent solute signal loss for Pre-SAT180 compared to the use of pre-sat alone. Using the TSP peak as an example, Fig 3 shows that Pre-SAT180 and pre-sat intensities are within 1% of each other. While both can deliver excellent residual water suppression, pre-sat270 and pre-sat NOESY suffer from some solute signal loss. For pre-sat270, most solute peaks experience 2% to 3% reduction in intensity. This is in agreement with the 1H RF inhomogeneity we measured for amplitude ratios A810/A90 of ~0.7, A270/A90 of ~0.9 and A180/A0 of 0.96. In pre-sat270, a 270° excitation takes place every four scans, leading to a signal loss of about 3%. For similar reasons, WET270 is also expected to lose a similar amount. Since the observe pulse in NOESY is preceded by the equivalent of a 180° pulse for half of the scans, the RF inhomogeneity loss would be about 2% (half of 1- A180/A0).
Figure 3.

TSP peak intensities are highest in pre-sat and Pre-SAT180 (within 1% of each other). Compared with Pre-SAT180, the observed TSP intensity loss was 2% for pre-sat270, and 7% (zero mixing time) or 18% (300 ms mixing time) for pre-sat NOESY.
1D pre-sat NOESY would experience some signal losses due to longitudinal relaxation and the off-resonance effect of finite pulse lengths. In our sample, most observable metabolites have T1’s between 1 s to 3 s [18], thus a 300 ms mixing time would lead to 10% to 26% intensity losses, compared with Pre-SAT180 or pre-sat. For the TSP signal, the observed loss ranges from 7% (zero mixing time) to 18% (300 ms mixing time). The second source of signal loss in 1D pre-sat NOESY is the finite pulse length and delay between pulses. In a simple first order approximation, the chemical shift evolution time during a 90°−delay−90° block is 4τ90/π + delay, and the magnetization with an offset of ω is selected by the first two pulses in NOESY with the efficiency of cos((ω *(2τ90/π+delay)). For a large offset (such as the 2400 Hz offset for TSP observed at 500 MHz), and a limited RF field strength in salty samples, significant signal loss is expected. Fig. 4A shows a simulation of the z-magnetization recovery efficiency for the 90x-delay-90x and 90x-delay-90−x sequence blocks. The simulation gives a signal loss of 6% due to this effect for an offset of 2400 Hz under our experimental conditions of τ90 = 15.5 μs and delay = 4 μs. In any one-pulse-observe experiment, the off-resonance effect may make excitation less efficient (a 90° pulse is not exact for all resonances). However, we do not believe that alone contributes in any significant fashion in NOESY observe pulse (<1%). Thus, if we consider off-resonance effect (6% loss) and RF inhomogeneity (2% loss), we would expect a total signal loss of up to 8% for TSP, which agrees reasonably well with our observed 7% in 1D pre-sat NOESY with zero mixing time (Fig 3). Since the pre-sat NOESY method (with some non-zero mixing times) is used for metabolite quantification in aqueous solutions [19], it would be very beneficial to make corrections for offset-dependent signal loss, and reduce the impact of relaxation rate differences on the signal intensities.
Figure 4.

Simulation of the inversion or recovery efficiency (of the z magnetization) by the first two 90° pulses in the NOESY or the adiabatic 180° pulse in Pre-SAT180 resulting from off-resonance effects. Solid line indicates the results for 90x-delay-90x and 90x-delay-90−x in NOESY (B1=16.1 kHz; delay = 4 μs). Dotted line indicates the results for an adiabatic 180° pulse (parameters are described in Fig. 1 with B1 peak power of 8.1 kHz). Simulated on-resonance z magnetization after the adiabatic pulse used in the paper, shown as a function of RF strength.
In contrast, Pre-SAT180 is minimally affected by an imperfect 180° adiabatic inversion pulse. First, the 180° pulse only occurs half of the time. Second, the adiabatic 180° in the Pre-SAT180 is approximately 99% efficient for inversion over the whole frequency range of interest (Fig. 4B). Thus, the Pre-SAT180 intensity loss is roughly 0.5%, and this loss is not significantly dependent on offset. In fact, the signal intensity loss is reduced at larger offsets since off-resonance magnetizations satisfy the adiabatic conditions better than those in the on-resonance region. A higher power adiabatic pulse would lead to even smaller solute signal losses. We chose to use only moderate RF power, as high power would invert more residual water and thus reduce the advantages of using Pre-SAT180.
Based on the consideration of easy set-up, tolerance to pulse missettings and favorable off-resonance effects, we chose to use an adiabatic 180° pulse rather than a simple 180° square pulse for inversion in Pre-SAT180. Moreover, there is no risk of “over-nutation” in using an adiabatic 180° pulse, compared with a simple square pulse. A composite pulse could be used to replace the adiabatic pulse in Pre-SAT180, but we have not investigated the performance of this approach. However, it should be noted that some “simpler” composite 180° pulses such as 90x270y90x or 90x270y90x may either have similar intensity losses due to off-resonance effects as a 180° square pulse, or have less tolerance to pulse missettings. More elaborate composite 180° pulses may compensate for both effect. However, this approach is somewhat contrary to the simple one taken here for improved residual water suppression.
We also investigated the use of a frequency swept pulse for pre-sat, with the reasoning that faraway water may have quite different offsets from the bulk. However, this approach does not offer clear advantage over constant frequency (normal pre-sat), as shown in Figure 2. In retrospect, we are not surprised, since faraway water frequently may have an offset (as shown as in residual water line-width) much larger than the 25 Hz sweep amplitude used in this study. While increasing the sweep amplitude may suppress outer edges of the residual water better, it will come at a price of less efficient suppression of the main water peak and compromise the pre-sat selectivity, which is the one main advantage pre-sat has over other water suppression sequences (WATERGATE or WET). Therefore, no further attempt was made to optimize the frequency-sweep for pre-sat.
Conclusions
Pre-SAT180 offers a clear advantage over pre-sat alone method in its ability to significantly suppress the faraway water signal intensity and line-width, while keeping full selectivity and full sensitivity that pre-sat offers. We have not noticed any downside of using Pre-SAT180 compared with pre-sat alone, thus we suggest that Pre-SAT180 should replace pre-sat when residual solvent signal needs to be suppressed.
Compared to several other pre-sat based methods, Pre-SAT180 enjoys additional benefits of tolerance to B1 field missettings and/or variation, very modest requirements for gradients and easy setup. Only 1D pre-sat NOESY using a long mixing time may give slightly better residual water suppression, but it suffers readily from 8% or more signal loss due to the off-resonance effect, T1 relaxation and RF inhomogeneity. Pre-SAT180 also provides a preferred method for quantification in aqueous samples.
Pre-SAT180 is rather simple, and thus potentially offers higher stability and predictability for cancellation of large residual water signals, compared with other multi-pulse cancellation sequences (e.g. NOESY or WET270). Pre-SAT180 sequence can be readily prefixed to any multidimensional sequence when needed, similar to the way in which the WATEGATE-type block is applied prior to detection in a multidimensional sequence. As a difference method, it only requires additional receiver phase cycling of 180 degrees along with a toggled 180° adiabatic inversion pulse.
Experimental
For all NMR experiments, a human urine sample (with 10% D2O and final concentration of 0.004% TSP added) was chosen because it contains many resonances near the water signal and because of its biological relevance. To reduce the dependence of spectral quality on the operator and to mimic a high-throughput setting, a gradient shimming routine was applied twice after a pre-defined generic (or system default) shim file was loaded. The gradient shim proved capable of giving reasonably good line shape, and allowed sufficient receiver gains to maintain good solute sensitivity. The following series of experiments were performed for comparison: pre-sat, pre-sat with a sine frequency sweep (25 Hz amplitude and 25 Hz sweep rate), Pre-SAT180, pre-sat270 (pre-sat with three scans of 90° excitation and one scan of 270°), 1d pre-sat NOESY (mixing times: 0, 100ms, 200ms or 300ms), WET with composite observe pulse and WET270. All data were acquired on a Bruker Avance DRX500 equipped with an inverse room temperature triple axis gradient probe operating at 25 °C. Inter-scan delay/pre-sat time was 2s, and the acquisition time was 2.98 s (sweep width 11 ppm). The proton hard 90° pulse width is 15.5 μs (16.1 kHz) and the pre-sat or WET selective pulse B1 field strength was chosen to be 90 Hz. The 180° adiabatic inversion pulse in pre-SAT180 was 500 μs, shaped as a 20% smoothed CHIRP using a sweep width of 60 kHz at a peak power of 8.1 kHz.
Prior to Fourier transformation, all FIDs were zero-filled to 16k complex points and exponentially line-broadened by 0.3 Hz. A small first order baseline correction was applied when needed. For pre-sat270 and WET270, 16 FIDs using 90° and 270° observe pulses were acquired and processed separately before summation (the 270° observation was weighed by 1/3, and the sum was multiplied by 0.75 for intensity comparisons). In addition, shaped pulse (one lobed SINC) power was adjusted slightly for the WET270 to achieve best water suppression.
Probe RF B1 inhomogeneity was estimated by measuring the following ratios: A810/A90, A270/A90 and A180/A0 (A180/A90 is the absolute ratio of z magnetization after a 180° inversion pulse and that after a 0° excitation) in a doped D2O sample.
Pulse simulations were conducted using the NMR-Sim Bloch module (Bruker Bio-spin, Billerica, MA).
Supplementary Material
Supplementary Figure Simulated on-resonance z magnetization after the adiabatic pulse used in the paper, shown as a function of RF strength.
Acknowledgments
The authors thank Drs. Narasimhamurthy Shanaiah and Naganagowda Gowda for assistance and Dr. John Harwood for critical reading and comments on the manuscript. Partial support from the National Institutes of Health, (NIH/NIDDK 3 R21 DK070290-01) is gratefully acknowledged.
Footnotes
Publisher's Disclaimer: This is a PDF file of an unedited manuscript that has been accepted for publication. As a service to our customers we are providing this early version of the manuscript. The manuscript will undergo copyediting, typesetting, and review of the resulting proof before it is published in its final citable form. Please note that during the production process errors may be discovered which could affect the content, and all legal disclaimers that apply to the journal pertain.
References
- 1.Piotto M, Saudek V, Sklenar V. Gradient-Tailored Excitation for Single-Quantum NMR Spectroscopy of Aqueous Solutions. J Biomol NMR. 1992;2:661–665. doi: 10.1007/BF02192855. [DOI] [PubMed] [Google Scholar]
- 2.Sklenar V, Piotto M, Leppik R, Saudek V. Gradient-Tailored Water Suppression for 1H-15N HSQC Experiments Optimized to Retain Full Sensitivity. J Magn Reson A. 1993;102:241–245. [Google Scholar]
- 3.Hoult DI. Solvent Peak Saturation with Single-Phase and Quadrature Fourier Transformation. J Magn Reson. 1976;21:337–347. [Google Scholar]
- 4.Ogg RJ, Kingsley PB, Taylor JS. WET, a T1- and B1-Insensitive Water-Suppression Method for in Vivo Localized 1H NMR Spectroscopy. J Magn Reson B. 1994;104:1–10. doi: 10.1006/jmrb.1994.1048. [DOI] [PubMed] [Google Scholar]
- 5.For a review, see Keeler J, Clowes RT, Davis AL, Laue ED. Pulsed-field Gradients: Theory and Practice. Methods Enzymol. 1994;239:145–207. doi: 10.1016/s0076-6879(94)39006-1.
- 6.Messerle BA, Wider G, Otting G, Weber C, Wüthrich K. Solvent Suppression using a Spin Lock in 2D and 3D NMR Spectroscopy with H2O Solutions. J Magn Reson. 1989;85:608–613. [Google Scholar]
- 7.Bax A, Sklenar V, Clore GM, Gronenborn AM. Water Suppression in Two-Dimensional Spin-Locked NMR Experiments Using a Novel Phase-Cycling Procedure. J Am Chem Soc. 1987;109:6511–6513. [Google Scholar]
- 8.For a review, see Guéron M, Plateau P, Decorps M. Solvent Signal Suppression in NMR. Prog NMR Spectr. 1991;23:135–209.
- 9.Jerschow A, Bodenhausen G. Mapping the B1 Field Distribution with Nonideal Gradients in a High-Resolution NMR Spectrometer. J Magn Reson. 1999;137:108–115. doi: 10.1006/jmre.1998.1645. [DOI] [PubMed] [Google Scholar]
- 10.Szántay C. Analysis and Implications of Transition-Band Signals in High-Resolution NMR. J Magn Reson. 1998;135:334–352. doi: 10.1006/jmre.1998.1599. [DOI] [PubMed] [Google Scholar]
- 11.Liu M, Mao X, Ye C, Huang H, Nicholson JK, Lindon JC. Improved WATERGATE Pulse Sequences for Solvent Suppression in NMR Spectroscopy. J Magn Reson. 1998;132:125–129. [Google Scholar]
- 12.Huang TL, Shaka AJ. Water Suppression That Works. Excitation Sculpting Using Arbitrary Wave-Forms and Pulsed-Field Gradients. J Magn Reson A. 1995;112:275–279. [Google Scholar]
- 13.Mescher M, Tannus A, Johnson MO, Garwood M. Solvent Suppression Using Selective Echo Dephasing. J Magn Reson A. 1996;123:226–229. [Google Scholar]
- 14.Nguyen BD, Meng X, Donovan KJ, Shaka AJ. SOGGY: Solvent-Optimized Double Gradient Spectroscopy for Water Suppression. A Comparison with Some Existing Techniques. J Magn Reson. 2007;184:263–274. doi: 10.1016/j.jmr.2006.10.014. [DOI] [PubMed] [Google Scholar]
- 15.Smallcombe SH, Patt SL, Keifer PA. WET Solvent Suppression and Its Applications to LC NMR and High-Resolution NMR Spectroscopy. J Magn Reson A. 1995;117:295–303. [Google Scholar]
- 16.Zhang S, Yang X, Gorenstein DG. Enhanced Suppression of Residual Water in a “270” WET Sequence. J Magn Reson. 2000;143:382–386. doi: 10.1006/jmre.1999.1987. [DOI] [PubMed] [Google Scholar]
- 17.Bax A. A Spatially Selective Composite 90° Radiofrequency Pulse. J Magn Reson. 1985;65:142–145. [Google Scholar]
- 18.Weljie AM, Newton J, Mercier P, Carlson E, Slupsky CM. Targeted Profiling: Quantitative Analysis of 1H NMR Metabolomics Data. Anal Chem. 2006;78:4430–42. doi: 10.1021/ac060209g. [DOI] [PubMed] [Google Scholar]
- 19.Zhang S, Nagana Gowda GA, Asiago V, Shanaiah N, Barbas C, Raftery D. Quantitative 1H NMR-based Metabolomics Study of Induced Diabetes in Rats. doi: 10.1016/j.ab.2008.07.041. submitted. [DOI] [PMC free article] [PubMed] [Google Scholar]
Associated Data
This section collects any data citations, data availability statements, or supplementary materials included in this article.
Supplementary Materials
Supplementary Figure Simulated on-resonance z magnetization after the adiabatic pulse used in the paper, shown as a function of RF strength.