


Abstract
In silico prediction of transcription factor binding sites (TFBSs) is central to the task of gene regulatory network elucidation. Genomic DNA sequence information provides a basis for these predictions, due to the sequence specificity of TF-binding events. However, DNA sequence alone is an impoverished source of information for the task of TFBS prediction in eukaryotes, as additional factors, such as chromatin structure regulate binding events. We show that incorporating high-throughput chromatin modification estimates can greatly improve the accuracy of in silico prediction of in vivo binding for a wide range of TFs in human and mouse. This improvement is superior to the improvement gained by equivalent use of either transcription start site proximity or phylogenetic conservation information. Importantly, predictions made with the use of chromatin structure information are tissue specific. This result supports the biological hypothesis that chromatin modulates TF binding to produce tissue-specific binding profiles in higher eukaryotes, and suggests that the use of chromatin modification information can lead to accurate tissue-specific transcriptional regulatory network elucidation.
INTRODUCTION
Transcription factors (TFs) mediate cellular response to intrinsic and extrinsic signals by controlling rates of transcription initiation throughout the genome. In eukaryotes, a typical TF will bind to occurrences of a number of similar, short DNA sequence (6–10 bp). With some eukaryotic haploid genomes containing gigabases of DNA, the number of such sequence instances is vast. For a typical TF, only a minority of potential binding sites will engage in the regulatory program of the cell.
Clearly, molecular mechanisms are at work in vivo to restrict binding of TFs to a subset of potential sites. The packaging of DNA and proteins to form chromatin is a critical property of the eukaryotic genome, affecting a range molecular processes including gene transcription, replication and DNA repair (1). Both the DNA and the histone proteins that comprise chromatin are subject to covalent modifications. Most of these modifications can be adjusted dynamically, and exhibit distinct genomic distributions under different cellular conditions. Covalent modifications to chromatin are hypothesized to modulate accessibility of DNA to TFs (2–4) and hence comprise a mechanism that the eukaryotic cell can employ to restrict TF binding.
In this article, we evaluate the use of chromatin modification information for improving predictions of TF binding sites (TFBSs) in silico. We consider the chromatin modification H3K4me3 (trimethylation of lysine 4 of histone H3), which has long been regarded as a marker for open chromatin and actively transcribed genes (1). The genome-wide distribution of this mark was recently characterized in several mouse and human tissues (5–7).
Computational analysis of TFBSs is a prerequisite to the elucidation of gene regulatory networks. Numerous tools have been developed to address challenges, such as de novo motif discovery (8,9), TFBS prediction (10), and statistical evaluation of binding site over-representation (11). However existing TFBS prediction tools are plagued by a lack of specificity. In order to predict all bona fide in vivo binding sites for a typical TF, considering only a model for the DNA sequence specificity, algorithms typically incur around 1000 false positive (FP) predictions for every true positive prediction. This very low specificity rate is unacceptable for almost all applications, and has been termed the ‘futility theorem’ (12). Current attempts to mitigate this problem typically encapsulate the concept of combinatorial interactions between TFs (13,14) or else make use of phylogenetic information (15,16). Several studies have shown that estimates of chromatin structure can be used to improve binding site predictions for individual TFs (17,18), but the generality of this result is yet to be established.
Here, we show that data estimating the distribution of chromatin modifications can be used to greatly improve the accuracy of genome-scale TFBS prediction for all 14 mouse TF and all 10 human TFs considered. The improvement gained are consistently highest when the chromatin modification data are derived from that same tissue in which the TFBS predictions are being made, which indicates that our approach yields tissue-specific TFBS predictions. This result supports the hypothesis that chromatin structure modulates the binding of TFs, yielding different binding outcomes in different cell types. In addition, chromatin modification information yields better performance than simple filtering using either transcriptional start site (TSS) or phylogenetic conservation information, indicating that our approach represents a significant advance on existing methods for refining TFBS prediction.
MATERIALS AND METHODS
Overview of approach
We evaluate the usefulness of H3K4me3 distribution information when applied as a filter in the context of TFBS prediction. We also evaluate TSS location information in the same manner in order to exclude the possibility that any benefit derived from H3K4me3 information is simply an outcome of a positive correlation between distribution of H3K4me3 and TSS location. Finally, we evaluate a filter based on conservation information in order to compare the benefit of using chromatin information with a commonly used approach in comparative genomics. In all three cases, we scan mouse genomic sequence using a log-odds position weight matrix (PWM) representing a single TF, scoring all nucleotides on both strands as potential TFBSs. We then filter these predictions, eliminating any that do not pass a threshold value. The parameters considered for threshold filtering are H3K4me3 density, distance to nearest TSS and phastCons (19) conservation score. We then measure the accuracy of the remaining predictions, sorted according to their PWM score. To do this, we first construct a ‘gold-standard’ for true TFBS sites, based on available high-throughput estimates of the in vivo binding locations of the given TF under investigation. Our accuracy metric is an receiver operating characteristic (ROC)-like curve that plots the number of FPs incurred at each in a range of true positive (TP) rates.
TFBS prediction approach
Our basic TFBS prediction approach is to exclude all PWM-predicted sites that do not pass a filter threshold based on auxiliary non-sequence information. For mouse, six types of filter were studied: distance to nearest KnownGenes TSS (20), distance to nearest CAGE Transcriptional Unit (CAGE TU) (21), embryonic stem (ES) cell H3K4me3 density, mouse embryonic fibroblast (MEF) H3K4me3 density, neural precursor (NP) H3K4me3 density (5) and phastCons score (19). For human, we studied four types of filter studied: ES cell H3K4me3 density, liver H3K4me3 density, pro-B cell H3K4me3 density (7) and T-cell H3K4me3 density (6).
Filtering thresholds were selected across a broad range of possible values, and an equal number of thresholds was considered for each filter type, to facilitate a fair comparison of the different types of filter. The filtering thresholds considered are given in Table 1.
Table 1.
Filtering thresholds considered
| Filter type | Thresholds considered |
|---|---|
| Distance to nearest mouse KnownGene TSS | ⩽ {10000, 5000, 2000, 1000, 500, 200} base pairs |
| Distance to nearest mouse CAGE TU | ⩽ {10000, 5000, 2000, 1000, 500, 200} base pairs |
| Mouse ES cell H3K4me3 density | ⩾ {1, 2, 4, 8, 16, 32} arbitrary units |
| Mouse MEF cell H3K4me3 density | ⩾ {1, 2, 4, 8, 16, 32} arbitrary units |
| Mouse NP cell H3K4me3 density | ⩾ {1, 2, 4, 8, 16, 32} arbitrary units |
| Mouse masked phastCons score | ⩾ {0.1, 0.2, 0.3, 0.5, 0.7, 1} arbitrary units |
| Distance to nearest human KnownGene TSS | ⩽ {10000, 5000, 2000, 1000, 500, 200} base pairs |
| Human ES cell H3K4me3 density | ⩾ {0, 0.1, 0.2, 0.5, 0.7, 1} arbitrary units |
| Human liver H3K4me3 density | ⩾ {0, 0.1, 0.2, 0.5, 0.7, 1} arbitrary units |
| Human REH cell H3K4me3 density | ⩾ {0, 0.1, 0.2, 0.5, 0.7, 1} arbitrary units |
| Human T-cell H3K4me3 density | ⩾ {1, 2, 4, 8, 16, 32} arbitrary units |
Units for each H3K4me3 density threshold are defined in section ‘Histone modification data’. Units for the masked phastCons score are defined in the ‘Phylogenetic conservation data’ section.
Each nucleotide position in the corresponding genome (assembly mm8 for mouse, assembly hg18 for human) was scored using the PWM for a given TF as described below in ‘Assignment of PWM scores’. The scored nucleotides were then paired with the corresponding H3K4me3 signal, distance to TSS, and gold-standard status (binding site or non-binding site). All H3K4me3 signals (summarized in Supplementary Table 3) for the given organism were considered. TSS information sources considered were KnownGenes (20) for mouse and human, and CAGE TUs (21) for mouse. For mouse TFs, each nucleotide position was paired with the corresponding masked phastCons (19) score, defined below in the ‘Phylogenetic conservation data’ section.
Mouse genomic positions were excluded at this point if they did not have H3K4me3 estimates due to overlap with repetitive elements [as defined by Mikkelsen et al. (5)]. Repetitive elements were also excluded in the study using human data, as we made use of the repeat-masked human genomic sequence when performing the TFs PWM scan.
When predicting binding sites for TFs whose distribution was estimated by chromatin immunoprecipitation (ChIP) with DNA microarrays (ChIP-chip), as opposed to sequencing approaches (ChIP-seq or ChIP-PET) (22), we also excluded locations that were not encompassed by the ChIP-chip microarray probes. For gold-standard datasets derived from the Jiang et al. (23) data, the regions probed by microarrays were restricted to selected gene promoters. For HNF1A, HNF4A, HNF6 and FOXA2, the probed regions only encompassed gene promoters as defined by Odom et al. (24). For human Nanog, Oct4, Sox2 and E2F4, the microarrays only encompassed gene promoters as defined by Boyer et al. (25). For human cMyc and Sp1, the microarrays only encompassed all non-repetitive regions in human chromosomes 21 and 22.
In order to get estimates of the variance in FP rates, we randomly split the paired data into four equal-sized groups. The ordering of positions within each group was then randomized. Binding site predictions were performed for each of the resulting replicates as follows. First, all nucleotides that did not pass the given filtering criteria were excluded. Predictions were then made in order of increasing PWM P-value, starting with the nucleotide exhibiting the lowest (i.e. best) PWM P-value. A TP was noted each time a gold-standard TFBS nucleotide was encountered. A FP was noted each time a non-gold-standard TFBS nucleotide was encountered. Using the four replicates, the mean and standard error of the number of FPs incurred at each TP rate were computed to produce data points and error bars on an ROC-like curve for that filtering approach.
The above procedure was carried out for each of the gold-standard datasets listed in Supplementary Table 1.
Best relative FP improvement
In order to compare the performance of different filtering approaches, we employ a ‘best relative FP improvement’ metric. This value represents the best improvement in FP rate that a given filter approach can attain at a specified true positive rate, over all filtering thresholds considered for that filter type. We define the best relative FP improvement, Is, at a percent sensitivity rate (i.e. TP rate) of s as:
| 1 |
Here, X is the number of FPs incurred by the best performing filter of the specified type, and Y is the number of FPs incurred by the PWM scan with no filter when the sensitivity is s percent.
Figure 1 illustrates the calculation of I80 for the H3K4me3 filter type for the TF E2F1.
Figure 1.

Improvement in E2F1 TFBS prediction by H3K4me3 signal filtering. ROC-like plot shows the TP rate versus the actual number of FPs. Error bars indicate standard error. The TF gold-standard and H3K4me3 data are each derived from mouse ES cells. This figure also serves to illustrate calculation of the ‘best relative FP improvement statistic’, (Is), defined in the Methods section.
Assignment of PWM scores
MAST (26) was used to assign a PWM score to each nucleotide position in the genome, using the parameters specified in the ‘Gold-standard TFBS data’ section. A P-value threshold of 0.005 was applied in order to limit the amount of data processed. As a result of applying this threshold, a small number of regions that were estimated to bind a given TF (according to high-throughput ChIP) were excluded from the analysis as they did not contain a nucleotide position with a P-value below this threshold. Typically fewer than 5% of the regions were excluded as a result of this procedure (see Supplementary Table 1).
Histone modification data
Mouse ES, MEF and NP ChIP-seq H3K4me3 density estimates were obtained from Mikkelsen et al. (5). These estimates represent the density of antibody-enriched fragments, calculated at 25-bp resolution. Each value is calculated by adding one to the density for each uniquely aligned fragment occurring within 200 bp of the given position. Reads occurring within 300 bp, but further than 200 bp, from a given position contribute a count of 0.25 to the density in that 25 bp interval.
Human T-cell ChIP-seq H3K4me3 density estimates were obtained from Barski et al. (6). These estimates represent the density of antibody-enriched fragments, calculated at 200-bp resolution, except for CCCTC-binding factor (CTCF), which was calculated at 400-bp resolution. The density in each window is equal to the number of tags that mapped to that genomic window.
Human ES cell, liver and REH ChIP-chip H3K4me3 density estimates were obtained from Guenther et al. (7). We processed the original ChIP-chip data using the following approach. For each 200 bp window in the human genome, we retrieved data from all probes located within 500 bp of the centre of that window. We then averaged the H3K4me3 log enrichment ratio for those probes [as provided by Guenther et al. (7)]. Thus, the units of H3K4me3 represent the mean log fluorescence enrichment ratio of all probes within 500 bp of the centre of the given 200 bp genomic window.
The publications from which the H3K4me3 datasets were derived are summarized in Supplementary Table 3.
Phylogenetic conservation data
We used the mm8 phastCons (19) score as our measure of mouse genomic phylogenetic conservation. This measure of conservation is based on a multiple alignment of 17 vertebrate genomes. However, we modified the score by assigning a score of zero to all locations that overlap a KnownGenes exon. We did this in an attempt to improve the performance of phastCons filtering, since phylogenetic conservation of a protein-coding region cannot be interpreted as evidence for functional regulatory elements. We refer to the resulting score as the ‘masked’ phastCons score.
In addition, we considered the raw phastCons score as a phylogenetic conservation filter. Performance of this filter was similar to the masked phastCons score filter (data not shown).
TSS proximity data
The KnownGene (20) and CAGE TU (21) databases from the February 2006 (mm8) assembly were each used separately as estimates of TSS positions in mouse. The KnownGenes database comprises gene predictions based on expressed sequence tag (EST) data, and contains 31 863 annotated TSS, whereas the CAGE TU database is derived from analysis of CAGE tags, and contains 39 362 annotations.
Creating a TFBS ‘gold-standard’
Genomic regions estimated to be enriched for TF binding in various human and mouse tissues were obtained from high-throughput ChIP datasets as summarized in Supplementary Table 1. The mouse ES cell distribution for Klf4, Oct4 and Nanog have been estimated in multiple publications. For these TFs, we used each publication dataset to generate an independent gold-standard dataset. We preprocessed the regions estimated as being bound by designating a single nucleotide as a binding site and designating the rest as non-binding sites. The designated site was chosen by scanning both DNA strands of the region with a PWM for the given TF and selecting the single nucleotide position that exhibited the closest match to the PWM. If more than 1-nt position exhibited the closest match to the PWM, then the first such position encountered (counting from 5′ of the positive strand) was arbitrarily chosen as the binding site position. MAST (26) was used to determine how closely each nucleotide in a given ChIP peak region matched the PWM, using the following parameters:
![]()
Designating a single nucleotide in a given region as a binding site invokes an assumption that a binding event observed by the high-throughput ChIP assay occurs as a result of the given TF binding to the nucleotide position exhibiting the strongest match to its PWM. Clearly there will be cases when this assumption is violated, due to TF binding to other sequences within a region designated as a ChIP peak. Thus, some gold-standard binding sites will in fact be non-binding sites, and some sites marked as non-binding sites should in fact be labelled as gold-standard sites. However, whilst the gold-standard information is not a perfect reflection of in vivo binding, it is the same for all TFBS predictors, and does not favour any individual approach. This issue is more prominent for TFBS datasets in which the publishing authors did not provide a precise binding site location estimate, but provided broad genomic coordinates instead.
Binding regions declared by Chen et al. (27) were typically short (∼10 bp), corresponding to the ChIP peak signal locations. Sequences pulled down by ChIP are typically larger than 500 bp, and so the location of the nucleotide giving rise to a strong ChIP-seq or ChIP-chip signal will not necessarily coincide with the estimated location of the ChIP signal peak. We wished to ensure that the regions scanned by MAST during gold-standard definition included the nucleotide that was responsible for the high ChIP signal. Thus for TFBS datasets derived from Chen et al. (27), we expanded the declared binding regions by 100 bp either side, resulting in binding regions ∼200 bp in width. For datasets derived from Cawley et al. (28), Odom et al. (24) and Boyer et al. (25), binding regions estimated by the authors smaller than 500 bp in width were expanded equally on either side to 500 bp. For all remaining TFBS datasets, we used the estimated binding regions as defined by the authors.
Verifying the ‘gold-standard’
We employed the protocol established by Kheradpour et al. (29) to generate a set of column-shuffled PWM variants for each of the mouse TFs investigated. For most TFs, 10 variants were generated. However for the Klfs, Zfx and Stat3, the protocol yielded seven, two and three variant motifs, respectively. The resulting ‘random’ motifs are similar to the original in terms of information content and number of sites predicted in the genome, but dissimilar to the PWM of any known TF in the organism. For each mouse TFBS dataset, we then scanned each author-defined binding region (ADR), using the column-shuffled variants of the PWM corresponding to the TF (as stated in Supplementary Table 2). From this scan, we calculated the optimal scores for each PWM in all ADRs. This process allows us to estimate null distributions of the optimal ADR PWM scores.
We used the null distribution to compute the P-value of each optimal ADR PWM score observed under the original motif. We then used methods described by Storey and Tibshirani (30) to compute q-values, which indicate false discovery rate. Thus the q-value of a given author-defined TF-binding region is equal to the fraction of gold-standard sites that are estimated to be incorrect, when that author-defined region is the least significant region (i.e. has the least significant optimal match to the PWM) to be included in the gold-standard dataset.
As stated in the ‘Creating a TFBS gold-standard’ section, we excluded author-defined TF-binding regions that did not encompass a nucleotide with a PWM score P-value below the threshold 0.005. Using this threshold, the vast majority of gold-standard nucleotides are estimated to be true in vivo TF-binding nucleotides, as indicated by the q-value statistic (Table 2). q-values are lower than 0.05 for Esrrb and CTCF gold-standard datasets, and 12 out of 17 TFBS gold-standard datasets have q-values lower than 0.4. Morever, by modifying the MAST P-value threshold used when defining the gold-standard, a false discovery rate lower than 0.1 could be achieved whilst retaining a large number (>200) of ADRs, for all TFs except Nanog.
Table 2.
Quality of gold-standard datasets
| Gold-standard dataset | q-value | # ADRs retained |
|---|---|---|
| Esrrb | 0.02 | 21 647 |
| CTCF | 0.05 | 39 609 |
| Klf2 | 0.14 | 219 |
| Tcfcp2l1 | 0.15 | 24 398 |
| Oct4 [Loh (31)] | 0.17 | 859 |
| Klf4 [Chen (27)] | 0.17 | 9912 |
| Smad1 | 0.19 | 770 |
| Sox2 | 0.29 | 2498 |
| Stat3 | 0.32 | 1368 |
| Klf5 | 0.36 | 198 |
| Oct4 [Chen (27)] | 0.39 | 2073 |
| Zfx | 0.40 | 256 |
| Klf4 [Jiang (23)] | 0.43 | 225 |
| cMyc | 0.48 | 825 |
| nMyc | 0.60 | 1077 |
| Nanog [Chen (27)] | 0.69 | 5 |
| Nanog [Loh (31)] | 0.91 | 3 |
‘q-value’ reported is the q-value of the author-defined TF-binding region (ADR) that had the worst match to the PWM and yet passed our MAST threshold. ‘# ADRs retained’ is the number of author-defined TF-binding regions that would be retained if a q-value threshold of 0.1 were applied.
Both Nanog gold-standard datasets exhibited relatively high q-values. This potentially indicates that the Nanog motif employed here does not fully account for Nanog's; DNA-binding behaviour. This is consistent with recent studies that suggest Nanog might bind indirectly, via and Oct/Sox heterodimer (31,32).
Position weight matrices
A PWM was assigned to each TF, and used when performing both gold-standard pre-processing and binding site prediction for the given TF. The PWM assigned to each TF and the source of each PWM is summarized in Supplementary Table 2. The position-specific frequency matrix for each TF is provided in Supplementary Material, in addition to the corresponding LOGO (33) representation.
For some TFs, no accurate PWM information was available. In these cases, we performed de novo motif discovery on high-throughput binding datasets in order to obtain a PWM.
For HNF1A, we performed de novo discovery on all sequences that Odom et al. (24) estimated to bind that TF. We used MEME (8), with the following parameters:
![]()
We performed motif discovery on Chen et al. (27) binding datasets, selecting the first 100 binding regions sorted according to chromosomal location, in order to facilitate motif discovery in reasonable time. We used GLAM (9), with the following parameters:
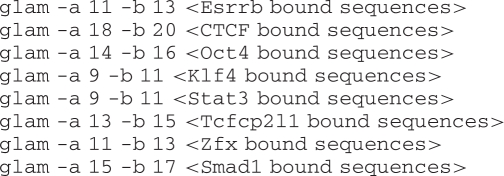
We made no effort to ensure that all PWMs were independent of the gold-standard sequence datasets. The PWMs HNF1A, CTCF, Klf4, Oct/Sox, Stat3, Zfx, Esrrb and Tcfcp2l1 were all derived by performing motif discovery on a subset of the sequences used to define the gold-standard. All other PWMs were obtained from independent data sources, such as the JASPAR database. However, our analysis focuses on the relative benefit of H3K4me3 information, rather than absolute predictive performance of any particular TFBS predictor. Deriving PWMs from the gold-standard sequences is not expected to favour any particular filtering scheme, and so using such PWMs has allowed us to achieve our goal of a fair estimation of the relative benefit of the various filtering types.
Uniform background frequencies were used when converting frequency matrices into log-odds PWMs. A pseudo-count value of 0.0001 was added to each value in each column of all frequency matrices before converting to PWMs.
RESULTS
First, we illustrate the benefit of using H3K4me3 data to improve prediction of TFBSs. We then provide evidence that H3K4me3 information is more useful than TSS annotation and phylogenetic conservation information in the context of TFBS prediction. We also provide evidence that TFBS predictions using H3K4me3 information are tissue specific. We show that the above observations are general for all 14 TFs investigated in mouse. We present further evidence supporting the tissue specificity of TFBS predictions, based on experiments with 10 human TFs. Finally, we demonstrate that our approach can be easily applied as-is for in silico prediction of binding sites for other TFs not investigated here.
Benefit of H3K4me3 filtering
We measure the effect of incorporating H3K4me3 distribution information as a filter to a PWM scan, for 14 TFs and the insulator-binding protein CTCF in mouse ES cells. Figure 1 clearly shows that filtering TFBS predictions based on H3K4me3 information can greatly improve specificity over a wide range of sensitivity levels. For example, employing a H3K4me3 filter with a threshold of 4.0 results in a 78% reduction in the number of FP E2f1 binding site predictions, relative to a PWM scan, at a sensitivity (i.e. TP rate) of 80%.
Each filter has an upper limit on the TP rate that can be achieved. For example, applying the filter H3K4me3 ⩾8 can yield a maximum sensitivity of 70%, as this filter eliminates 30% of the actual positives.
Superiority over TSS-based filtering
The chromatin modification H3K4me3 is known to associate with TSS. Therefore, it is plausible that the improvement in predictive accuracy yielded by H3K4me3 information might simply be a result of this correlation. In order to address this possibility, we compare the H3K4me3 filter against a filter based on proximity to the nearest TSS. We considered two independent TSS data sources; the UCSC KnownGenes database (20) and the CAGE TUs (21).
We find that the performance of H3K4me3 filtering is significantly superior to TSS proximity filtering over a large range of sensitivities, for all TFs considered. Figure 2 shows that a H3K4me3 filter of 2.0 attains an equal or higher specificity than a CAGE TU TSS filter over all sensitivity rates, for the TF Klf4. Relative performance of H3K4me3 and CAGE TU filtering is similar for the remaining 13 mouse TFs considered and CTCF. In all cases, H3K4me3 filtering performs better than CAGE TU filtering over most sensitivities, and never performs worse (data not shown).
Figure 2.

Comparison of H3K4me3 and TSS proximity filter performance for Klf4 TFBS prediction. ROC-like plot shows the TP rate versus the actual number of FPs. Error bars indicate standard error. The TF gold-standard and H3K4me3 data are each derived from mouse ES cells. A subset of all CAGE thresholds are presented for clarity.
Superiority over phastCons-based filtering
Researchers frequently use phylogenetic information in an attempt to improve the accuracy of TFBS predictions. One commonly used approach is to filter out predictions that occur in regions of low sequence conservation. The program phastCons can be used to estimate the extent of phylogenetic conservation at each position in a given genome. PhastCons scores have previously been computed for the mouse genome, based on a multiple alignment of the mouse genome with other vertebrate genomes (19).
In order to perform a preliminary comparison of chromatin and phylogenetic information in the task of TFBS prediction, we evaluate the effect of a phylogenetic conservation filter, using the phastCons score at each genomic position as our measure of conservation. The phastCons filter produces very little improvement relative to the PWM scan, for all sensitivities and all TFs considered (data not shown). For example, employing a phastCons filter only proves effective at very low sensitivity rates for the TF nMyc (Figure 3). Even at low sensitivity rates, all phastCons filters are less effective at reducing the FP rate compared with a H3K4me3 filter threshold of 2.0 for this TF. Similar results are observed for all other TFs, as the optimal phastCons filter never outperforms the optimal H3K4me3 filter for any range of sensitivities and all TFs. This result suggests that estimates of epigenetic chromatin modifications might prove intrinsically more useful than phylogenetic conservation in the task of TFBS prediction. However, multiple approaches have been developed for making use of phylogenetic information (29,34,35), and such approaches may prove effective in combination with chromatin structure information as the two information sources are orthogonal.
Figure 3.

Comparison of H3K4me3 and phastCons filter performance for nMyc TFBS prediction. ROC-like plot shows the TP rate versus the actual number of FPs. Error bars indicate standard error. The TF gold-standard and H3K4me3 datasets are each derived from mouse ES cells. PhastCons filter performance for the other mouse TFs considered is similar to performance shown here for nMyc, as the optimal phastCons filter never outperforms the optimal H3K4me3 filter, for any TF or sensitivity level.
Tissue specificity of TFBS predictions
Individual TFs can regulate target gene expression in distinct tissues and/or developmental stages. For example, Klf4 is a critical regulator of pluripotency and self-renewal in ES cells (36), but also regulates skin development (37). The genomic distribution of chromatin modifications differs between tissues (5), and may influence TF binding to yield distinct TF-binding profiles in different tissues. With this in mind, we investigate whether predictions generated using a H3K4me3 filter are tissue specific. In particular, we test whether the accuracy of TFBS predictions is highest when the H3K4me3 data derives from the same tissue as the ‘gold-standard’ TFBS data used for assessing predictive accuracy. We find that predictive accuracy is greatest when the H3K4me3 data is derived from ES cells, rather than MEFs or NPs. This is consistent with the hypothesis that chromatin modifications direct tissue-specific TF binding, as the TFBS gold-standard data were derived from mouse ES cells. The mouse cMyc TF exemplifies this outcome (Figure 4).
Figure 4.

Tissue specificity of cMyc TFBS predictions made with H3K4me3 filter. ROC-like plot shows the TP rate versus the actual number of FPs. Error bars indicate standard error. The TF gold-standard data are each derived from mouse ES cells.
Consistency of H3K4me3 filter performance over multiple TFs
In Figures 5 and 6, we illustrate the tissue specificity and superiority of ES H3K4me3 filtering in mouse ES cells over all TFs considered. The TFBS gold-standard datasets for these TFs are derived from mouse ES cells.
Figure 5.

Filter performance in mouse ES cells at sensitivity 20%. The best relative FP rate (as defined in the Methods section) of each filter type has been plotted for the 18 mouse gold-standard TFBS datasets. Multiple gold-standard datasets were available for Klf4, Oct4 and Nanog, and the first author of the corresponding gold-standard dataset has been indicated. PhastCons filtering failed to yield a positive relative FP rate improvement for any of the 18 gold-standard datasets at this sensitivity level, and so has been omitted. Error bars indicate standard error. Barplot mean and standard errors smaller than −1 have been truncated to −1, to allow clearer visualization of relative FP improvement values between 0 and 1.
Figure 6.

Filter performance in mouse ES cells at sensitivity 80%. The best relative FP rate (as defined in the Methods section) of each filter type has been plotted for the TFs cMyc, E2F1, nMyc and Zfx. PhastCons filtering failed to yield a positive relative FP rate improvement for any of the four gold-standard datasets at this sensitivity level, and so has been omitted. Error bars indicate standard error. For a given TF and filter, if the filter cannot attain a sensitivity of 80% due to actual positive elimination, then the bar is omitted from the plot.
We measure the effect of TSS annotation, phylogenetic conservation and H3K4me3 distribution filtering for 14 mouse TFs and the insulator binding protein CTCF. We find that a H3K4me3 filter significantly improves the FP rate of predictions for all 14 TFs, but not for CTCF. The ‘gold-standard’ distribution for each TF (and CTCF) was estimated in mouse ES cells. For Klf4, Oct4 and Nanog, multiple gold-standard datasets were available. We employ each such gold-standard dataset independently. In order to summarize the effect of the six types of filter considered (KnownGene, CAGE, phastCons, ES-, MEF- and NP-H3K3me3), we calculate the best relative FP rate at a sensitivity level of 20% (I20 as defined in the Methods section) for each filter type. Figure 5 indicates that the ES H3K4me3 filter outperforms all other filters at this sensitivity level, for 14 of the 18 gold-standard datasets. For the remaining four TFs tested (cMyc, E2f1, nMyc and Zfx), the ES H3K4me3 filter outperforms the other filters at a higher sensitivity of 80% (Figure 6). Thus, the benefit of H3K4me3 information in facilitating accurate tissue-specific TFBS predictions appears to be general for most if not all TFs.
Independent confirmation of tissue specificity for human TFs
The superior performance of ES H3K4me3 filtering relative to NP and MEF H3K4me3 filtering observed in mouse could, in principle, be attributed to superior quality of the ES-derived H3K4me3 data. To control for H3K4me3 data quality, and to investigate the issue of tissue specificity more closely, we perform additional experiments using H3K4me3 and TFBS data derived from several human tissues. We make use of genome-scale binding estimates for 10 TFs, as derived in three tissues (human liver, human ES cells and a T-cell line) (24,25,28), in combination with genome-wide H3K4me3 distribution estimates from the same three tissues plus REH (pro-B) cells.
For each of the 10 TFs considered, we measure I20 for the H3K4me3 filters based on chromatin data from four distinct tissue types: liver, ES, T-cells and REH cells. We find that TFBS accuracy is consistently highest when the chromatin and binding data derive from the same tissue, as shown in Figure 7. For instance, prediction of binding sites for TFs HNF4A, HNF1A, HNF6 and FOXA2, whose distribution was estimated in liver, is maximal when the H3K4me3 information is also derived from liver. If this was simply an outcome of the liver H3K4me3 data being of higher quality than REH, T-cell and hES data, then we would expect liver data to yield maximal predictive improvement for TFs whose distribution was estimated in these other tissues. Instead, prediction of T-cell binding sites is most accurate using T-cell H3K4me3 estimates, and prediction of hES binding sites is most accurate using hES H3K4me3 estimates. E2F4 is the only TF that does not exhibit this pattern. These results provide a strong and independent confirmation that H3K4me3 information facilitates tissue-specific prediction of TFBSs.
Figure 7.

Tissue specificity of TFBS predictions in three human tissues. The best relative FP rate (as defined in the Methods section) of each H3K4me3 filter is shown for the 10 human gold-standard TFBS datasets. Each arrow indicates the results for the H3K4me3 filter using data estimated from the same tissue as the given TFBS gold-standard data. For example, the distribution of HNF4A TFBSs was estimated in liver, so the arrow points to the liver results for HNF4A. Error bars indicate standard error. Barplot mean and standard errors smaller than −1 have been truncated to −1, to allow clearer visualization of relative FP improvement values between 0 and 1.
Practicality of H3K4me3 filtering
We find that the optimal H3K4me3 filter stringency at a given sensitivity level varies depending on the TF under investigation. For example, at a sensitivity of 20%, a threshold of 2.0 yields the best performance for Esrrb, whereas a threshold of 16.0 yields the best performance for cMyc.
This might suggest that substantial ‘tuning’ of the H3K4me3 filter threshold is required for it to be useful in practice. In fact, we find that a significant improvement in predictive performance is obtained for all TFs using a single H3K4me3 threshold value. For example, a threshold of 1.0 yields a significant improvement for all TFs considered in mouse (excluding insulator-binding protein CTCF), at a sensitivity of 20% (Figure 8a). A threshold of 2.0 yields an even more significant improvement in the relative FP rate for all TFs considered in mouse, at a sensitivity of 10% (Figure 8b). Therefore, availability of a training dataset for the TF of interest is not a requirement in order for a researcher to employ our simple approach for improving TFBS prediction.
Figure 8.

Performance of H3K4me3 filtering without optimization of threshold. The relative FP rate has been plotted for a H3K4me3 filter, with a threshold of 1.0 at a sensitivity of 20% (a) and a more stringent threshold of 2.0 at the lower sensitivity of 10% (b). Error bars indicate standard error. Note that the results presented are relative FP improvement of a filter with a single given threshold, rather than best relative FP improvement. That is, we have not optimized the filtering threshold used.
DISCUSSION
We have shown that high-throughput chromatin modification information can greatly improve prediction of TFBSs in higher eukaryotes. Using H3K4me3 information as a simple filter to PWM-based predictions yields a significant improvement in predictive accuracy for the 14 mouse and 10 human TFs considered. Filtering based on H3K4me3 significantly outperforms filtering based on TSS location or phylogenetic conservation information, over a wide range of sensitivities.
There are several possible explanations for the superior performance of H3K4me3 information relative to TSS information. We consider three such explanations. First, genome-wide H3K4me3 distribution estimates might be better able to facilitate TSS identification, compared with previously available TSS data sources. Second, H3K4me3 might be indicative of enhancer regions as well as promoter regions, as suggested by recent high-throughput characterization of the modification (6). Third, some of the performance difference could be due to H3K4me3 information facilitating tissue-specific TFBS predictions.
The first potential explanation for the relative success of H3K4me3 filtering compared with TSS filtering (improved ability to locate real TSSs) seems unlikely. Genomic H3K4me3 distribution estimates are unlikely to be superior to CAGE data in the task of identifying TSSs, as CAGE is a highly sensitive and specific method for TSS determination (38).
The second potential explanation (ability to locate enhancer regions) seems more likely. Anecdotal evidence suggests that H3K4me3 does denote enhancer regions in many instances. For example, the red box in Figure 9a is situated ∼7500-bp upstream of the annotated Bmp4 gene promoter. This region could conceivably correspond to an upstream alternative promoter, however none of the three TSS databases considered [CAGE TU (21), KnownGene (20) and NIA Gene (39)] support this possibility. A more plausible explanation is that it represents an enhancer region for Bmp4. In Figure 9b, the shaded region lies downstream of all transcripts registered in the two gene annotation databases, which suggests the selected region cannot designate an alternative TSS for the transcriptional unit, and is instead likely to be an enhancer. In both anecdotal examples, TFBS prediction should derive more benefit from H3K4me3 information compared with the available gene annotation information.
Figure 9.

Overlap between H3K4me3 and TF occupancy in ES cells at the Bmp4 (a) and Otx2 (b) gene loci. The track labelled ‘ES_K4 wig’ indicates the distribution of H3K4me3 in mouse ES cells, as published by Mikkelsen et al. (5). Units of H3K4me3 density are described in the Methods section. UCSC KnownGenes and NIA Genes are shown in the lowest two tracks for each displayed region. CAGE TU locations are indicated, as are binding locations for TFs Nanog, Oct4, Klf2, Klf4 and Klf5 estimated by Jiang et al. (23) and Loh et al. (31). Red boxes indicate regions at which the available H3K4me3 information should be of greater benefit to TFBS prediction, compared with the available TSS location information, due to the large distance between the TFBSs and known TSSs.
A comparison of the performance of the CAGE TU and H3K4me3 filters suggests that H3K4me3 identification of enhancer regions probably accounts for a large fraction of the difference in performance of these two filter types. Only 74% of Zfx binding sites reside within 10 kb of a CAGE TU, suggesting that a large fraction of binding sites occur within enhancer regions. In contrast, 96% of Zfx binding sites co-occur with an ES H3K4me3 signal >1.0. An ES H3K4me3 signal filter of 1.0 performs significantly better than an unfiltered PWM scan for all sensitivities <96%. Taken together, these observations suggest that H3K4me3 does denote many enhancer regions, and that this accounts for a large fraction of the difference in performance between the CAGE TU and the H3K4me3 filter types.
Our final suggestion for the cause of the superiority of H3K4me3 filtering (tissue specificity) is well supported by our results. We have provided strong evidence that chromatin modification information facilitates prediction of tissue-specific TFBSs. For all TFs investigated except human E2F4, the chromatin information source that proves most effective derives from the same tissue in which the TFBS ChIP assay was performed. The TF E2F4 in human does not follow this pattern, perhaps because it is also highly expressed in the other two mouse tissues considered, MEFs and NPs. However, the pattern is consistent for all remaining 27 gold-standard datasets considered. Additionally, we have controlled for the factor of H3K4me3 data source quality by our formulation of the analysis conducted with human TFs.
Same-tissue H3K4me3 data proved more useful than other H3K4me3 data when predicting mouse ES cell TFBSs. However for TFs Zfx, cMyc, nMyc and E2F1, this advantage only becomes evident at high sensitivity levels (Figure 6). Interestingly, these four TFs are relatively broadly expressed, whereas the remaining TFs are more ES-cell specific in their expression pattern. Our data support the biological hypothesis that the four broadly expressed TFs target a range of tissue-independent binding sites, but also target some ES-cell specific binding sites.
The ability to predict tissue-specific TFBSs is a clear advantage of our method, given that TFs can act in different regulatory frameworks in different tissue types. We expect that proliferating high-throughput chromatin modification datasets will facilitate tissue-specific regulatory network characterization.
There was a single exception to our observation that H3K4me3 information improves accuracy of binding site predictions. The accuracy of site predictions for the DNA-binding protein CTCF is not improved by H3K4me3 filtering at a sensitivity of 20%, in contrast to all other mouse DNA-binding proteins considered (Figure 5). This is not surprising since CTCF binds to transcriptionally inert regions of the genome that function as insulators or boundary elements (40).
The genomic binding distribution of CTCF is thought to be invariant between different tissues (40), which is consistent with the hypothesis that tissue-specific chromatin modifications do not modulate binding of this particular DNA-binding protein. The observed negligible predictive improvement for CTCF supports this model.
CTCF has 11 C2H2 zinc fingers a very wide and information-rich binding motif (40). Chen et al. (27) estimate the CTCF PWM to be 19 residues wide, which is nearly twice the median width of all PWMs in the JASPAR database. Consequently, it is possible to predict a large number of CTCF binding sites with high precision using the PWM model for DNA binding alone. For example, at a sensitivity of 20%, 57% of such predictions are TPs. This value far exceeds the specificity achieved with a PWM scan for all other factors considered here, with PWM scans for other factors typically achieving ∼5% TP enrichment at this sensitivity.
The very simple strategy for harnessing phylogenetic information (phastCons filtering) proved ineffective at improving specificity, at all sensitivities considered. More sophisticated comparative genomics methods could potentially yield better predictive performance. However, the difference in performance between chromatin information and phylogenetic information is easily explained. Chromatin structure data directly reflects the molecular parameters that control TF-binding events, whereas phylogenetic conservation is indirect and subject to many confounding evolutionary variables. Regardless, chromatin structure and phylogenetic data are complementary, and comprise orthogonal sources of information that can be utilized simultaneously in TFBS prediction.
We have shown that accurate tissue-specific TFBS predictions can be generated by employing chromatin information. We have employed a simple approach here in order to facilitate simple and direct comparisons between chromatin structure information and other relevant sources of information. The approach presented here is thus preliminary and we intend to develop a more flexible and powerful framework for harnessing large-scale chromatin structure estimates. Nonetheless, this approach is readily applicable for researchers wishing to identify TFBSs in tissues for which H3K4me3 data are published, including tissues listed in Supplementary Table 3. A researcher who is interested in predicting a small number of loci that are highly likely to be true binding sites should apply a stringent filter (Figure 8b), and the stringency of the filter should be relaxed as the researcher searches for additional binding sites (Figure 8a).
Currently, genome-wide H3K4me3 distribution estimates are available for a limited number of tissues and organisms. However, rapid improvements in sequencing and microarray technology promise to yield many more such datasets in the near future.
SUPPLEMENTARY DATA
Supplementary Data are available at NAR Online.
FUNDING
Australian Postgraduate Award; Australian Research Council Discovery Grant (DP 0770471). Funding for open access: National Institutes of Health.
Supplementary Material
ACKNOWLEDGEMENTS
We wish to acknowledge John Hawkins for assitance with motif randomisation, Paulo Amaral for helpful discussions, and Cas Simons for assistance with the genome browser.
REFERENCES
- 1.Kouzarides T. Chromatin modifications and their function. Cell. 2007;128:693–705. doi: 10.1016/j.cell.2007.02.005. [DOI] [PubMed] [Google Scholar]
- 2.Guccione E, Martinato F, Finocchiaro G, Luzi L, Tizzoni L, Dall'O;lio V, Zardo G, Nervi C, Bernard L, Amati B. Myc-binding-site recognition in the human genome is determined by chromatin context. Nat. Cell Biol. 2006;8:764–U225. doi: 10.1038/ncb1434. [DOI] [PubMed] [Google Scholar]
- 3.ENCODE. Identification and analysis of functional elements in 1% of the human genome by the encode pilot project. Nature. 447:799–816. doi: 10.1038/nature05874. [DOI] [PMC free article] [PubMed] [Google Scholar]
- 4.Liu X, Lee CK, Granek JA, Clarke ND, Lieb JD. Whole-genome comparison of Leu3 binding in vitro and in vivo reveals the importance of nucleosome occupancy in target site selection. Genome Res. 2006;16:1517–1528. doi: 10.1101/gr.5655606. [DOI] [PMC free article] [PubMed] [Google Scholar]
- 5.Mikkelsen TS, Ku M, Jaffe DB, Issac B, Lieberman E, Giannoukos G, Alvarez P, Brockman W, Kim T-K, Koche RP, et al. Genome-wide maps of chromatin state in pluripotent and lineage-committed cells. Nature. 2007;448:553–560. doi: 10.1038/nature06008. [DOI] [PMC free article] [PubMed] [Google Scholar]
- 6.Barski A, Cuddapah S, Cui K, Roh T-Y, Schones DE, Wang Z, Wei G, Chepelev I, Zhao K. High-resolution profiling of histone methylations in the human genome. Cell. 2007;129:823–837. doi: 10.1016/j.cell.2007.05.009. [DOI] [PubMed] [Google Scholar]
- 7.Guenther MG, Levine SS, Boyer LA, Jaenisch R, Young RA. A chromatin landmark and transcription initiation at most promoters in human cells. Cell. 2007;130:77–88. doi: 10.1016/j.cell.2007.05.042. [DOI] [PMC free article] [PubMed] [Google Scholar]
- 8.Bailey TL, Williams N, Misleh C, Li WW. MEME: discovering and analyzing DNA and protein sequence motifs. Nucleic Acids Res. 2006;34:W369–W373. doi: 10.1093/nar/gkl198. [DOI] [PMC free article] [PubMed] [Google Scholar]
- 9.Frith MC, Hansen U, Spouge JL, Weng Z. Finding functional sequence elements by multiple local alignment. Nucleic Acids Res. 2004;32:189–200. doi: 10.1093/nar/gkh169. [DOI] [PMC free article] [PubMed] [Google Scholar]
- 10.Bailey TL, Gribskov M. Combining evidence using p-values: application to sequence homology searches. Bioinformatics. 1998;14:48–54. doi: 10.1093/bioinformatics/14.1.48. [DOI] [PubMed] [Google Scholar]
- 11.Frith MC, Fu Y, Yu L, Chen J-F, Hansen U, Weng Z. Detection of functional DNA motifs via statistical over-representation. Nucleic Acids Res. 2004;32:1372–1381. doi: 10.1093/nar/gkh299. [DOI] [PMC free article] [PubMed] [Google Scholar]
- 12.Wasserman WW, Sandelin A. Applied bioinformatics for the identification of regulatory elements. Nat. Rev. Genet. 2004;5:276–287. doi: 10.1038/nrg1315. [DOI] [PubMed] [Google Scholar]
- 13.Bailey TL, Noble WS. Searching for statistically significant regulatory modules. Bioinformatics. 2003;19(Suppl 2):II16–II25. doi: 10.1093/bioinformatics/btg1054. [DOI] [PubMed] [Google Scholar]
- 14.Frith MC, Li MC, Weng Z. Cluster-Buster: finding dense clusters of motifs in DNA sequences. Nucleic Acids Res. 2003;31:3666–3668. doi: 10.1093/nar/gkg540. [DOI] [PMC free article] [PubMed] [Google Scholar]
- 15.Loots GG, Ovcharenko I. rVISTA 2.0: evolutionary analysis of transcription factor binding sites. Nucleic Acids Res. 2004;32:W217–W221. doi: 10.1093/nar/gkh383. [DOI] [PMC free article] [PubMed] [Google Scholar]
- 16.Moses AM, Chiang DY, Eisen MB. Phylogenetic motif detection by expectation-maximization on evolutionary mixtures. Proceedings of Pacific Symposium on Biocomputing; 2004. pp. 324–335. [DOI] [PubMed] [Google Scholar]
- 17.Chen Y, Blackwell TW, Chen J, Gao J, Lee AW, States DJ. Integration of genome and chromatin structure with gene expression profiles to predict c-MYC recognition site binding and function. PLoS Comput. Biol. 2007;3:e63. doi: 10.1371/journal.pcbi.0030063. [DOI] [PMC free article] [PubMed] [Google Scholar]
- 18.Narlikar L, Gordan R, Hartemink AJ. A nucleosome-guided map of transcription factor binding sites in yeast. PLoS Comput. Biol. 2007;3:e215. doi: 10.1371/journal.pcbi.0030215. [DOI] [PMC free article] [PubMed] [Google Scholar]
- 19.Siepel A, Bejerano G, Pedersen J, Hinrichs A, Hou M, Rosenbloom K, Clawson H, Spieth J, Hillier L, Richards S, et al. Evolutionarily conserved elements in vertebrate, insect, worm, and yeast genomes. Genome Res. 2005;15:1034–1050. doi: 10.1101/gr.3715005. [DOI] [PMC free article] [PubMed] [Google Scholar]
- 20.Hsu F, Kent WJ, Clawson H, Kuhn RM, Diekhans M, Haussler D. The UCSC known genes. Bioinformatics. 2006;22:1036–1046. doi: 10.1093/bioinformatics/btl048. [DOI] [PubMed] [Google Scholar]
- 21.Kawaji H, Kasukawa T, Fukuda S, Katayama S, Kai C, Kawai J, Carninci P, Hayashizaki Y. CAGE Basic/Analysis Databases: the CAGE resource for comprehensive promoter analysis. Nucleic Acids Res. 2006;34:D632–D636. doi: 10.1093/nar/gkj034. [DOI] [PMC free article] [PubMed] [Google Scholar]
- 22.Schones DE, Zhao K. Genome-wide approaches to studying chromatin modifications. Nat. Rev. Genet. 2008;9:179–191. doi: 10.1038/nrg2270. [DOI] [PMC free article] [PubMed] [Google Scholar]
- 23.Jiang J, Chan Y-S, Loh Y-H, Cai J, Tong G-Q, Lim C-A, Robson P, Zhong S, Ng H-H. A core Klf circuitry regulates self-renewal of embryonic stem cells. Nat. Cell Biol. 2008;10:353–360. doi: 10.1038/ncb1698. [DOI] [PubMed] [Google Scholar]
- 24.Odom DT, Dowell RD, Jacobsen ES, Gordon W, Danford TW, Macisaac KD, Rolfe PA, Conboy CM, Gifford DK, Fraenkel E. Tissue-specific transcriptional regulation has diverged significantly between human and mouse. Nat. Genet. 2007;39:730–732. doi: 10.1038/ng2047. [DOI] [PMC free article] [PubMed] [Google Scholar]
- 25.Boyer LA, Lee TI, Cole MF, Johnstone SE, Levine SS, Zucker JR, Guenther MG, Kumar RM, Murray HL, Jenner RG, et al. Core transcriptional regulatory circuitry in human embryonic stem cells. Cell. 2005;122:947–956. doi: 10.1016/j.cell.2005.08.020. [DOI] [PMC free article] [PubMed] [Google Scholar]
- 26.Bailey TL, Gribskov M. Methods and statistics for combining motif match scores. J. Comput. Biol. 1998;5:211–221. doi: 10.1089/cmb.1998.5.211. [DOI] [PubMed] [Google Scholar]
- 27.Chen X, Xu H, Yuan P, Fang F, Huss M, Vega VB, Wong E, Orlov YL, Zhang W, Jiang J, et al. Integration of external signaling pathways with the core transcriptional network in embryonic stem cells. Cell. 2008;133:1106–1117. doi: 10.1016/j.cell.2008.04.043. [DOI] [PubMed] [Google Scholar]
- 28.Cawley S, Bekiranov S, Ng HH, Kapranov P, Sekinger EA, Kampa D, Piccolboni A, Sementchenko V, Cheng J, Williams AJ, et al. Unbiased mapping of transcription factor binding sites along human chromosomes 21 and 22 points to widespread regulation of noncoding RNAs. Cell. 2004;116:499–509. doi: 10.1016/s0092-8674(04)00127-8. [DOI] [PubMed] [Google Scholar]
- 29.Kheradpour P, Stark A, Roy S, Kellis M. Reliable prediction of regulator targets using 12 Drosophila genomes. Genome Res. 2007;17:1919–1931. doi: 10.1101/gr.7090407. [DOI] [PMC free article] [PubMed] [Google Scholar]
- 30.Storey JD, Tibshirani R. Statistical significance for genomewide studies. Proc. Natl Acad. Sci. USA. 2003;100:9440–9445. doi: 10.1073/pnas.1530509100. [DOI] [PMC free article] [PubMed] [Google Scholar]
- 31.Loh YH, Wu Q, Chew JL, Vega VB, Zhang WW, Chen X, Bourque G, George J, Leong B, Liu J, et al. The Oct4 and Nanog transcription network regulates pluripotency in mouse embryonic stem cells. Nat. Genet. 2006;38:431–440. doi: 10.1038/ng1760. [DOI] [PubMed] [Google Scholar]
- 32.Ji HK, Vokes SA, Wong WH. A comparative analysis of genome-wide chromatin immunoprecipitation data for mammalian transcription factors. Nucleic Acids Res. 2006;34:e146. doi: 10.1093/nar/gkl803. [DOI] [PMC free article] [PubMed] [Google Scholar]
- 33.Schneider TD, Stephens RM. Sequence logos: a new way to display consensus sequences. Nucleic Acids Res. 1990;18:6097–6100. doi: 10.1093/nar/18.20.6097. [DOI] [PMC free article] [PubMed] [Google Scholar]
- 34.Lenhard B, Sandelin A, Mendoza L, Engstrm P, Jareborg N, Wasserman WW. Identification of conserved regulatory elements by comparative genome analysis. J. Biol. 2003;2:13. doi: 10.1186/1475-4924-2-13. [DOI] [PMC free article] [PubMed] [Google Scholar]
- 35.Moses AM, Chiang DY, Pollard DA, Iyer VN, Eisen MB. MONKEY: identifying conserved transcription-factor binding sites in multiple alignments using a binding site-specific evolutionary model. Genome Biol. 2004;5:R98. doi: 10.1186/gb-2004-5-12-r98. [DOI] [PMC free article] [PubMed] [Google Scholar]
- 36.Takahashi K, Tanabe K, Ohnuki M, Narita M, Ichisaka T, Tomoda K, Yamanaka S. Induction of pluripotent stem cells from adult human fibroblasts by defined factors. Cell. 2007;131:861–872. doi: 10.1016/j.cell.2007.11.019. [DOI] [PubMed] [Google Scholar]
- 37.Segre JA, Bauer C, Fuchs E. Klf4 is a transcription factor required for establishing the barrier function of the skin. Nat. Genet. 1999;22:356–360. doi: 10.1038/11926. [DOI] [PubMed] [Google Scholar]
- 38.Shiraki T, Kondo S, Katayama S, Waki K, Kasukawa T, Kawaji H, Kodzius R, Watahiki A, Nakamura M, Arakawa T, et al. Cap analysis gene expression for high-throughput analysis of transcriptional starting point and identification of promoter usage. Proc. Natl Acad. Sci. USA. 2003;100:15776–15781. doi: 10.1073/pnas.2136655100. [DOI] [PMC free article] [PubMed] [Google Scholar]
- 39.Sharov AA, Dudekula DB, Ko MSH. Genome-wide assembly and analysis of alternative transcripts in mouse. Genome Res. 2005;15:748–754. doi: 10.1101/gr.3269805. [DOI] [PMC free article] [PubMed] [Google Scholar]
- 40.Kim TH, Abdullaev ZK, Smith AD, Ching KA, Loukinov DI, Green RD, Zhang MQ, Lobanenkov VV, Ren B. Analysis of the vertebrate insulator protein ctcf-binding sites in the human genome. Cell. 2007;128:1231–1245. doi: 10.1016/j.cell.2006.12.048. [DOI] [PMC free article] [PubMed] [Google Scholar]
Associated Data
This section collects any data citations, data availability statements, or supplementary materials included in this article.