

Abstract

We introduce a family of protein nanoparticles capable of sensing analytes in conjunction with magnetic resonance imaging (MRI). The new sensors are derived from the iron storage protein ferritin (Ft); they are designed and optimized using facile protein engineering methods, and self-assembled in cells harboring specific combinations of DNA coding sequences. As illustration, we show that suitably constructed Ft-based sensors can report activity of the important neural signaling enzyme protein kinase A (PKA). Phosphorylation of the engineered Ft-based nanoparticles by PKA promotes clustering and changes in T2-weighted MRI signal.
Magnetic resonance imaging (MRI) is a unique tool for analyzing biological specimens because it can be applied noninvasively, in living organisms, at high spatial and temporal resolution.1 The range of phenomena accessible to evaluation by MRI is limited, however, by a lack of molecular imaging agents capable of dynamically sensing specific physiological events. Most MRI sensors have incorporated synthetic contrast-generating moieties in complex structures or supramolecular assemblies2,3 that are often difficult to design, produce, and deliver in vivo. Here we introduce a family of completely protein-based nanoparticle MRI sensors that addresses these limitations. The new sensors are derived from the iron storage protein ferritin (Ft); they are designed and optimized using facile protein engineering methods, and self-assembled in cells harboring specific combinations of DNA coding sequences. As illustration, we show that suitably constructed Ft-based nanoparticle sensors can report the activity of the important neural signaling enzyme protein kinase A (PKA).
Eukaryotic Ft is a naturally-occurring nanoparticle, formed by random mixtures of two polypeptides, the Ft light chain (LF) and heavy chain (HF). 24 LF or HF subunits together assemble into an approximately spherical protein shell of 12 nm outer diameter and 8 nm inner diameter. In cells, the cavity contains an antiferromagnetic iron oxide core including up to 4,000 iron atoms.4 Iron-loaded Ft induces T2 relaxation in MRI, and has been identified as an endogenous source of anatomical contrast and an exogenous marker of gene expression.5-7 Aggregation of Ft after proteolysis8 or chemical cross-linking9 has been shown to enhance its T2 contrast, suggesting that Ft-based probes could in principle be designed along the lines of existing synthetic iron oxide (SPIO) nanoparticle-based sensors.10-12 These synthetic reagents are produced by functionalizing SPIOs with moieties (often polypeptides) that promote or reverse clustering of nanoparticles in the presence of target analyte, in turn altering T2 contrast in MRI. Ft conjugates analogous to functionalized SPIOs can be formed by genetic fusion of protein domains to the N-termini of HF or LF, which are exposed at the outer surface of Ft nanoparticles.13
We chose to base protein MRI sensors on Ft because of its ability to produce aggregation-dependent contrast changes, and its accessibility to surface modification by molecular biology. As our target for sensing we selected cyclic AMP-dependent protein kinase A (PKA), an enzyme critical to memory formation in the brain, and an active target of pharmaceutical development.14 A key substrate of PKA is the transcription factor CREB.15 When the residue Ser133 of the kinase inducible domain (KID) of CREB is phosphorylated by PKA, CREB binds to the KIX domain of the activator protein CBP,16,17 turning on transcription of CREB-dependent genes.18 Phosphorylation-dependent binding of KID and KIX has been studied extensively, and fluorescent sensors of PKA activity have been made by fusing these domains to variants of green fluorescent protein19 or β-lactamase fragments.20 No MRI or other non-invasive sensor of PKA activity has been reported. We therefore constructed a protein-based MRI sensor for PKA activity by producing Ft nanoparticles that incorporated KID or KIX functional groups on their surface (Figure 1a).
Figure 1.

Ft nanoparticle sensors self-assemble and aggregate in response to PKA activity. (a) Schematic of Ft-based PKA sensor production and mechanism. Genes encoding Ft variants (left; N-terminal fusion constructs diagrammed with color coding) are premixed and co-transfected into cells, where proteins are expressed and spontaneously assembled into Ft nanoparticles (FtNs). KID-FtNs and KIX-FtNs contain KID-LF (blue) or KIX-LF (orange), respectively, as well as FLAG-LF (green), LF (light grey), and HF (dark grey); in each case, co-expressed Ft chains assemble into heterooligomers of 24 subunits, and may be purified by FLAG affinity chromatography. KID-LF chains are phosphorylated by PKA to form pKID-LF. Modified KID-FtNs (pKID-FtNs) containing pKID-LF form supramolecular aggregates with KIX-FtNs (right), and consequently alter MRI contrast. (b) Coomassie-stained SDS-PAGE gels showing the composition of FLAG-purified KID-FtN and KIX-FtN particles, produced by cells transfected with mixtures containing either 60% or 40% plasmids encoding KID-FtN or KIX-FtN. Subunit stoichiometry is reflected by the density of bands in the gel; expected molecular weights are 33.6 kD (KIX-LF), 29 kD (KID-LF), 23.5 kD (FLAG-LF), and 20 kD (HF and LF). (c) Dynamic light scattering (DLS) measurements of relative radius for 3:2 mixtures of KID-FtNs and KIX-FtNs incubated for 3.5 hours under the conditions indicated. (1) KIX-FtNs and unphosphorylated KID-FtNs; (2) KIX-FtNs and pre-phosphorylated pKID-FtNs; (3) unphosphorylated sensor with 12.7 units PKA per pmol Ft and 1 mM ATP; (4) unphosphorylated sensor with ATP only; (5) unphosphorylated sensor with PKA, ATP and 100 μM PKA inhibitor; (6) pre-phosphorylated sensor with 1026 units λPPase per pmol Ft. Each bar reflects mean ± s.e.m. of multiple measurements (n = 3), and radii are normalized to sample (1). Inset: mass-weighted absolute size distributions of sensor particles under conditions (1) and (2). (d) SDS-PAGE gel stained for phosphoproteins (ProQ, top) or all proteins (Coom, bottom). Lanes correspond to conditions (1)-(6) in (c). In the top gel, bands shown correspond to the known mobility of KID-LF; in the bottom gel, KIX-LF and KID-LF bands are both visible, with KIX-LF migrating at slightly higher weight than KID-LF.
Fusions of KID, KIX, and the affinity tag FLAG were made at the N-terminus of LF (KID-LF, KIX-LF and FLAG-LF, respectively). We included FLAG both as a purification tag for our in vitro experiments, and because we anticipated that its relative bulk and hydrophilicity would help stabilize Ft nanoparticle constructs (see Supporting Information). Plasmids encoding wild-type LF and HF, the FLAG-LF construct, and either the KID-LF or KIX-LF construct were premixed in specific ratios and co-transfected into HEK-293 cells (Figure 1a). After four days of expression, cells were lysed and Ft nanoparticles (FtNs) were purified over an anti-FLAG resin. An enzyme-linked immunosorbant assay was used to quantify Ft expression, and indicated that Ft variants accounted for 1-2% of the total protein content of transfected cells; toxicity to transfected cells was not observed. Ft fusion proteins were iron-loaded by incubation of lysates with an excess of ferrous ammonium sulfate. Self-assembly of different co-transfected subunits was confirmed by the presence of corresponding bands on Coomassie-stained gels after FLAG purification (Figure 1b). The distribution of functional group compositions present among purified nanoparticles could be controlled by varying the transfection ratios of recombinant Ft genes. Iron cores formed in the recombinant nanoparticles were similar in size to those of purified horse spleen Ft (see Supporting Information), indicating that the addition of functional groups did not significantly interfere with iron storage functionality. Recombinant FtNs were loaded on average with 1101 ± 86 iron atoms per particle.
KID-functionalized Ft nanoparticles (denoted KID-FtNs) could be phosphorylated by PKA and dephosphorylated by lambda protein phosphatase (λPPase). Incubation of pre-phosphorylated KID-FtNs (pKID-FtNs) with KIX-expressing Ft nanoparticles (KIX-FtNs) at a 3:2 ratio induced the formation of aggregates, as observed by dynamic light scattering (DLS). These aggregates showed 4.5-fold larger radii than that observed when KIX-FtNs were mixed with unphosphorylated KID-FtNs (Figure 1c). Adding PKA to a mixture of KID-FtNs and KIX-FtNs resulted in a similar level of aggregation. PKA-induced aggregation could be prevented by adding a PKA inhibitor. Adding λPPase to a mixture of pKID-FtNs and KIX-FtNs also resulted in smaller aggregate sizes. Changes in KID-LF phosphorylation under these conditions were confirmed with subsequent SDS-PAGE and phosphoprotein staining (Figure 1d).
Non-invasive sensing of PKA activity was performed in a 4.7 T MRI magnet using a spin-echo acquisition sequence. Incubation of the sensor (3:2 ratio of KID-FtNs with KIX-FtNs) with PKA for two hours roughly doubled the transverse relaxivity (r2, the slope of T2 relaxation rate vs. nanoparticle concentration), producing a change from 2120 ± 230 mM- 1s- 1 to 3900 ± 100 mM- 1s- 1 (Figure 2). Given our FtN concentration of 250 nM, and at an echo time (TE) of 210 ms, this corresponded to a 10.7 ± 1.3% change in MRI signal intensity. PKA-dependent r2 changes could be prevented by adding a PKA inhibitor (Figure 2a). Incubation of pre-phosphorylated sensors with λPPase also resulted in low relaxivity (1960 ± 420 mM- 1s- 1), compared with prephosphorylated sensors themselves (3810 ± 380 mM- 1s- 1). Dynamical MRI measurements enabled real-time monitoring of PKA activity, with more pronounced increases in r2 occurring in the presence of higher concentrations of PKA (Figure 2b). Levels of PKA tested here were comparable to kinase concentrations estimated from lysates of cells treated with the PKA activator forskolin.21 The response rates we observed are appropriate for sensing kinase activity in brain, where elevated KID phosphorylation has been shown to persist over periods longer than an hour following induction of long term potentiation,22 chemically-evoked seizure,23 or stimulation with nerve growth factor.24
Figure 2.
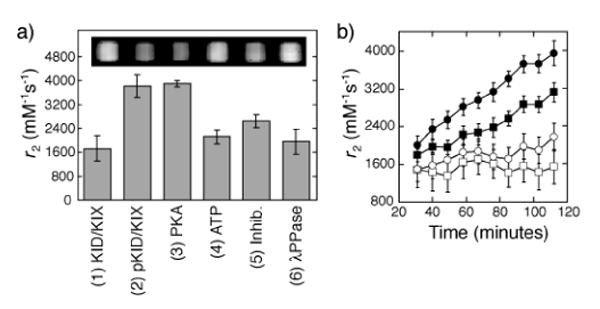
Sensors enhance T2 relaxation in MRI in response to PKA activity. (a) Measurements of the transverse relaxivity (r2) after 2 hours of sensor incubation under the conditions listed in Figure 1c. For each condition, r2 was calculated by subtracting from 1/T2 the relaxation rate of sensor-free control assay buffer containing equivalent concentrations of all additives except the Ft species. Insert: T2-weighted MRI image (TE/TR = 210/4000 ms) of wells containing samples corresponding to conditions (1)-(6) in Figure 1c. (b) Time course of MRI relaxation enhancement for sensor incubated with 1 mM ATP and 460 (filled circles), 230 (filled squares), 115 (open circles) or 0 (open squares) units of PKA. The horizontal axis indicates time after addition of PKA to each sample (n = 3 for all data points).
Effective performance of the MRI PKA sensor depended on the average number of functional groups displayed on the nanoparticle surfaces and on the ratio of KID-FtNs to KIX-FtNs in the sensor mixture. When the proportion of KID-LF or KIX-LF plasmid transfected, as a percentage of total transfected DNA, was changed from 60% to 40%, 20%, or 0% (decreases from 60% were compensated by an equal increase in LF), phosphorylation-dependent effects on r2 were diminished or abolished (Figure 3a). Basal clustering of unphosphorylated sensors was also reduced with decreasing KID/KIX functionalization level. For particles resulting from optimized transfection compositions, the stoichiometric ratio of pKID-FtNs to KIX-FtNs in the sensor mixture (D:X) influenced the aggregation time course (Figure 3b). Although sensors formed with low D:X ratios (≤ 1:1) produced the greatest maximal MRI signal change in the phosphorylated condition, they also showed continuing aggregation over time, resulting ultimately in visible precipitation, and leading to loss of relaxivity as predicted by modeling studies.25 By comparison, high D:X ratios (≥ 3:1) resulted in little phosphorylation-dependent contrast at all. The intermediate D:X ratio of 3:2, used for data presented in Figures 1 and 2, showed the greatest phosphorylation-dependent MRI signal difference on a 1-2 hour timescale.
Figure 3.

Sensor performance depends on level of functionalization and ratio of partner particles. (a) Relaxivities (left) and relative aggregate sizes (right) of 1:1 mixtures of KID-FtNs and KIX-FtNs expressed with various levels of functional group DNA, as described in the text. Unphosphorylated sensors (white) and pre-phosphorylated sensors (gray) were tested at each level of functionalization. (b) Time courses of transverse relaxation rates when 60% functionalized pKID-FtNs and KIX-FtNs are mixed at different KID-NP:KIX-NP ratios. The D:X ratios shown are 2:3 (filled squares), 1:1 (filled circles), 3:2 (open squares) and 3:1 (open circles). For all data points n = 2.
Our results represent the first in vitro proof of concept for a completely protein-based MRI sensor incorporating Ft, and suggest a general approach to creating further sensors through genetically directed self-assembly of multifunctional protein nanoparticles. Design considerations affecting sensor expression and performance included surface hydrophilicity, functionalization level, and the ratio of interacting species. We demonstrated that some of these parameters could be regulated by manipulating transfection ratios of various DNA constructs, and showed that multiple N-terminally fused domains (KID, KIX, and FLAG) each independently conferred corresponding activity on resulting Ft nanoparticles. Mixtures of KID-FtNs and KIX-FtNs responded to PKA activity with 84% change in relaxivity, and failed to respond in the presence of phosphatase or kinase inhibition. Our application of classical protein engineering methods to design of the PKA sensor, and our ability to synthesize intact self-assembled sensor nanoparticles through straightforward expression in mammalian cells, highlight two significant advantages of the protein-based approach to MRI sensor development. Future in vivo applications of this or similar sensors may demonstrate a third potential advantage: ability to deliver sensors to cells or tissues either as exogenously purified molecules (possibly containing more potent core materials26), or as gene constructs to be expressed endogenously in target cells. Previous studies in cells and animals have demonstrated that wild type Ft can be expressed at levels detectable by MRI, suggesting that the Ft relaxivity changes we report here should also be detectable in vivo. Ft-based kinase sensors may also be useful for MRI-based in vitro assays of enzymatic activity, where they would have performance characteristics similar to fluorescent probes27 and unique capability in opaque samples.
Supplementary Material
Acknowledgments
The authors thank Michael Greenberg for supplying clones for CREB and CBP, and thank Paolo Arioso for providing the human HF and LF genes. The authors are also grateful to Niyatee Samudra for assistance with DNA cloning and Vibhu Sachdev for help obtaining TEM images. MGS wishes to acknowledge the Fannie and John Hertz Foundation and the Paul and Daisy Soros Fellowship for generous support. This work was funded in part by a New Innovator Award NIH DP2-OD2441 to AJ, and NIH grant number R01-DE013023-08 to RL.
Footnotes
Supporting Information Available: Experimental details, protein sequences, and additional data and discussion concerning TEM analysis and choice of purification moieties. This material is available free of charge via the internet at http://pubs.acs.org.
References
- 1.Dickerson BC. Neurotherapeutics. 2007;4:360–370. doi: 10.1016/j.nurt.2007.05.007. [DOI] [PMC free article] [PubMed] [Google Scholar]
- 2.Jasanoff A. Curr Opin Neurobiol. 2007;17:593–600. doi: 10.1016/j.conb.2007.11.002. [DOI] [PMC free article] [PubMed] [Google Scholar]
- 3.Shapiro MG, Atanasijevic T, Faas H, Westmeyer GG, Jasanoff A. Magn Reson Imaging. 2006;24:449–462. doi: 10.1016/j.mri.2005.12.033. [DOI] [PubMed] [Google Scholar]
- 4.Harrison PM, Arosio P. Biochim Biophys Acta. 1996;1275:161–203. doi: 10.1016/0005-2728(96)00022-9. [DOI] [PubMed] [Google Scholar]
- 5.Genove G, DeMarco U, Xu H, Goins WF, Ahrens ET. Nat Med. 2005;11:450–454. doi: 10.1038/nm1208. [DOI] [PubMed] [Google Scholar]
- 6.Cohen B, Dafni H, Meir G, Harmelin A, Neeman M. Neoplasia. 2005;7:109–117. doi: 10.1593/neo.04436. [DOI] [PMC free article] [PubMed] [Google Scholar]
- 7.Cohen B, Ziv K, Plaks V, Israely T, Kalchenko V, Harmelin A, Benjamin LE, Neeman M. Nat Med. 2007;13:498–503. doi: 10.1038/nm1497. [DOI] [PubMed] [Google Scholar]
- 8.Gossuin Y, Gillis P, Muller RN, Hocq A. NMR Biomed. 2007;20:749–756. doi: 10.1002/nbm.1140. [DOI] [PubMed] [Google Scholar]
- 9.Bennett KM, Shapiro EM, Sotak CH, Koretsky AP. Biophys J. 2008;95:342–351. doi: 10.1529/biophysj.107.116145. [DOI] [PMC free article] [PubMed] [Google Scholar]
- 10.Perez JM, Josephson L, O'Loughlin T, Hogemann D, Weissleder R. Nat Biotechnol. 2002;20:816–820. doi: 10.1038/nbt720. [DOI] [PubMed] [Google Scholar]
- 11.Atanasijevic T, Shusteff M, Fam P, Jasanoff A. Proc Natl Acad Sci U S A. 2006;103:14707–14712. doi: 10.1073/pnas.0606749103. [DOI] [PMC free article] [PubMed] [Google Scholar]
- 12.Kim GY, Josephson L, Langer R, Cima MJ. Bioconjug Chem. 2007;18:2024–2028. doi: 10.1021/bc070110w. [DOI] [PubMed] [Google Scholar]
- 13.Uchida M, Flenniken ML, Allen M, Willits DA, Crowley BE, Brumfield S, Willis AF, Jackiw L, Jutila M, Young MJ, Douglas T. J Am Chem Soc. 2006;128:16626–16633. doi: 10.1021/ja0655690. [DOI] [PubMed] [Google Scholar]
- 14.Arnsten AF, Ramos BP, Birnbaum SG, Taylor JR. Trends Mol Med. 2005;11:121–128. doi: 10.1016/j.molmed.2005.01.006. [DOI] [PubMed] [Google Scholar]
- 15.Carlezon WA, Jr, Duman RS, Nestler EJ. Trends Neurosci. 2005;28:436–445. doi: 10.1016/j.tins.2005.06.005. [DOI] [PubMed] [Google Scholar]
- 16.Parker D, Ferreri K, Nakajima T, LaMorte VJ, Evans R, Koerber SC, Hoeger C, Montminy MR. Mol Cell Biol. 1996;16:694–703. doi: 10.1128/mcb.16.2.694. [DOI] [PMC free article] [PubMed] [Google Scholar]
- 17.Chrivia JC, Kwok RP, Lamb N, Hagiwara M, Montminy MR, Goodman RH. Nature. 1993;365:855–859. doi: 10.1038/365855a0. [DOI] [PubMed] [Google Scholar]
- 18.Kwok RP, Lundblad JR, Chrivia JC, Richards JP, Bachinger HP, Brennan RG, Roberts SG, Green MR, Goodman RH. Nature. 1994;370:223–226. doi: 10.1038/370223a0. [DOI] [PubMed] [Google Scholar]
- 19.Nagai Y, Miyazaki M, Aoki R, Zama T, Inouye S, Hirose K, Iino M, Hagiwara M. Nat Biotechnol. 2000;18:313–316. doi: 10.1038/73767. [DOI] [PubMed] [Google Scholar]
- 20.Spotts JM, Dolmetsch RE, Greenberg ME. Proc Natl Acad Sci U S A. 2002;99:15142–15147. doi: 10.1073/pnas.232565699. [DOI] [PMC free article] [PubMed] [Google Scholar]
- 21.Shults MD, Janes KA, Lauffenburger DA, Imperiali B. Nat Methods. 2005;2:277–283. doi: 10.1038/nmeth747. [DOI] [PubMed] [Google Scholar]
- 22.Schulz S, Siemer H, Krug M, Hollt V. J Neurosci. 1999;19:5683–5692. doi: 10.1523/JNEUROSCI.19-13-05683.1999. [DOI] [PMC free article] [PubMed] [Google Scholar]
- 23.Moore JL, Gorshkova II, Brown JW, McKenney KH, Schwarz FP. J Biol Chem. 1996;271:21273–21278. doi: 10.1074/jbc.271.35.21273. [DOI] [PubMed] [Google Scholar]
- 24.Bonni A, Ginty DD, Dudek H, Greenberg ME. Mol Cell Neurosci. 1995;6:168–183. doi: 10.1006/mcne.1995.1015. [DOI] [PubMed] [Google Scholar]
- 25.Matsumoto Y, Jasanoff A. Magn Reson Imaging. 2008;26:994–998. doi: 10.1016/j.mri.2008.01.039. [DOI] [PubMed] [Google Scholar]
- 26.Meldrum FC, Heywood BR, Mann S. Science. 1992;257:522–523. doi: 10.1126/science.1636086. [DOI] [PubMed] [Google Scholar]
- 27.Rothman DM, Shults MD, Imperiali B. Trends Cell Biol. 2005;15:502–510. doi: 10.1016/j.tcb.2005.07.003. [DOI] [PubMed] [Google Scholar]
Associated Data
This section collects any data citations, data availability statements, or supplementary materials included in this article.