

Abstract
Detectors with depth-encoding allow a PET scanner to simultaneously achieve high sensitivity and high spatial resolution.
Methods
A prototype PET scanner, consisting of depth-encoding detectors constructed by dual-ended readout of lutetium oxyorthosilicate (LSO) arrays with two position sensitive avalanche photodiodes (PSAPDs), was developed. The scanner consisted of two detector plates, each with 4 detector modules. The LSO arrays consisted of 7×7 elements, with a crystal size of 0.9225×0.9225×20 mm3 with a pitch of 1.0 mm. The active area of the PSAPDs was 8×8 mm2. The performance of individual detector modules was characterized. A line source phantom and a hot rod phantom were imaged on the prototype scanner in two different scanner configurations. The images were reconstructed using 20, 10, 5, 2 and 1 DOI bins to demonstrate the effects of DOI resolution on reconstructed image resolution and visual image quality.
Results
The flood histograms measured from the sum of both PSAPD signals were only weakly depth-dependent and excellent crystal identification was obtained at all depths. The flood histograms improved as the detector temperature decreased. DOI resolution and energy resolution improved significantly as the temperature decreased from 20 °C to 10 °C, but only slightly with a subsequent temperature decrease to 0 °C. A full-width at half-maximum (FWHM) DOI resolution of 2 mm and an FWHM energy resolution of 15% were obtained at a temperature of 10 °C. Phantom studies showed that DOI measurements significantly improved the reconstructed image resolution. In the first scanner configuration (parallel detector planes) the image resolution at the center of field of view (CFOV) was 0.9 mm FWHM with 20 DOI bins and 1.6 mm with one DOI bin. In the second scanner configuration (detector planes at a 40° angle) the image resolution at the CFOV was 1.0 mm FWHM with 20 DOI bins and was not measurable when using only one bin.
Conclusions
PET scanners based on this detector design offer the prospect of high and uniform spatial resolution (crystal size ~1 mm, DOI resolution ~ 2 mm), high sensitivity (20 mm thick detectors), and compact size (DOI encoding permits detectors to be tightly packed around the subject and minimizes number of detectors needed).
Keywords: Small animal PET, depth of interaction, position-sensitive avalanche photodiode, instrumentation
Over the past decade, many small animal PET scanners have been developed (1–12), and this technology has played a very important role in the rapidly growing field of molecular imaging. High sensitivity is needed to increase signal to noise ratio of the images in order to reliably detect lower levels of radiotracer uptake and to reduce the injected dose (reducing radiation dose to the subject) (13) and scan time (increasing temporal resolution for dynamic studies). High spatial resolution is required to detect small structures and lesions and to improve quantification by reducing the partial volume effect. A compromise between sensitivity and spatial resolution always exists in small animal PET scanner design due to depth of interaction (DOI) effects. Most designs use a large detector ring radius (relative to the subject to be studied) and/or a short crystal length in order to reduce the DOI effects to acceptable levels. But in both cases the sensitivity of the scanner is sacrificed.
For this reason, much attention in recent years has focused on detector designs with depth-encoding ability. Multi-layer detectors consisting of crystal layers with different scintillation light decay times (14–16), with different reflector arrangements (17, 18), and using a position shift of half a crystal for different layers (19), have been proposed and successfully implemented to measure DOI. The DOI resolution obtained by these methods is limited by the number of layers that can be decoded, and is typically on the order of 5–10 mm. As a rule of thumb, to eliminate the DOI effect completely, the DOI resolution needs to be on the order of the detector width itself. For small animal PET, the detector widths are typically 0.5–2 mm (8, 10, 20, 21). Therefore, although these designs help reduce DOI-related degradation of spatial resolution, they are still not good enough to allow detectors to be placed in very close proximity to the subject. Thus the classic trade-off between resolution and sensitivity remains, with scanners utilizing thinner detectors and larger ring diameters than desirable. The larger ring diameter also has the undesirable effect of increasing the cost per unit sensitivity.
It is therefore important to develop detectors for small animal PET imaging with DOI resolution that approaches the detector width. A promising approach for obtaining higher DOI resolution is to read out the scintillation light by placing photodetectors at both ends of the crystal array and use the ratio of the two photodetector signals to measure the DOI (22–26). An alternative approach being used to estimate DOI for monolithic scintillator crystals measures the distribution of the scintillation light signal on a position-sensitive photodetector arrays (27, 28). In this case events occurring nearer the photodetector produce a narrower spread of scintillation light on the detectors than events occurring far from the photodetector, thus providing a basis for discriminating based on depth. Both of these approaches provide continuous DOI measurement rather than the discrete DOI information provided by the layered approach described earlier.
Our approach is to measure DOI by using dual-ended readout of finely pixelated lutetium oxyorthosilicate (LSO) arrays with two position sensitive avalanche photodiodes (PSAPDs) (29–31). Our previous results on individual detector modules have shown that with such a detector at room temperature, crystals arrays down to 1 mm could be resolved and that an energy resolution of about 15% FWHM and a uniform DOI resolution of 3–4 mm FWHM (including the radiation beam width of more than 2 mm) could be achieved (32). In this work the imaging performance of a prototype PET scanner consisting of eight detector modules arranged in two detector plates is evaluated. First, results obtained from individual detectors used within the scanner, including measurements of the flood histograms calculated by using the energy signals from just one PSAPD or both PSAPDs, the performance of the detectors at different temperatures, DOI resolution measured with a smaller radiation beam width of 0.7 mm, and the timing resolution of the PSAPD are presented. Secondly imaging studies are performed with the prototype scanner to measure the effect of the DOI information on reconstructed image resolution.
MATERIALS AND METHODS
The Prototype PET Scanner
A schematic view of the prototype PET scanner is shown in Figure 1. The scanner consists of two detector plates, each comprising 4 detector modules. The LSO arrays have 7×7 elements, with each crystal measuring 0.9225×0.9225×20 mm3 on a pitch of 1.0 mm. The inter-crystal reflector, Vikuiti™ enhanced specular reflector film (3M, St. Paul, MN), is 65 microns thick and is glued to the crystals. The LSO arrays were read out by two 8×8 mm2 PSAPDs placed at opposite ends of the array. Four detector modules and their preamplifier boards were mounted on a frame and the frame was fixed in a light-tight box. The black boxes were cooled by dry nitrogen gas passed through liquid nitrogen to obtain a stable temperature that could be varied from room temperature down to −20 °C. The temperature variation during a phantom scan was controlled to be less than ±1°C by monitoring the temperature of the detector boxes using T-type thermocouple probes and adjusting the flux of the nitrogen gas. Preamplifier boards were designed for the PSAPDs and utilized the CR-110 preamplifier (Cremat Inc., Watertown, MA).
FIGURE 1.
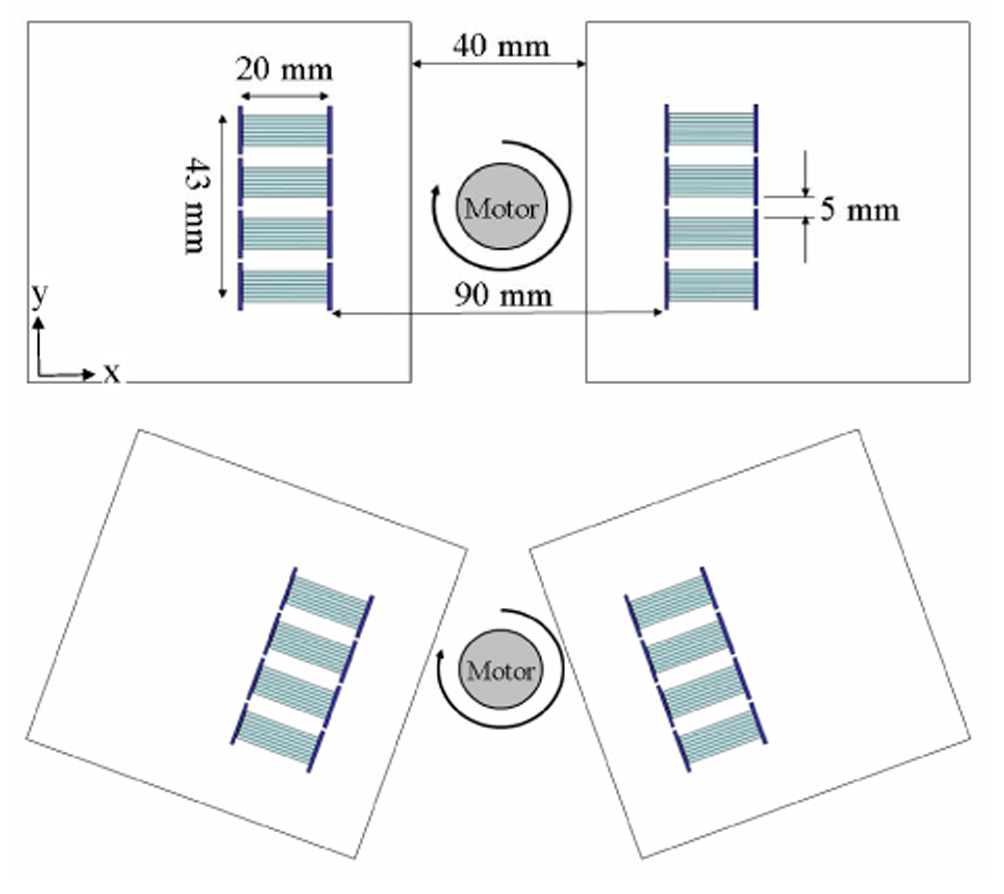
A schematic view of the prototype PET scanner. Top: configuration 1, bottom: configuration 2.
Commercially available timing filter amplifiers, constant fraction discriminators, coincidence modules, and spectroscopy amplifiers were used for this scanner. Multiplexer boards were designed to reduce the number of energy signals coming from each detector plate from 32 to 8 (33). Finally, the 16 position-encoding energy signals that define an event (4 signals per PSAPD, 2 PSAPDs per detector module, 2 detector modules per coincidence) along with digital signals encoding the coincidence detector pair identification were stored in the list mode data using a data acquisition system developed in our laboratory (34). For tomographic imaging studies, the two detector plates were held stationary and projection data were obtained by rotating the object (phantom) with a stepping motor (Model M061-LS-579, Superior Electric, Farmington, CT).
Individual Detector Module Measurements
A single detector module was mounted in the scanner black box and measured with the setup previously published (Reference (32), Figure 1). In singles mode, the detector module was uniformly radiated from one side by a 0.5 mm diameter point 22Na source, and in coincidence mode, one depth of the array was selectively radiated by electronic collimation with a LSO slab detector measuring 16×16×2 mm3. The slab detector was read out with a Hamamatsu R590 PMT. The measurements were performed at temperatures of 0, 10, and 20 °C with both the distance from the point source to the slab detector and the distance from the source to the LSO array of 5 cm. Based on the geometry the radiation beam width on the array was 2 mm. The temperature was measured in a location close to PSAPD 2. In order to minimize the contribution of radiation beam width to the DOI resolution, the measurements at 10°C were also performed with the distance from the point source to the slab detector measuring about four times that of the distance from the source to the LSO array. The radiation beam width estimated from the geometry was 0.7 mm in those measurements. This geometry was not used for all measurements, as data collection takes a long time for the more constrained geometry and only three rows of the crystals were irradiated. In all cases, coincidence measurements were performed at five irradiation depths of 2, 6, 10, 14, and 18 mm measured with respect to the location of PSAPD 1.
Flood Histograms and Energy Resolution
The x and y coordinates of the flood histograms for PSAPD 1, PSAPD 2 and the combination of the signal from both PSAPDs were calculated using the position-encoding energy signals of the two PSAPDs and the following equations:
Here A1, B1, C1, and D1 are the four position-encoding energy signals from PSAPD 1 and A2, B2, C2, and D2 are the four position-encoding energy signals of PSAPD 2. The origin of the PSAPD coordinate system was defined as the A corner. The B and C corners of the PSAPDs were defined to be in the positive x-direction, and the C and D corners were defined to be in the positive y direction. E1 and E2 are the total energy measured by PSAPD 1 and PSAPD 2 respectively, and are calculated from the following equations:
For dual-ended readout, the total detected energy (Etotal) was taken to be the sum of the energy measured by the two PSAPDs (Etotal= k×E1+ E2). k is a gain matching parameter. For each detector module, k is adjusted such that the DOI response of the whole array is centered at a DOI ratio (E2/ Etotal) of 0.5. Crystal look-up tables were created from the flood histograms calculated from the combination of the two PSAPD signals and used to obtain the energy spectrum (Etotal) for each individual crystal. The FWHM energy resolution of the 511 keV photopeak was calculated by using Gaussian fitting.
DOI Resolution
The parameter E2/ Etotal was used to represent the DOI. Histograms of the values of this ratio for individual crystals and for all crystals in an array were obtained from the coincidence measurements performed at each irradiation depth. The FWHM DOI resolution was calculated by using a Gaussian fitting of the DOI histograms. The FWHM DOI resolution was then calibrated to units of mm by using the relationship between the peak of the measured DOI ratio and the known irradiation depth information(32).
Timing Resolution
The timing resolution of the dual-ended readout detector module and the LSO slab detector was also measured at five irradiation depths of 2, 6, 10, 14 and 18 mm. The LSO array was a 5×5 unpolished array with a crystal size of 1.5×1.5×20 mm3. Standard NIM electronics were used for the timing resolution measurements (23, 35). The timing signal (the difference of the single PMT timing and the summed timing signal obtained from the two PSAPDs) was stored in list mode together with the position-encoding energy signals of the PSAPDs. By applying a crystal look-up table and individual crystal low energy thresholds (350 keV), the timing spectra of individual crystals at each irradiation depth were obtained. The FWHM timing resolution was calculated by Gaussian fitting of the timing distribution.
Phantom Imaging
A line source phantom and a hot rod phantom were imaged on the prototype scanner in two different scanner configurations. In the first configuration the two detector plates were opposite and parallel to each other as shown in top of Figure 1. In the second configuration (shown at bottom of Figure 1), one detector plate was rotated clockwise by 20 degrees and the other one was rotated counterclockwise by 20 degrees to simulate oblique angles of incidence that would be seen in a complete ring scanner. The geometric center of the four detector modules was fixed during the detector plate rotations. The line source phantom consisted of three needles of 100 µm inner diameter, 200 µm outside diameter and measuring 50 mm long. The radial offsets of the three needles were 0, 7.5 and 15 mm respectively. The hot rod phantom was the Ultra-Micro Hot Spot Phantom from Data Spectrum Corporation (Chapel Hill, NC 27516, USA). The rod diameters were 0.75, 1.0, 1.35, 1.70, 2.0 and 2.4 mm with a rod to rod distance of twice the rod diameter. The phantoms were rotated through 40 projection angles covering 180 degrees during the scans. The total number of counts in each projection were fixed during the scans. A plane source phantom measuring 48×20×5 mm3 was used for the detector normalization scan. Only one projection dataset with the plane source placed parallel to the y direction as defined in Figures 1 was obtained in each of the two scanner configurations. Detailed information of all six scans is listed in Table 1. All scans were performed with the temperature of the detector enclosures at ~ −5 °C. Crystal look-up tables for all eight detectors were generated from flood histograms obtained from the phantom scan data. In addition, linear DOI calibration parameters were obtained for all eight detectors from histograms of the DOI ratio measured during the phantom scans. A lower energy threshold of 250 keV was used in selecting the data. Data were sorted into 20, 10, 5, 2 and 1 (no DOI) DOI bins to demonstrate the effects of DOI “resolution” on image quality. List mode data were histogrammed into sinograms of 120 view angles over 180 degrees and 192 radial samples at 0.25-mm sampling distance. All events were assigned to the center of the corresponding DOI bin. Because of the fine sampling distance, there exist sinogram bins that do not receive enough counts, which can cause severe streaking artifacts if not handled properly. To solve this problem, we considered all the sinogram bins with less counts than 1/20th of the maximum counts in the normalization file as “poorly sampled.” For all phantom scans, the values of the poorly sampled sinogram bins were set to zero and later filled in by linear interpolation of neighboring non-zero bins after normalization. The value of the threshold in the experiments was 625, which corresponds to a maximum error of 4% in the normalization sinogram. The images were reconstructed by filtered backprojection with a Shepp-Logan filter, cut off at 1.0 and 0.5 of the Nyquist frequency, for the line source phantom and hot rod phantom respectively.
TABLE 1.
Starting activity, number of projection views and counts per projection for the phantom and normalization scans.
| Scans | Start activity (MBq) | # of projections | Counts/projection | |
|---|---|---|---|---|
| Scanner Configuration 1 | Line source phantom | 0.4 | 40 | 20,480 |
| Hot rod phantom | 9.8 | 40 | 315,392 | |
| Normalization phantom | 8.1 | 1 | 7,557,120 | |
| Scanner Configuration 2 | Line source phantom | 0.3 | 40 | 32,768 |
| Hot rod phantom | 8.1 | 40 | 327,680 | |
| Normalization phantom | 6.4 | 1 | 7,999,488 |
RESULTS
Flood Histograms
Figure 2 shows the flood histograms calculated by using the position-encoding energy signals from PSAPD 1, PSAPD 2 and the combination of both PSAPDs. The flood histograms obtained using just one PSAPD were strongly depth dependent. The flood histograms degraded and the dynamic range was reduced as the interaction point moved further from the PSAPD. The edge crystals could not be well resolved in the flood histogram of the whole array. Several different crystal look-up tables are required for crystal identification if the flood histograms of only one PSAPD are used. The combined flood histograms from the two PSAPDs were very good at all depths and no significant depth dependence of the flood histograms was observed. In the flood histogram of the whole array, all crystals could be clearly resolved. Therefore, flood histograms obtained using signals combined from both PSAPDs are used from this point forward.
FIGURE 2.

Flood histograms as a function of irradiation depth calculated by using position-encoding energy signals from PSAPD 1, PSAPD 2 and both PSAPDs.
Effect of Temperature on Detector Performance
Since a PSAPD is a semiconductor device, its noise decreases as the temperature decreases. Figure 3 shows the flood histograms, and Table 2 shows the energy and DOI resolution, measured at 0, 10 and 20 °C. The energy and DOI resolutions presented are the average across all depths and all crystals. The radiation beam width was 2 mm for the DOI resolution measurement. Qualitatively, the flood histograms are seen to improve as the temperature was decreased due to the reduction of the PSAPD noise. There were obvious improvements in energy and DOI resolution as the temperature was decreased from 20 to 10 °C but no significant improvements as the temperature was further decreased from 10 to 0 °C.
FIGURE 3.

Flood histograms of the whole array measured at three temperatures.
TABLE 2.
Average crystal energy resolution (FWHM) and DOI resolution (FWHM) measured at three different temperatures. The radiation beam width was 2 mm for the DOI measurements. The lower energy threshold was 350 keV.
| Temperature (°C) | 0 | 10 | 20 |
| Energy resolution (%) | 14.3 | 14.6 | 16.2 |
| DOI resolution (mm) | 3.16 | 3.16 | 3.68 |
DOI Resolution
In DOI measurements with a narrow (0.7 mm) radiation beam width, only the three middle rows of crystals were in coincidence with the slab detector. Figure 4 shows the average DOI resolution of the 21 crystals in the three middle rows at different depths obtained from the DOI profiles of individual crystals. The DOI resolution at middle of the array was worse than that at both ends. Table 3 shows the average DOI resolution obtained from the DOI profiles of individual crystals and the summed DOI profiles of all 21 crystals for events of different energies. The DOI resolution obtained from the summed profiles was degraded by less than 10%. These results suggest that it is not necessary to do DOI calibration for each individual crystal in an array. An average DOI resolution of about 2 mm FWHM was obtained. In agreement with our previous results (32), the DOI ratio was observed to vary in an approximately linear fashion with the irradiation depth (data not shown), allowing simple linear approaches to be used to calibrate the DOI ratio as a function of irradiation depth as described later.
FIGURE 4.

Dependence of DOI resolution (FWHM) on depth. The results are the average of all crystals and obtained from the DOI profiles of individual crystals.
TABLE 3.
Average DOI resolution (FWHM) over all crystals and depths for different energy windows. DOI resolution was obtained using (a) the DOI profiles measured for individual crystals or (b) the summed DOI profile from all crystals. The radiation beam width was 0.7 mm.
| (a) | (b) | |
|---|---|---|
| All events | 2.07 mm | 2.22 mm |
| E > 350 keV | 1.79 mm | 1.94 mm |
| E < 350 keV | 2.96 mm | 3.04 mm |
Timing Resolution
Figure 5 shows the timing spectra for three crystals at different locations within the LSO array and the whole detector module (all 25 crystals) measured at a depth of 10 mm from both PSAPDs. Table 4 summarizes the timing resolution measurement results. The average crystal timing resolution was 5.5 ns FWHM. A time shift was also observed for crystals at different locations in the array. The maximum time shift for signals from the center and corner crystals is as high as 12.5 ns. This position-dependent delay is caused by the resistive readout that is used by the PSAPDs to provide position information. The charge collection time was observed to be longer for crystals over the middle of the PSAPDs compared to those over the corner of the PSAPDs.
FIGURE 5.

Timing spectra of three different crystals and all 25 crystals in a 5×5 LSO array. Note that there is a time shift in the spectra with the largest difference being between a central crystal and a corner crystal.
TABLE 4.
Results of PSAPD timing resolution measurements. The timing resolution (FWHM) was measured between a single PMT and a dual-ended PSAPD detector. The LSO array was a 5×5 unpolished array with a crystal size of 1.5×1.5×20 mm3. The lower energy threshold was 350 keV.
| Depth (mm) | Average Single Crystal Timing Resolution (ns) | Maximum Time Shift Between Crystals (ns) | Timing Resolution of Whole Array (ns) |
|---|---|---|---|
| 2 | 5.6 | 11.4 | 9.1 |
| 6 | 5.6 | 9.8 | 8.3 |
| 10 | 5.5 | 9.2 | 8.0 |
| 14 | 5.3 | 11.0 | 8.7 |
| 18 | 5.3 | 12.5 | 9.6 |
The timing resolution of the whole detector module degraded to about 9 ns FWHM due to the position dependent time shift. The timing resolution of the whole array was slightly better for irradiation depths at the middle than for irradiation depths at either ends of the array. A coincidence timing window of 40 ns was used for the prototype scanner to ensure that events from all crystal pairs were captured, as our current electronics cannot support crystal by crystal time alignment.
Phantom Imaging
Figure 6 shows the flood histograms of all eight detectors in the prototype scanner obtained from one phantom scan. There was no difference observed in the flood histograms obtained from each detector for the six different phantom scans which were acquired over a time interval of several weeks. Crystal look-up tables for all detectors were created from the flood histograms obtained from the normalization phantom scan (scanner configuration 1) and applied to all other studies.
FIGURE 6.

Flood histograms and DOI responses of all eight detectors obtained from a phantom scan.
Figure 6 also shows the DOI response of all eight detectors obtained from the normalization phantom scan (scanner configuration 1). Because the detector is being irradiated from the front, there is an exponential fall off in the number of detected events from the front to the back of the detector. The measured DOI ratio at half of the maximum counts on the left and right hand side of the curves were treated as corresponding to irradiation depths of 0 and 20 mm respectively. DOI calibration parameters were then obtained from these DOI response curves simply by linear interpolation between the measured DOI ratio at the two ends. Events with calibrated depths less than 0 mm or greater than 20 mm were positioned at 0 mm and 20 mm respectively. Based on the results of the previous section, DOI calibrations were performed for each individual detector rather than for each individual crystal. For different phantom scans, slightly different DOI responses, which are mainly caused by temperature variations in the detector boxes, were observed for some detectors. The gain matching parameter k was adjusted whenever it was necessary. DOI calibration parameters obtained from the normalization scan of the first scanner configuration were used for all six scans.
Figure 7 shows the images of the line source phantom and hot rod phantom acquired with scanner configuration 1 (top of Figure 1) using 20, 10, 5, 2 and 1 DOI bins. Since the measured DOI resolution of the detectors is 2 mm FWHM, the five different DOI bins correspond to a DOI resolution of about 2, 3, 4, 10 and 20 mm. Table 5 shows the image resolution of the three line sources acquired with scanner configuration 1. The effects of DOI resolution on the reconstructed images are clearly observed. With a DOI resolution of about 2 mm FWHM, hot rods with a diameter of 0.75 mm were resolved. Without use of DOI information (1 DOI bin), rods with a diameter of 1.7 mm were barely resolved. Figure 7 also shows the images of the line source phantom and hot rod phantom acquired with scanner configuration 2 (bottom of Figure 1), in which the average obliquity of the LORs is increased. Only 2 of the 3 line sources in the line source phantom were filled with activity for this scan. Table 6 shows the image resolution of the two line sources acquired with scanner configuration 2. For scanner configuration 2, much bigger DOI effects were observed as expected. With a DOI resolution of 2 m FWHM, rods of 1 mm diameter were clearly resolved. Without DOI information, even the largest rods with a diameter of 2.4 mm diameter could not be resolved, because the effective detector size is about 6.8 mm.
FIGURE 7.

Images of the line source phantom and the hot rod phantom reconstructed with 20, 10, 5, 2 and 1 DOI bins respectively. The images were acquired with two different scanner configurations as shown in Figure 1. The images were reconstructed by filtered backprojection with Shepp-Logan filter cut off at the Nyquist frequency for the line source phantom and 0.5 of the Nyquist frequency for the hot rod phantom. The rod diameters in the hot rod phantom are 0.75, 1.0, 1.35, 1.70, 2.0 and 2.4 mm with a rod-to-rod distance of twice the rod diameter. Note the improvement in the sharpness of the reconstructed images with increasing number of DOI bins.
TABLE 5.
FWHM image resolution of the line source phantom reconstructed with 20, 10, 5, 2 and 1 DOI bins. The images were reconstructed by filtered backprojection with a Shepp-Logan filter cut off at the Nyquist frequency. FWHM was obtained by Gaussian fitting. The distance of the three line sources from the center of the field of view was 0, 7.5 and 15 mm. The scanner configuration is shown in Figure 1 (top).
| No. of DOI bins | 20 | 10 | 5 | 2 | 1 | |
|---|---|---|---|---|---|---|
| Source 1 (x=0 mm) |
x | 0.86 mm | 0.88 mm | 0.95 mm | 1.15 mm | 1.71 mm |
| y | 0.95 mm | 0.97 mm | 1.05 mm | 1.30 mm | 1.55 mm | |
| Source 2 (x=7.5 mm) |
x | 0.80 mm | 0.80 mm | 0.84 mm | 1.01 mm | 1.00 mm |
| y | 0.97 mm | 0.99 mm | 1.09 mm | 1.40 mm | 1.62 mm | |
| Source 3 (x = 15 mm) |
x | 0.76 mm | 0.78 mm | 0.79 mm | 0.88 mm | 1.16 mm |
| y | 1.03 mm | 1.03 mm | 1.09 mm | 1.32 mm | 1.93 mm | |
TABLE 6.
FWHM image resolution of the line source phantom reconstructed with 20, 10, 5, 2 and 1 DOI bins. The images were reconstructed by filtered backprojection with Shepp-Logan filter cut off at the Nyquist frequency. FWHM was obtained by Gaussian fitting. The distance of the two line sources to the center of the field of view was 0 and 7.5 mm. The scanner configuration was shown in Figure 1 (Bottom). The FWHM of the image reconstructed with 1 DOI bin could not obtained as the resolution was badly degraded.
| No. of DOI bins | 20 | 10 | 5 | 2 | 1 | |
|---|---|---|---|---|---|---|
| Source 1 (x=0 mm) |
x | 1.00 mm | 1.03 mm | 1.37 mm | 2.93 mm | N/A |
| y | 1.03 mm | 1.03 mm | 1.29 mm | 2.51 mm | N/A | |
| Source 2 (x= 7.5 mm) |
x | 1.05 mm | 1.05 mm | 1.26 mm | 2.89 mm | N/A |
| y | 1.10 mm | 1.11 mm | 1.33 mm | 2.39 mm | N/A | |
DISCUSSION
As shown previously (32), light loss along the crystal length is essential for high resolution DOI measurement with dual-ended read out. In this work, unpolished LSO arrays were used to provide a strong depth-dependence in the scintillation light reaching the two ends of the array. This depth-dependence also was reflected in the flood histogram measured by one PSAPD. The flood histogram degraded as the irradiation depth from the PSAPD increased since less light reached the PSAPD. The reflectivity of the reflector used to make the array is not 100%, so there was also an increase in light cross talk as the irradiation depth was increased relative to the PSAPD location. The dynamic range of the flood histogram calculated using Anger logic was therefore reduced as the irradiation depth was increased. Fortunately the light loss along the length of the crystal is roughly linear, and the cross-talk and the total light reaching the two array ends are roughly constant, thus the flood histograms calculated from a combination of the signals from both PSAPDs do not exhibit any strong depth dependence and are of high quality for all irradiation depths.
The signal to noise ratio of the PSAPDs decreased as the temperature was increased. The identifiability of crystals in the flood histograms were improved with cooling, however the positions (centroids) of the crystals in the flood histograms did not change. Therefore temperature variations do not affect the crystal look-up table. The gain changes of the two PSAPDs with temperature are slightly different, therefore temperature changes do result in small variations in the DOI responses. Temperature variations also affected the detector energy resolution since the gain of the PSAPDs decreased as the temperature was increased. Therefore, a stable temperature is preferred for these dual-ended readout detector modules. Although our results showed that the PSAPDs work well at room temperature (32), the temperature of the detector box becomes much higher than room temperature when several PSAPDs, preamplifiers, and other electronics parts are enclosed. Therefore, to ensure low and stable temperature, the detector boxes were cooled and the temperature variation of the detector boxes was controlled to be less than ±1 °C during imaging. Although the temperature in the box is monitored, the precise temperature within the PSAPDs themselves is not known.
A timing shift of up to 12.5 ns was observed for crystals at the center and corner of the PSAPD. This results primarily from the resistive readout properties of the PSAPDs which causes a position dependence in the charge collection time. This is not a fatal drawback, as most commercial PET scanner electronics has the capability to perform crystal-by-crystal time alignment which could then correct these timing shifts. The measured crystal timing resolution of the PSAPDs (5.5 ns) is much worse than that achieved with PMTs (typically a few hundred ps to 2 ns). However, this timing resolution would be acceptable for a PET scanner for mouse imaging where the injected dose is typically less than 7.4 MBq, and therefore the rate of accidental coincidences is low.
The effects of DOI resolution on the visual image quality was studied by using different numbers of DOI bins. For scanner configuration 1, the images obtained with 2 DOI bins were much worse than images obtained with 20, 10 and 5 DOI bins. Only a slight difference was seen for the images obtained with 20, 10 and 5 DOI bins, suggesting that a DOI resolution of 4 mm FWHM was sufficient for this scanner configuration. Much bigger DOI effects were observed in the second scanner configuration. A DOI resolution of better than 3 mm FWHM was required to obtain images where DOI effects were negligible. The DOI resolution of our detectors averages ~ 2 mm FWHM, and this seems to be sufficient to accurately reconstruct data, even from geometries that deliberately exacerbate the DOI problem (scanner configuration 2).
Work is ongoing to reduce the inactive area at the edge of the PSAPD, to allow better packing of adjacent detector modules. Currently the physical size of the packaged PSAPD is 11×12.5 mm2, and the active area is 8×8 mm2. In these studies, we only the central 7×7 mm2 of the PSAPD is coupled to the LSO arrays. We plan to reduce the physical size of the PSAPDs to 9×9 mm2 and use the whole active area of 8×8 mm2 for final implementation in a multi-ring scanner. This will be necessary to fully exploit the efficiency benefit of these 2 cm thick LSO detectors in comparison to the 1 cm thick detectors used in many commercial animal PET scanners (he detection efficiencies of 2 cm- and 1 cm-thick LSO detectors at 511 keV are 81% and 57% respectively).
A question exists as to whether the PSAPDs can work stably for a long time in a scanner. All 16 PSAPDs have already worked in this prototype scanner for more than six months, suggesting that the technology is robust enough for use in an imaging system. Another PET system using PSAPDs but without DOI capability has been in operation for over a year and has been used for a range of animal studies (35).
Conclusion
A prototype PET scanner using detector modules consisting of dual-ended readout of pixelated LSO arrays with two PSAPDs was constructed and tested. Measurements performed on individual detector modules showed that a DOI resolution of 2 mm FWHM and an energy resolution of 15% FWHM could be obtained, and that all crystals could be clearly resolved in the measured flood histograms of arrays with sub-millimeter crystal size. Imaging studies performed on the prototype scanner showed that DOI measurements significantly improved the reconstructed spatial resolution. These results demonstrate that depth-encoding PET detectors consisting of sub-mm LSO arrays (high spatial resolution) with 2 cm total thickness of LSO (high efficiency) could provide flood histograms in which all crystals can be identified, good DOI and energy resolution and acceptable timing resolution. This approach is therefore promising for future preclinical PET scanner designs wishing to simultaneously achieve high spatial resolution and high sensitivity.
Acknowledgements
The authors would like to thank Dr. Ciprian Catana for many useful discussions. This work was funded by NIH grant R01 EB006109 and by SBIR funding from NIBIB.
References
- 1.Chatziioannou AF, Cherry SR, Shao YP, et al. Performance evaluation of microPET: A high-resolution lutetium oxyorthosilicate PET scanner for animal imaging. Journal of Nuclear Medicine. 1999 Jul;40(7):1164–1175. [PMC free article] [PubMed] [Google Scholar]
- 2.Cherry SR, Shao Y, Silverman RW, et al. MicroPET: A high resolution PET scanner for imaging small animals. Ieee Transactions on Nuclear Science. 1997 Jun;44(3):1161–1166. [Google Scholar]
- 3.Lecomte R, deKemp RA, Klein R, et al. LabPETtm: A second-generation APD-based digital scanner for high-resolution small animal PET imaging. Medical Physics. 2006 Jul;33(7):2671–2671. [Google Scholar]
- 4.Missimer J, Madi Z, Honer M, Keller C, Schubiger A, Ametamey SM. Performance evaluation of the 16-module quad-HIDAC small animal PET camera. Physics in Medicine and Biology. 2004 May;49(10):2069–2081. doi: 10.1088/0031-9155/49/10/016. [DOI] [PubMed] [Google Scholar]
- 5.Surti S, Karp JS, Perkins AE, et al. Imaging performance of A-PET: A small animal PET camera. Ieee Transactions on Medical Imaging. 2005 Jul;24(7):844–852. doi: 10.1109/tmi.2005.844078. [DOI] [PubMed] [Google Scholar]
- 6.Tai YC, Chatziioannou A, Siegel S, et al. Performance evaluation of the microPET P4: a PET system dedicated to animal imaging. Physics in Medicine and Biology. 2001 Jul;46(7):1845–1862. doi: 10.1088/0031-9155/46/7/308. [DOI] [PubMed] [Google Scholar]
- 7.Tai YC, Chatziioannou AF, Yang YF, et al. MicroPET II: design, development and initial performance of an improved microPET scanner for small-animal imaging. Physics in Medicine and Biology. 2003 Jun;48(11):1519–1537. doi: 10.1088/0031-9155/48/11/303. [DOI] [PubMed] [Google Scholar]
- 8.Tai YC, Ruangma A, Rowland D, et al. Performance evaluation of the microPET focus: A third-generation microPET scanner dedicated to animal imaging. Journal of Nuclear Medicine. 2005 Mar;46(3):455–463. [PubMed] [Google Scholar]
- 9.Wang YC, Seidel J, Tsui BMW, Vaquero JJ, Pomper MG. Performance evaluation of the GE healthcare eXplore VISTA dual-ring small-animal PET scanner. Journal of Nuclear Medicine. 2006 Nov;47(11):1891–1900. [PubMed] [Google Scholar]
- 10.Yang Y, Tai YC, Siegel S, et al. Optimization and performance evaluation of the microPET II scanner for in vivo small-animal imaging. Physics in Medicine and Biology. 2004 Jun 21;49(12):2527–2545. doi: 10.1088/0031-9155/49/12/005. [DOI] [PubMed] [Google Scholar]
- 11.Del Guerra A, Bartoli A, Belcari N, et al. Performance evaluation of the fully engineered YAP-(S)PET scanner for small animal imaging. Ieee Transactions on Nuclear Science. 2006 Jun;53(3):1078–1083. [Google Scholar]
- 12.Huisman MC, Reder S, Weber AW, Ziegler SI, Schwaiger M. Performance evaluation of the Philips MOSAIC small animal PET scanner. European Journal of Nuclear Medicine and Molecular Imaging. 2007 Apr;34(4):532–540. doi: 10.1007/s00259-006-0271-7. [DOI] [PubMed] [Google Scholar]
- 13.Taschereau R, Chatziioannou AF. Monte Carlo simulations of absorbed dose in a mouse phantom from 18-fluorine compounds. Medical Physics. 2007 Mar;34(3):1026–1036. doi: 10.1118/1.2558115. [DOI] [PMC free article] [PubMed] [Google Scholar]
- 14.Saoudi A, Pepin CM, Dion F, et al. Investigation of depth-of-interaction by pulse shape discrimination in multicrystal detectors read out by avalanche photodiodes. Ieee Transactions on Nuclear Science. 1999 Jun;46(3):462–467. [Google Scholar]
- 15.Seidel J, Vaquero JJ, Siegel S, Gandler WR, Green MV. Depth identification accuracy of a three layer phoswich PET detector module. Ieee Transactions on Nuclear Science. 1999 Jun;46(3):485–490. [Google Scholar]
- 16.de Jong H, van Velden FHP, Kloet RW, Buijs FL, Boellaard R, Lammertsma AA. Performance evaluation of the ECAT HRRT: an LSO-LYSO double layer high resolution, high sensitivity scanner. Physics in Medicine and Biology. 2007 Mar;52(5):1505–1526. doi: 10.1088/0031-9155/52/5/019. [DOI] [PubMed] [Google Scholar]
- 17.Tsuda T, Murayama H, Kitamura K, et al. A four-layer depth of interaction detector block for small animal PET. Ieee Transactions on Nuclear Science. 2004 Oct;51(5):2537–2542. [Google Scholar]
- 18.Inadama N, Murayama H, Yamaya T, et al. Preliminary evaluation of four-layer BGO DOI-detector for PET. Ieee Transactions on Nuclear Science. 2006 Feb;53(1):30–34. [Google Scholar]
- 19.Zhang N, Thompson CJ, Cayouette F, Jolly D, Kecani S. A prototype modular detector design for high resolution positron emission mammography imaging. Ieee Transactions on Nuclear Science. 2003 Oct;50(5):1624–1629. [Google Scholar]
- 20.Rouze NC, Schmand M, Siegel S, Hutchins GD. Design of a small animal PET imaging system with 1 microliter volume resolution. Ieee Transactions on Nuclear Science. 2004 Jun;51(3):757–763. [Google Scholar]
- 21.Stickel JR, Qi JY, Cherry SR. Fabrication and characterization of a 0.5-mm lutetium oxyorthosilicate detector array for high-resolution PET applications. Journal of Nuclear Medicine. 2007 Jan;48(1):115–121. [PubMed] [Google Scholar]
- 22.Burr KC, Ivan A, Castleberry DE, LeBlanc JW, Shah KS, Farrell R. Evaluation of a prototype small animal PET detector with depth-of-interaction encoding. Ieee Transactions on Nuclear Science. 2004 Aug;51(4):1791–1798. [Google Scholar]
- 23.Dokhale PA, Silverman RW, Shah KS, et al. Performance measurements of a depth-encoding PET detector module based on position-sensitive avalanche photodiode read-out. Physics in Medicine and Biology. 2004 Sep;49(18):4293–4304. doi: 10.1088/0031-9155/49/18/007. [DOI] [PubMed] [Google Scholar]
- 24.Moses WW, Derenzo SE, Melcher CL, Manente RA. Room-Temperature Lso Pin Photodiode Pet Detector Module That Measures Depth of Interaction. Ieee Transactions on Nuclear Science. 1995 Aug;42(4):1085–1089. [Google Scholar]
- 25.Shao Y, Meadors K, Silverman RW, et al. Dual APD array readout of LSO crystals: Optimization of crystal surface treatment. Ieee Transactions on Nuclear Science. 2002 Jun;49(3):649–654. [Google Scholar]
- 26.Du HN, Yang YF, Cherry SR. Measurements of wavelength shifting (WLS) fibre readout for a highly multiplexed, depth-encoding PET detector. Physics in Medicine and Biology. 2007 May;52(9):2499–2514. doi: 10.1088/0031-9155/52/9/011. [DOI] [PubMed] [Google Scholar]
- 27.Lerche CW, Benlloch JM, Sanchez F, et al. Depth of gamma-ray interaction within continuous crystals from the width of its scintillation light-distribution. Ieee Transactions on Nuclear Science. 2005 Jun;52(3):560–572. [Google Scholar]
- 28.Ling T, Lewellen TK, Miyaoka RS. Depth of interaction decoding of a continuous crystal detector module. Physics in Medicine and Biology. 2007 Apr;52(8):2213–2228. doi: 10.1088/0031-9155/52/8/012. [DOI] [PubMed] [Google Scholar]
- 29.Burr KC, Ivan A, LeBlanc J, et al. Evaluation of a position sensitive avalanche photodiode for PET. Ieee Transactions on Nuclear Science. 2003 Aug;50(4):792–796. [Google Scholar]
- 30.Shah KS, Farrell R, Grazioso R, Harmon ES, Karplus E. Position-sensitive avalanche photodiodes for gamma-ray imaging. Ieee Transactions on Nuclear Science. 2002 Aug;49(4):1687–1692. [Google Scholar]
- 31.Shah KS, Grazioso R, Farrell R, et al. Position sensitive APDs for small animal PET imaging. Ieee Transactions on Nuclear Science. 2004 Feb;51(1):91–95. [Google Scholar]
- 32.Yang YF, Dokhale PA, Silverman RW, et al. Depth of interaction resolution measurements for a high resolution PET detector using position sensitive avalanche photodiodes. Physics in Medicine and Biology. 2006 May;51(9):2131–2142. doi: 10.1088/0031-9155/51/9/001. [DOI] [PubMed] [Google Scholar]
- 33.Wu Y, Catana C, Cherry SR. A Multiplexer Design for Position-Sensitive Avalanche Photodiode Detectors in a PET Scanner. Ieee Transactions on Nuclear Science. 2007 In press. [Google Scholar]
- 34.Judenhofer MS, Pichler BJ, Cherry SR. Evaluation of high performance data acquisition boards for simultaneous sampling of fast signals from PET detectors. Physics in Medicine and Biology. 2005;50:29–44. doi: 10.1088/0031-9155/50/1/003. [DOI] [PubMed] [Google Scholar]
- 35.Catana C, Wu YB, Judenhofer MS, Qi JY, Pichler BJ, Cherry SR. Simultaneous acquisition of multislice PET and MR images: Initial results with a MR-compatible PET scanner. Journal of Nuclear Medicine. 2006 Dec;47(12):1968–1976. [PubMed] [Google Scholar]