

Abstract
FeIV=O biomimetic model complexes have been characterized using nuclear vibrational resonance spectroscopy (NRVS). Features and systematic trends in the low energy region reflect equatorial and axial bonding differences that relate to differences in reactivity. These trends have been computationally extended to predict the spectra of putative FeIV=O intermediates in non-heme iron enzymes and show the utility of the NRVS method for structural insight.
Keywords: iron(IV), NRVS, non-heme iron, Spectroscopic methods, X-ray spectroscopy
FeIV=O intermediates have been shown to be key catalytic species in a growing number of mononuclear non-heme iron (NHI) enzymes. Various combinations of Mößbauer (Mb), electron-nuclear double resonance, magnetic circular dichroism (MCD), and extended x-ray absorption data exist on these, providing electronic insight and bonding descriptions of the FeIV=O unit.[1] However information regarding other chemically important features necessary for mechanistic insight (overall structure) is mostly lacking. Resonance Raman (rR) and IR spectroscopy can, in principle, provide such insight, however, due to selection rules, low absorption intensities (NHI species lack the intense Soret band), and other factors, experimental data are limited.[2] Herein, we present vibrational data obtained by nuclear resonance vibrational spectroscopy (NRVS) on three FeIV=O complexes interpreted via coupling with DFT calculations, with particular focus on understanding the low energy spectral region. The data show systematic trends that provide molecular level insight reflecting the FeIV ligand environment and reactivity. Computationally, these studies are extended to models of the FeIV=O species in HmaS/HPPD (vide infra) and show that FeIV species can be experimentally differentiated using NRVS.
The NRVS experiment employs synchrotron radiation tuned to the 14.4 keV 57Fe nuclear Mb transition.[3–5] Inelastic scattering, where phonon annihilation and creation events couple with nuclear excitation, yields the Fe partial vibrational density of states (PVDOS) NRVS spectrum. This is analogous to Stokes and anti-Stokes rR scattering, but NRVS intensity is gained through Fe displacement (ΔFe), via the mode composition factor, and provides selective enhancement of all Fe-core modes with no background.[6] This method has been applied to Fe-S and heme enzymes, nitrogenase and model complexes.[7–16] NRVS data for an FeV-nitrido complex with a ligand similar to 1 (vide infra) have been reported.[16] However, detailed analysis in the low energy region was complicated by inhomogeneity in the sample.[16]
FeIV=O (S = 1) functional models have been synthesized with 1,4,8,11-tetramethyl-1,4,8,11-tetraazacyclotetradecane (1); N,N-bis(2-pyridylmethyl)-N-bis(2-pyridyl)methylamine (2); and N-benzyl-N,N′,N′-tris(2-pyridylmethyl)-1,2-diaminoethane (3) ligands.[17–19] Each complex is 6-coordinate: 1 has an equatorial (eq) ring with tertiary amines and an axial (ax) NCCH3 ligand; 2 has eq pyridines (py) and a tethered ax tertiary amine and 3 is quite rhombic with two tertiary amine and three py ligands. Structures are available for 1 and 2. Note, 2 and 3 are more reactive than 1 in their ability to H-atom abstract from cyclohexane.[20]
The NRVS data for 1, 2, and 3 are shown in Figure 1. Isotope sensitive peaks are observed at 831 (796 in 18O), 820 (788) and 824 (786) cm−1, respectively, that can be assigned as ν2, the FeO stretch (normal modes in Figure 2).[21, 22] Resolution on NRVS energies is 8 cm−1. These correlate well with the calculated energies and isotope shifts, see SI and Figure S2. This mode has been observed only in 1 at 834 by IR and at 839 cm−1 by rR, in good agreement with our results.[19, 23] The lowerν2 frequencies for 2 and 3 relative to 1 imply that their FeO bonds are weaker. Excited state MCD data have shown the FeO π bond is stronger in 2 relative to 1 therefore the σ bond must be weaker.[24] This can be rationalized by considering the stronger donation of the eq ligands in 2 (vide infra) which donate into the donut of dz2 and compete with the oxo.
Figure 1.
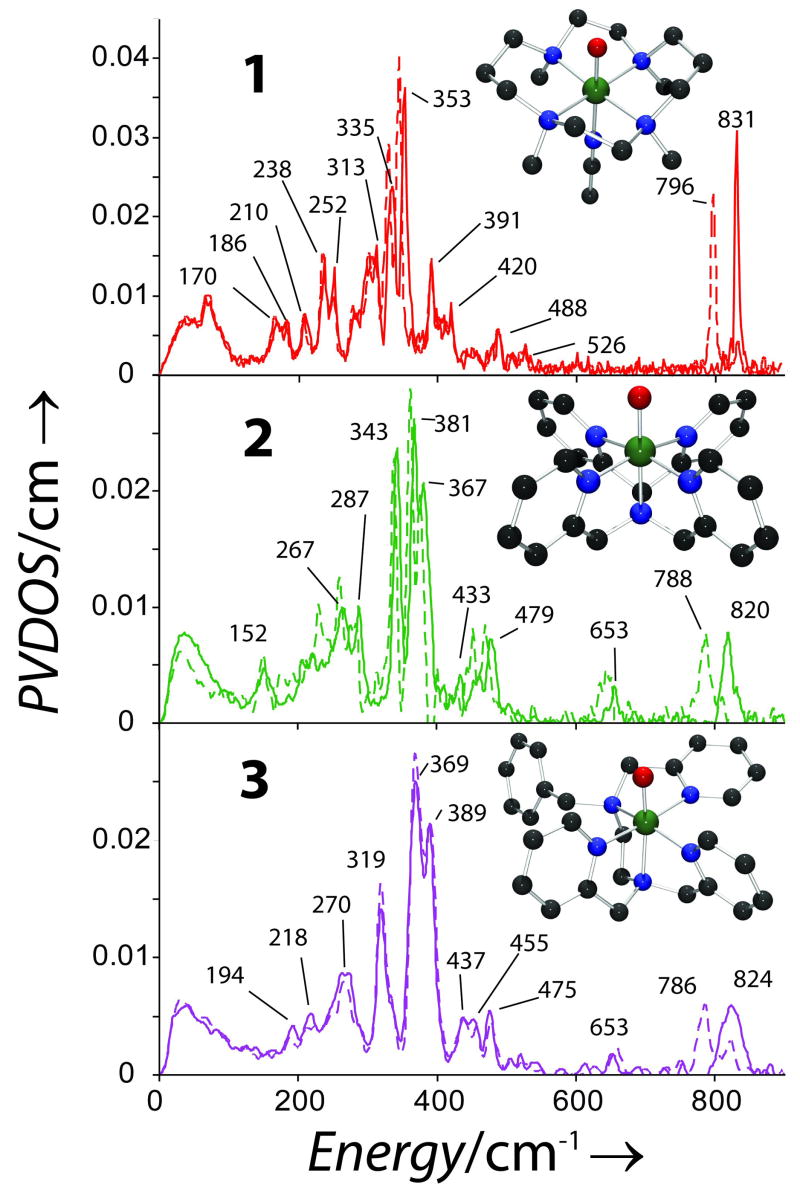
NRVS PVDOS for 1, 2 and 3 with 16O (solid lines) and 18O (dotted lines), insets show the 3D structures of complexes.
Figure 2.

Normal modes for C4v complexes adapted from ref.[21] Modes with ΔFe are boxed. Nomenclature follows Nakamoto.[22]
Moving down in energy, a weak peak is observed at 653 cm−1 in 2 and 3, while for 1 the next resolvable peak is at 526 cm−1. In 2 and 3 this is assigned, based on DFT calculations, as ν8, the asymmetric FeNeq stretches. In the calculations, these are shifted to the 450 – 470 cm−1 region in 1 and not resolved in the data. In total, 4 modes involve FeNeq stretching (including the NRVS inactive ν1 and ν5) and probe eq bonding; the average energy of these sets is 355, 648 and 598 cm−1, respectively. Calculations where the eq ring in 1 is cleaved (1′, see SI) show that the average FeN bond length shortens by 0.07 Å, the splitting of the 4 modes decreases and the average increases to 430 cm−1. These results show that the chelate in 1 influences the eq bonding but that the overall strength is determined by the greater σ donation of the py ligands relative to tertiary amines which affects FeO bonding.
Continuing down in energy, the first intense feature is assigned as ν3 (FeNax stretch) at 391, 367 and 389 cm−1, in 1, 2 and 3, respectively. In the calculations these show variable intensity (bars in Figure 3) and mix with ν11. The resulting ΔFe has both in-plane (ip) and out-of-plane (op) contributions from ν11 and ν3. The ip motion in 1 is restricted due to the chelate, reducing ΔFe, i.e. intensity. In 1′, ΔFe is restored and ν3 shifts to 294 cm−1, Figure S4. Calculations where the ax tether is removed in 2 (2′, see SI) show that ν3 is shifted down in energy to 300 cm−1, consistent with a 0.05 Å increase of the FeNax bond, but the ip and op ΔFe are preserved. This mode reflects the bond trans to the oxo and constraints in the ligand environment.
Figure 3.

DFT calculated NRVS PVDOS for 1, 2 and 3 (16O (solid lines) and 18O (dotted lines)) with ΔFe included as bars.
The remaining two intense features are assigned as ν11a/b (OFeNax bends), which split due to orthogonal differences in the eq ligand environment; ring size in 1, ax tether in 2 and eq chelate in 3. The splitting in 3 is 50 cm−1 but only ~25 cm−1 in 1 and 2 reflecting the contracted eq chelate between a pair of cis N’s in 3 and affords a probe of rhombic (perpendicular to the FeO) distortion. In 1′, the most symmetric model, the splitting is 6 cm−1. In 2′ (where, the x and y axes are still inequivalent) the energy positions and splitting are unchanged but the calculated intensity is reduced due to increased Nax motion. The splitting of ν11 reflects the ligand environment perpendicular to the FeO bond and, combined with high intensity, should provide structural insight for FeIV=O intermediates.
(4-Hydroxyphenyl)pyruvate dioxygenase (HPPD) and (4-hydroxy)mandelate synthase (HmaS) are NHI enzymes containing the 2 His 1 Glu facial triad and use the same substrate (HPP) but exhibit different reaction mechanisms (electrophilic aromatic attack and H-atom abstraction, respectively) dictated by the orientation of HPP by the protein pocket.[25] The first step in both reactions is decarboxylation of HPP and computational studies on the resultant FeIV=O site show that two 5C geometries are reasonable: square pyramidal (sqp, 4) with the oxo in the eq plane and trigional bipyramidal (tbp) with the oxo axial (5).[25] Here we determine that NRVS can discriminate between these proposed structures. The calculated PVDOS are shown in Figure 4. The intense peaks at 301 and 424 cm−1 in 4 are bends of the OFeNtrans unit (trans to the oxo) reminiscent of ν11a/b, where the large splitting arises from loss of the cis ligand. Intense peaks are also at 237 and 837 cm−1 which involve FeNtrans (~ν3) and FeO (~ν2) stretches. For 1, 2, and 3, ν3 was observed at a higher energy relative to ν11; the shift to lower energy in 4 is due to the increased effective mass of histidine. The NRVS data of 5 are distinctly different and can be understood considering the normal modes for a tbp complex, Figure S6. The degenerate ν6 and ν7 pairs involve trans ax bends and cis ML stretches. These are highly mixed in 5 and produce 4 peaks with similar intensity. The trans NHis stretch (~ν3) is also intense at 257 cm−1. In summary, with the exception of the FeO stretch, the intense modes occur at low energies and, due to the inverse energy dependency of NRVS intensity, are likely to be detectable in enzyme intermediates and afford a mechanism for structural characterization.
Figure 4.

DFT calculated NRVS PVDOS for 4 and 5 with ΔFe.
Analysis of the ground state NRVS vibrational data coupled with excited state data from previous MCD studies provides detailed bonding descriptions of 1, 2, and 3.[24, 26] The increased reactivity of 2 and 3 relative to 1 correlates with the strength of the FeO π bond (oxo p character in the π* LUMO, the frontier molecular orbital) and is determined by equatorial ligand σ donation. Additionally, the ν3 andν11 modes show systematic trends which reflect the ligand environment. Lower energy modes have generally not been used for geometric insight, but in NRVS spectra these are enhanced in intensity relative to higher energy stretches (e.g. characteristic metal ligand modes such as νFeO) and more likely to be detected in intermediates. This study uses these modes for electronic structural insight on FeIV=O models and computationally evaluates their utility for determination of active site structure in NHI enzyme intermediates.
Experimental Section
Samples prepared as previously described.[17, 18] NRVS was collected on beamline 3-ID at Advance Photon Source on multiple visits.[6, 7, 27] Spectra were collected from −25 and 125 meV in 0.25 meV steps. 5 to 12 scans were averaged and normalized from which the PVDOS was generated using the PHOENIX program.[28] Spin-unrestricted DFT calculations were performed using Gaussian 03 (see SI).
Footnotes
Use of the Advanced Photon Source at Argonne National Laboratory was supported by the U. S. Department of Energy, Office of Science, Office of Basic Energy Sciences, under Contract No. DE-AC02-06CH11357. Financial support of this research was provided by NIH Grants GM65440 (S.P.C), GM33162 (L.Q.), and GM40392 (E.I.S.) and NSF-Biophysics Program Grant MCB-0342807 (E.I.S)). We would like to thank Jjyong Zhao, Wolfgang Sturhahn and the staff at beamline 3-ID for assistance and discussions regarding NRVS.
References
- 1.See Fe(IV) special edition of J Inorg Biochem 2006, 100, and references therein.
- 2.Proshlyakov DA, Henshaw TF, Monterosso GR, Ryle MJ, Hausinger RP. J Am Chem Soc. 2004;126:1022. doi: 10.1021/ja039113j. [DOI] [PubMed] [Google Scholar]
- 3.Sturhahn W. J Phys Condens Matter. 2004;16:S497. [Google Scholar]
- 4.Scheidt WR, Durbin SM, Sage JT. J Inorg Biochem. 2005;99:60. doi: 10.1016/j.jinorgbio.2004.11.004. [DOI] [PubMed] [Google Scholar]
- 5.Rüffer R, Chumakov AI. Hyperfine Interactions. 2000;128:255. [Google Scholar]
- 6.Alp EE, Mooney TM, Toellner T, Sturhahn W. Hyperfine Interactions. 1994;90:323. [Google Scholar]
- 7.Xiao Y, Wang H, George SJ, Smith MC, Adams MW, Jenney FE, Jr, Sturhahn W, Alp EE, Zhao J, Yoda Y, Dey A, Solomon EI, Cramer SP. J Am Chem Soc. 2005;127:14596. doi: 10.1021/ja042960h. [DOI] [PubMed] [Google Scholar]
- 8.Leu BM, Zgierski MZ, Wyllie GR, Scheidt WR, Sturhahn W, Alp EE, Durbin SM, Sage JT. J Am Chem Soc. 2004;126:4211. doi: 10.1021/ja038526h. [DOI] [PMC free article] [PubMed] [Google Scholar]
- 9.Achterhold K, Sturhahn W, Alp EE, Parak FG. Hyperfine Interactions. 2002;141–142:3. [Google Scholar]
- 10.Xiao Y, Tan ML, Ichiye T, Wang H, Guo Y, Smith MC, Meyer J, Sturhahn W, Alp EE, Zhao J, Yoda Y, Cramer SP. Biochemistry. 2008 doi: 10.1021/bi701433m. [DOI] [PubMed] [Google Scholar]
- 11.Xiao Y, Fisher K, Smith MC, Newton WE, Case DA, George SJ, Wang H, Sturhahn W, Alp EE, Zhao J, Yoda Y, Cramer SP. J Am Chem Soc. 2006;128:7608. doi: 10.1021/ja0603655. [DOI] [PMC free article] [PubMed] [Google Scholar]
- 12.Rai BK, Durbin SM, Prohofsky EW, Sage JT, Wyllie GR, Scheidt WR, Sturhahn W, Alp EE. Biophys J. 2002;82:2951. doi: 10.1016/S0006-3495(02)75636-1. [DOI] [PMC free article] [PubMed] [Google Scholar]
- 13.Rai BK, Durbin SM, Prohofsky EW, Sage JT, Ellison MK, Roth A, Scheidt WR, Sturhahn W, Alp EE. J Am Chem Soc. 2003;125:6927. doi: 10.1021/ja028219w. [DOI] [PubMed] [Google Scholar]
- 14.Rai BK, Prohofsky EW, Durbin SM. J Phys Chem B Condens Matter Mater Surf Interfaces Biophys. 2005;109:18983. doi: 10.1021/jp052950i. [DOI] [PubMed] [Google Scholar]
- 15.Cramer S, Xiao Y, Wang H, Guo Y, Smith M. Hyperfine Interactions. 2006;170:47. [Google Scholar]
- 16.Petrenko T, DeBeer George S, Aliaga-Alcalde N, Bill E, Mienert B, Xiao Y, Guo Y, Sturhahn W, Cramer SP, Wieghardt K, Neese F. J Am Chem Soc. 2007;129:11053. doi: 10.1021/ja070792y. [DOI] [PubMed] [Google Scholar]
- 17.Klinker EJ, Kaizer J, Brennessel WW, Woodrum NL, Cramer CJ, Que L., Jr Angew Chem Int Ed. 2005;44:3690. doi: 10.1002/anie.200500485. [DOI] [PubMed] [Google Scholar]
- 18.Rohde JU, Torelli S, Shan X, Lim MH, Klinker EJ, Kaizer J, Chen K, Nam W, Que L. Angew Chem Int Ed, Vol. 126;2004:16750. doi: 10.1021/ja047667w. [DOI] [PubMed] [Google Scholar]
- 19.Rohde JU, In JH, Lim MH, Brennessel WW, Bukowski MR, Stubna A, Münck E, Nam W, Que L., Jr Science. 2003;299:1037. doi: 10.1126/science.299.5609.1037. [DOI] [PubMed] [Google Scholar]
- 20.Kaizer J, Klinker EJ, Oh NY, Rohde JU, Song WJ, Stubna A, Kim J, Munck E, Nam W, Que L. J Am Chem Soc. 2004;126:472. doi: 10.1021/ja037288n. [DOI] [PubMed] [Google Scholar]
- 21.Preetz W, Ruf D, Tensfeldt D. Zeitschrift Fur Naturforschung Section B-a Journal of Chemical Sciences. 1984;39:1100. [Google Scholar]
- 22.Nakamoto K. Infrared and Raman Spectra of Inorganic and Coordination Compounds. John Wiley & Sons, Inc; New York: 1997. [Google Scholar]
- 23.Jackson TA, Rohde JU, Seo MS, Sastri CV, DeHont R, Ohta T, Kitagawa T, Munck E, Que L., Jr J Am Chem Soc. 2008;130 doi: 10.1021/ja8022576. In press. [DOI] [PMC free article] [PubMed] [Google Scholar]
- 24.Decker A, Rohde JU, Que L, Jr, Solomon EI. J Am Chem Soc. 2004;126:5378. doi: 10.1021/ja0498033. [DOI] [PubMed] [Google Scholar]
- 25.Neidig ML, Decker A, Choroba OW, Huang F, Kavana M, Moran GR, Spencer JB, Solomon EI. Proc Natl Acad Sci U S A. 2006;103:12966. doi: 10.1073/pnas.0605067103. [DOI] [PMC free article] [PubMed] [Google Scholar]
- 26.Decker A, Rohde JU, Klinker EJ, Wong SD, Que L, Jr, Solomon EI. J Am Chem Soc. 2007;129:15983. doi: 10.1021/ja074900s. [DOI] [PMC free article] [PubMed] [Google Scholar]
- 27.Sturhahn W. Hyperfine Interactions. 1995;95:6. [Google Scholar]
- 28.Sturhahn W. Hyperfine Interactions. 2000;125:149. [Google Scholar]