Abstract
A variety of neurological disorders and polyglutamine (polyQ) diseases are caused by misfolded proteins. The common feature of these diseases is late-onset cellular degeneration that selectively affects neurons in distinct brain regions. polyQ diseases, including Huntington's disease (HD), present a clear case of selective neurodegeneration caused by polyQ expansion-induced protein misfolding, which also leads to predominant inclusions in neuronal nuclei. It remains unclear how these ubiquitously expressed disease proteins selectively kill neurons. In HD, mutant huntingtin accumulates in both neurons and glia, but more neuronal cells display huntingtin aggregates. These aggregates colocalize with components of the ubiquitin-proteasome system (UPS), which plays a critical role in clearing misfolded proteins. Using fluorescent reporters that reflect cellular UPS activity, we found that UPS activity in cultured neurons and glia decreases in a time-dependent manner. Importantly, UPS activity is lower in neurons than in glia and also lower in the nucleus than the cytoplasm. By expressing the UPS reporters in glia and neurons in the mouse brain, we also observed an age-dependent decrease in UPS activity, which is more pronounced in neurons than glial cells. Although brain UPS activities were similar between wild-type and HD 150Q knock-in mice, inhibiting the UPS markedly increases the accumulation of mutant htt in cultured glial cells. These findings suggest that the lower neuronal UPS activity may account for the preferential accumulation of misfolded proteins in neurons, as well as their selective vulnerability.
Keywords: ubiquitin, proteasome, huntingtin, polyglutamine, aggregates, degeneration
Introduction
The ubiquitin-proteasome system (UPS) removes damaged or misfolded proteins by ubiquitinating them via ubiquitin ligases and then targeting these ubiquitinated proteins to the proteasome for degradation (Ciechanover, 2005; Demartino and Gillette, 2007). Normal UPS function is particularly important for preventing diseases that are caused by misfolded proteins. Among these diseases, polyglutamine (polyQ) expansion in various proteins causes nine inherited neurodegenerative disorders (Orr and Zoghbi, 2007). The common feature of polyQ diseases is the presence of polyQ protein aggregates or inclusions attributable to the accumulation of misfolded proteins in selective brain regions. These misfolded proteins predominantly accumulate in neurons, despite the fact that polyQ disease proteins are widely expressed throughout the brain and body.
In Huntington's disease (HD), selective neurodegeneration preferentially occurs in the striatum and extends to various brain regions as the disease progresses (Vonsattel et al., 1985; Martin and Gusella, 1986). HD is caused by the expansion of a polyQ tract in the N-terminal region of huntingtin (Landles and Bates, 2004; Gusella and Macdonald, 2006), a large protein of 350 kDa that is ubiquitously expressed and interacts with a number of proteins (Li and Li, 2004). Like other polyQ disease proteins, mutant htt also induces selective neurodegeneration. Understanding the mechanism underlying this selective neurodegeneration will help elucidate the pathogeneses of polyQ diseases and other neurological disorders, such as Alzheimer's and Parkinson's diseases, which also show the selective accumulation of toxic proteins in neuronal cells.
In the human brain, glia make up the major population (>90%) of cells and provide neurons with nutrients, growth factors, and other support. Although mutant htt is also expressed in glial cells (Shin et al., 2005; Chou et al., 2008; Wang et al., 2008a), significantly more neurons than glia contain htt aggregates (Shin et al., 2005). As such, neuronal htt toxicity in HD has been better characterized than glial pathology (Li and Li, 2006).
Because neurons are postmitotic cells, their ability to cope with misfolded proteins may be different from that of other cell types, such as glial cells, which can proliferate and regenerate (Barres and Barde, 2000). Despite the critical role the UPS plays in clearing misfolded proteins in different cell types, little is known about potential differences in UPS activity in neurons versus glia in the brain. Addressing this issue could help explain the mechanisms behind the selective neuropathology in a variety of neurodegenerative disorders that are caused by misfolded proteins. In this study, we focus on UPS activity in neurons and glia. We demonstrate that UPS activity decreases in an age-dependent manner and is lower in neurons than glia. However, inhibiting the UPS can increase the accumulation of mutant huntingtin in glial cells. Our findings suggest that the intrinsically lower UPS activity in neurons is a major contributor to the preferential accumulation of misfolded proteins in neurons seen in various neurodegenerative diseases.
Materials and Methods
Animals.
Hdh(CAG)150 knock-in (HD150Q KI) mice were generated previously (Lin et al., 2001) and maintained on the SV129/B6 background in the animal facility at Emory University in accordance with institutional guidelines. Genomic DNA was extracted from tails to genotype the mice as wild type (7Q/7Q) and KI (150Q/150Q).
Antibodies and reagents.
Antibodies against N-terminal human htt (EM48) were generated previously (Gutekunst et al., 1999). Antibodies against an expanded polyQ tract (1C2, 1:5000) and glyceraldehyde-3-phosphate dehydrogenase (1:3000) were obtained from Millipore. Other antibodies used are against the following proteins: γ-tubulin (1:10,000; Sigma), red fluorescent protein (RFP) and green fluorescent protein (GFP) (Clontech), neuronal-specific nuclear protein (NeuN) (Millipore), GFAP (Millipore), and ubiquitin (1:500; Cell Signaling Technology, Santa Cruz Biotechnology). Secondary antibodies were peroxidase-conjugated donkey anti-mouse, anti-rabbit, anti-rat, anti-guinea pig, anti-goat, or anti-sheep IgG (heavy and light) from Jackson ImmunoResearch (all used at 1:5000).
Neuronal and glial cell cultures.
Neurons were prepared from the cerebral cortex and striatum of rat fetuses at embryonic day 17–18. Viable neurons were plated at 1 × 10⁶ cells/ml on poly-d-lysine-coated plastic culture plates (Corning Costar) in B27-supplemented Neurobasal medium (Invitrogen). To reduce the proliferation of glia, cytosine arabinoside was added to the cultures at a final concentration of 5 × 10⁶ m 3 d after plating cells.
Postnatal day 1 mouse pups [wild-type and homozygous Hdh(CAG)150 KI] were used for glial culture. Viable glia were plated at 1 × 10⁵ cells/ml on plastic culture plates (Corning Costar) in DMEM (Sigma). Mixed glia–neuron cocultures were plated at 1 × 10⁵ cells/ml on poly-d-lysine-coated plastic culture plates (Corning Costar) in DMEM (Sigma).
Cultured neurons and glia that had been cultured for 4–20 d were infected with adenoviral vectors. The adenoviral vectors were incubated with the cultured neurons and glia for 24 h before the medium was removed. After adenoviral infection for 48 h, cultured cells were examined by Western blotting or fluorescent microscopy.
Adenoviral vector construction and preparation.
A CL-1 degron sequence (Bence et al., 2001) was added to the C terminus of GFP in the PRK vector to generate PRK–GFPu construct. cDNA sequences for RFP were used to replace the ubiquitinated GFP (GFPu) to generate PRK–RFP construct. Generation and purification of adenoviral GFPu and RFP were performed according to the methods used in our previous studies (Dong et al., 2004; Shin et al., 2005). Viral titer was determined by measuring the number of infected HEK293 cells expressing GFPu or RFP. All viral stocks were adjusted to 1010 viral particles/ml.
Stereotaxic injection.
Experiments were performed in accordance with the National Institutes of Health Guide for the Care and Use of Laboratory Animals and the Emory University Institutional Animal Care and Use Committee. Briefly, mice were anesthetized with intraperitoneal injection of Avertin (250 mg/kg) and positioned in a stereotaxic apparatus. A small incision was made in the scalp, and adenoviral GFPu/RFP at a ratio of 1:1 was injected into different mouse brain regions using stereotaxic coordinates relative to bregma. Coordinates for the white matter in the corpus callosum were 0.7 mm anteroposterior, 1.0 mm mediolateral, and 1.2 mm dorsoventral. Coordinates for the cerebral cortex were 0.7 mm anteroposterior, 1.0 mm mediolateral, and 0.8 mm dorsoventral. Coordinates for the striatum were 0.7 mm anteroposterior, 1.8 mm mediolateral, and 2.5 mm dorsoventral. A small hole was drilled into the skull, and a 26 gauge needle attached to a 5 μl Hamilton syringe was lowered into the corpus callosum, cerebral cortex, or striatum according to the dorsoventral coordinates. A nanoinjector pump (World Precision Instruments) controlled the infusion of 2.0 μl of adenovirus at a rate of 0.4 μl/min, after which the needle was left in place for 5 min to ensure complete diffusion of the viruses. Mice brains were examined using a fluorescent scope at 7 d after injection.
Immunohistochemistry.
Mice were anesthetized and then perfused intracardially with PBS, pH 7.2, for 30 s followed by 4% paraformaldehyde in 0.1 m phosphate buffer at pH 7.2. Brains were removed, cryoprotected in 30% sucrose at 4°C, and sectioned at 40 μm using a freezing microtome. Free-floating sections were preblocked in 4% normal goat serum (NGS) in PBS, 0.1% Triton X-100, and avidin (10 μg/ml) and then incubated with EM48 antibody (Gutekunst et al., 1999; Zhou et al., 2003) at 4°C for 48 h. The rabbit EM48 (1:2000) immunoreactive product was visualized with the avidin-biotin complex kit (Vector ABC Elite; Vector Laboratories). Light micrographs were taken using a Zeiss microscope (Axiovert 200 MOT) equipped with a digital camera (Orca-100; Hamamatsu) and the image acquisition software Openlab (Improvision). A 20× (LD-Achroplan 20×/0.4 numerical aperture NA) or 63× lens (63×/0.75 numerical aperture) was used for light microscopy. Enhanced GFP was imaged using 488 nm excitation and a 500–530 nm bandpass filter, and RFP was imaged using 543 nm excitation and a 565–615 nm bandpass filter. The figures were created using Photoshop 7.0 software (Adobe Systems) and, in some cases in which the brightness and contrast of the whole image needed adjustment, we used the brightness/contrast adjustment function.
For immunofluorescent double labeling of injected mouse brain regions, fresh brain sections were cut at 10 μm with a cryostat and mounted on slides. Brain sections were fixed with 4% paraformaldehyde and washed with PBS. Sections were blocked (3% BSA fraction V, 10% NGS, and 0.3% Triton X-100) for 1 h and incubated with primary antibodies for the astrocyte marker GFAP or neuronal marker NeuN to identify different cell types infected with the adenoviral RFP. Sections were washed in PBS and incubated with mouse secondary antibody conjugated with cyanine 2 (1:500; Jackson ImmunoResearch) and Hoechst (1:1000) for 1 h at 4°C. Immunofluorescent labeling (green) of neurons or glia infected with adenovirus–RFP (red) were then visualized with the Zeiss microscope, and images were captured with a digital camera (Orca-100; Hamamatsu).
Proteasome activity assay.
For determining proteasome activity, clear whole-cell extracts of neuronal or glial cells were adjusted to 0.5 mg/ml total protein by dilution with homogenization buffer. All assays were done in triplicate, and the results were obtained from two to four experiments. The chymotrypsin-like activity of 20S β5 was determined using the substrate Suc–LLVY–7-amino-4-methyl-coumarin (AMC) (40 μm; Biomol), and the trypsin-like activity of 20S β2 was determined using the substrate Boc–LRR–AMC (100 μm; Biomol). Equal amounts (10 μg) of the extracts were incubated with corresponding substrates in 100 μl of proteasome activity assay buffer (0.05 m Tris-HCl, pH 8.0, and 0.5 mm EDTA) for 60 min at 37°C. The reactions were stopped by adding 0.8 ml of cold water and placing the reaction mixtures on ice protected from light exposure for at least 10 min. The free AMC fluorescence was quantified by using the CytoFluor multiwell plate reader (FLUOstar; BMG) with excitation and emission wavelengths at 380 and 460 nm, respectively. All readings were standardized using the fluorescence intensity of an equal volume of free AMC solution (40 mm), normalized by the protein concentrations, and expressed as nanomoles per minute per milligram of protein.
Quantitative fluorescence imaging analysis.
Quantitative analysis of captured fluorescent images was performed as described previously (Wang et al., 2008b). Briefly, precise segmentation of bright spots was achieved by setting a lower threshold just above background emission, typically ∼23–25 gray scale units (gsu), and an upper threshold at the upper limit of the eight-bit gray scale (i.e., 255 gsu). Cell bodies were detected as objects around the nuclei, separated from the neurites by a watershed filter. It starts by running a “Hi-Pass” filter across the image to enhance edges (replaces each pixel with a value that increases contrast with neighboring pixels) (Mitchell et al., 2007). Cell bodies (seven to nine for each group) are selected as any objects with a size and signal intensity greater than a user-defined minimum that is above a defined background. We used the Openlab software, which generated a high-content array of measurements that included event number, area, average sum of pixel intensities, and maximum and minimum pixel intensities. The average sum of pixel intensities is selected as the parameter for statistical analysis.
Statistical analysis.
Data are expressed as mean ± SEM and were analyzed for statistical significance (p < 0.05) with Prism software (version 4; GraphPad Software).
Results
Different accumulations of mutant htt in neurons and glia
Htt is ubiquitously expressed in neuronal and non-neuronal cells. Accumulation of mutant htt in the brains of various HD mouse models is reflected by the nuclear localization of mutant htt and the formation of htt aggregates (Wang et al., 2008a). By examining HD150Q KI mice, in which full-length mutant htt is expressed under the control of the endogenous mouse HD gene, we found that mutant htt preferentially accumulates in neuronal cells compared with glial cells (Fig. 1A). This phenomenon is evident from the abundant nuclear labeling of neuronal cells in the striatum by EM48, an antibody that preferentially reacts with mutant htt (Gutekunst et al., 1999; Lin et al., 2001). Fewer glial cells in the white matter of the corpus callosum show EM48 staining. Because N-terminal mutant htt accumulates in the nucleus and forms aggregates (DiFiglia et al., 1997; Gutekunst et al., 1999; Wang et al., 2008a), we also examined the brains of R6/2 mice that express a small N-terminal (exon1) mutant htt (Davies et al., 1997). Compared with glial cells, neuronal cells clearly show more abundant nuclear accumulation of mutant htt and htt aggregates, which are present in both the nuclei and processes (Fig. 1B). Although the results also show that fewer glial cells contain nuclear EM48 staining than neuronal cells, consistent with our previous finding (Shin et al., 2005), comparison of HD150Q KI and R6/2 mice indicates that N-terminal mutant htt accumulates much more readily in neurons than in glial cells.
Figure 1.
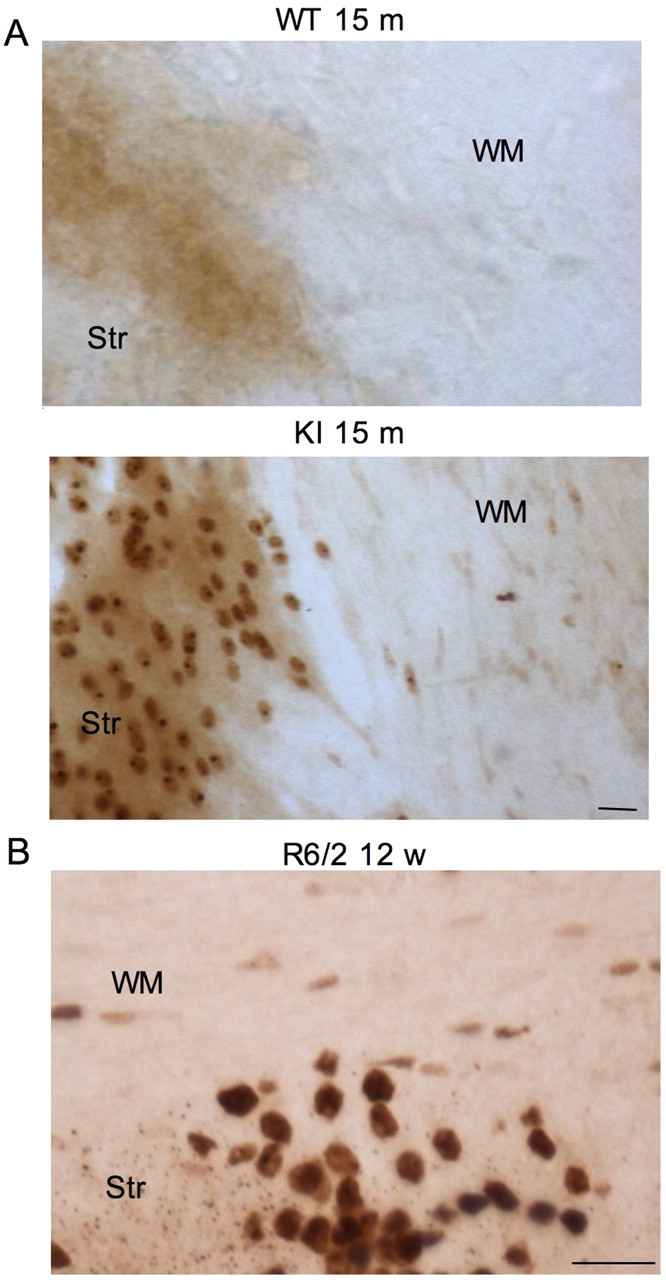
Different accumulations of mutant htt in neuronal versus glial cells in HD mouse brains. A, EM48 immunohistochemical staining of the striatum (Str) and white matter (WM) of the corpus callosum of wild-type (WT) and HD150Q knock-in (KI) mice at 15 months of age. Note that EM48 labels more neuronal cells in the striatum than glial cells in the corpus callosum. B, EM48 immunohistochemical staining of an R6/2 mouse brain that expresses exon1 mutant htt. Glial cells in the white matter (WM) of the corpus callosum and in neuronal cells of the striatum (Str) show different extents of mutant htt accumulation. The mouse was examined at the age of 12 weeks. Scale bars, 10 μm.
Detection of cellular UPS activity using the GFPu reporter
Because the UPS plays a critical role in clearing polyQ proteins (Bence et al., 2001; Landles and Bates, 2004) and neurons contain more aggregates than glia, we hypothesized that UPS activity might differ in neuronal versus glial cells. Biochemical assays to measure the proteasomal activity of brain homogenates cannot distinguish between neuronal and glial UPS activity. We therefore used a DNA construct encoding a degron-tagged green fluorescent protein reporter, GFPu, to assess cellular UPS activity (Bence et al., 2001). This reporter is inserted into an adenoviral vector for infecting neuronal and glial cells. In addition, we coexpressed RFP, which is also inserted into the adenoviral vector but does not carry the UPS degradation signal, such that it serves as an internal control for viral expression (Fig. 2A). Because GFPu is degraded by the UPS efficiently, an increased ratio of GFPu to RFP reflects decreased UPS activity and should not be significantly influenced by transgene expression variations in different cells.
Figure 2.
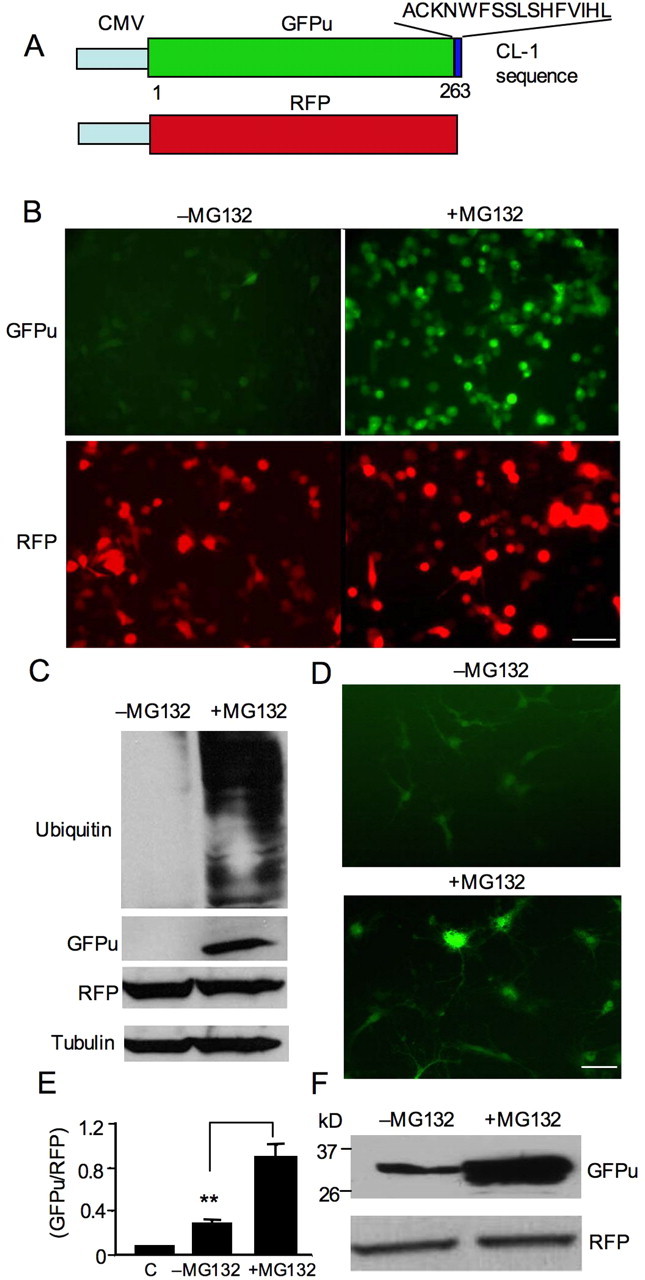
Expression of proteasomal reporters in neuronal cells. A, Schematic maps of DNA constructs for expressing fluorescent UPS reporters. GFPu is a green fluorescent protein tagged with a CL-1 degron sequence specific for ubiquitination and degradation by the proteasome. RFP serves as a control. Both GFPu and RFP were coexpressed by the cytomegalovirus (CMV) promoter in adenoviral vectors. B, Expression of GFPu/RFP in PC12 cells via adenoviral infection. Inhibiting the proteasome by MG132 (10 μm for 12 h) increased GFPu signals. C, Western blotting of the infected PC12 cells showing that MG132 treatment increased protein ubiquitination (top blot) and GFPu compared with RFP and tubulin. D, Inhibiting the proteasome by MG132 (10 μm) also increased GFPu signal in cultured primary neurons that were isolated from rat cerebral cortex and had been infected by adenoviral GFPu/RFP for 48 h. E, The ratio of GFPu to RFP in cultured cortical neurons after MG132 treatment. C, Uninfected control cells. **p < 0.01. F, Western blotting of cultured cortical neurons also showed an increased level of GFPu after proteasome inhibition by MG132. Scale bars, 10 μm.
Using these reporters, we infected PC12 cells and also treated the infected cells with the proteasome inhibitor MG132 (carbobenzoxy-l-leucyl-l-leucyl-l-leucinal) (10 μm). The result verified that the suppression of UPS activity by MG132 could significantly increase the level of GFPu (Fig. 2B). Consistent with the ability of MG132 to increase the accumulation of ubiquitinated proteins (Leitch et al., 2001), Western blotting analysis also showed increased protein ubiquitination in MG132-treated cells (Fig. 2C). To verify that the reporters can sensitively reflect UPS activity in primary neurons, we expressed the reporters in cultured primary neurons from rat cerebral cortex. After MG132 treatment, we also observed a significant increase in GFPu signals (Fig. 2D). Quantifying the ratio of GFPu to RFP indicated a preferential increase in GFPu after the UPS was inhibited by MG132 (p < 0.001) (Fig. 2E). This increase was validated by Western blots, which showed a marked elevation of GFPu compared with RFP after MG132 treatment (Fig. 2F). Thus, the ratio of GFPu to RFP represents the relative inhibition of UPS activity and can be used to measure cellular UPS function.
Differential UPS activities in cultured neuronal and glial cells
Using the fluorescent UPS reporters, we examined the UPS activity of cultured neuronal and glial cells. The cultured cells allowed us to definitively measure UPS activity in different cell types. Also, the time-dependent decline of UPS activity has been noted in a variety of cultured cells (Zhou et al., 2003; Ding et al., 2006), offering us an opportunity to compare the changes in UPS function in cultured neurons and glial cells.
We cultured rat cerebral cortical neurons for different days in vitro (8, 11, and 17 DIV) and then infected them with adenoviral GFPu/RFP reporters for 2 d (Fig. 3A). As expected, older neuronal cultures displayed a greater number of cells with higher levels of GFPu. High-magnification micrographs indicated that both GFPu and RFP were expressed in the same neurons (Fig. 3B). Quantification of the ratio of GFPu to RFP confirmed the time-dependent increase of GFPu in old cultured neurons (Fig. 3C). The GFPu/RFP ratio at day 8 was 0.09690 ± 0.01104 (n = 11) and significantly increased at day 17 (0.6948 ± 0.01855; n = 12; p < 0.001). To verify this fluorescence result, we performed Western blotting and found that GFPu is indeed increased over the culturing time, which reflects a decrease in proteasome activity (Fig. 3D).
Figure 3.
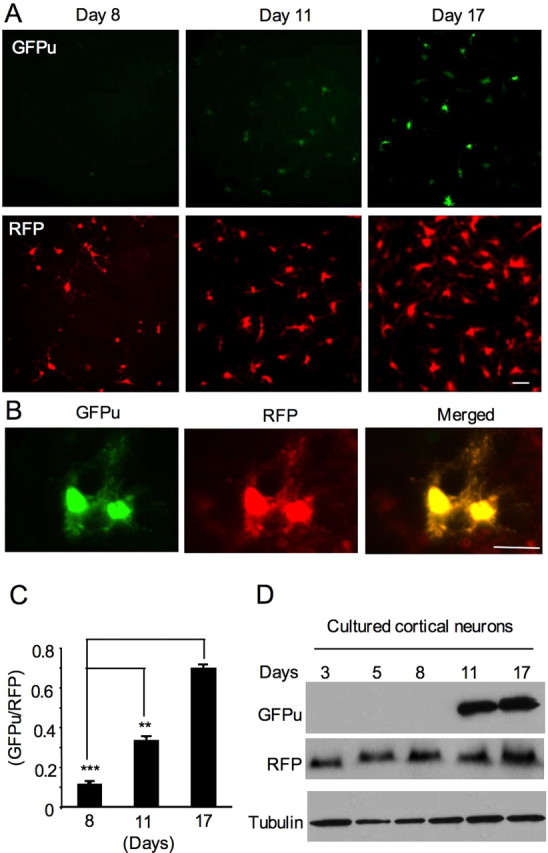
Time-dependent increase of GFPu levels in cultured primary neurons. A, Fluorescent images showing a greater increase in GFPu signal (top) than RFP (bottom) in cultured cerebral cortical neurons in a time-dependent manner. The cultured neurons at different days (8, 11, and 17 DIV) were infected by adenoviral GFPu/RFP for 2 d before examination. B, High-magnification graphs showing the expression of GFPu and RFP in the same neuron at 17 DIV. Scale bars, 10 μm. C, Quantification of the ratio (mean + SEM, n = 8–17) of GFPu to RFP in cultured primary neurons. **p < 0.01, ***p < 0.001. D, Western blot analysis showing the increased level of GFPu in old cultured neurons. The same blot was also probed with antibodies to RFP and tubulin.
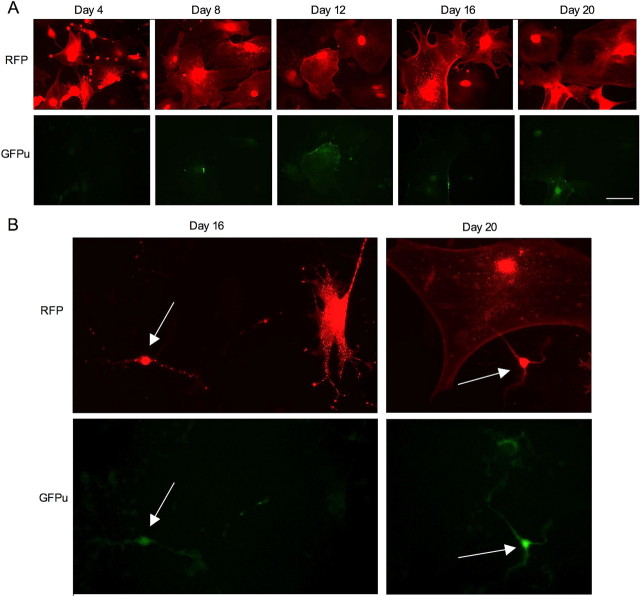
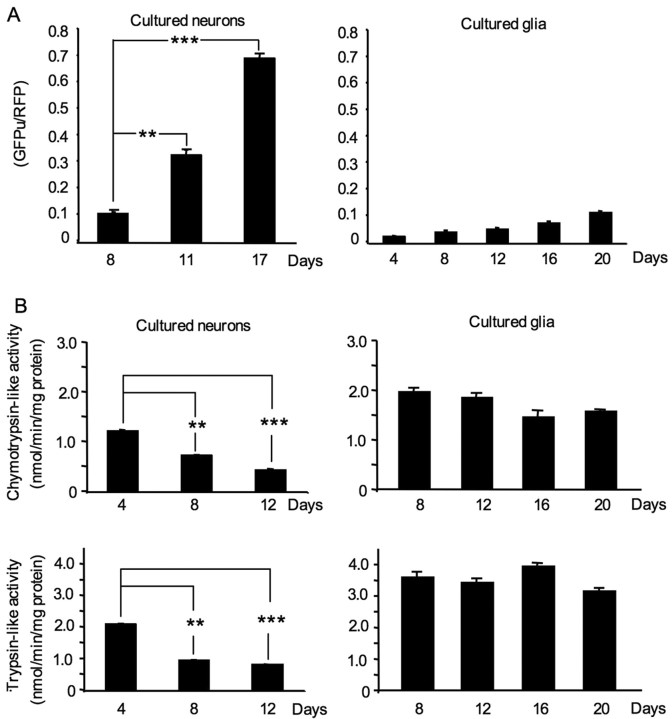
We also isolated astrocytes, the major type of glial cells, from rat cerebral cortex and cultured them for various days in vitro (4–20 DIV). Infection of these astrocytes with adenoviral GFPu/RFP reporters yielded a high level of RFP. However, the level of GFPu remained low in cultured astrocytes that had been cultured for different days (Fig. 4A). To rigorously compare the expression of GFPu in neuronal and glial cells under the same conditions, we examined the mixed cell cultures that contained both neurons and glial cells (Fig. 4B). It is clear that neurons (Fig. 4B, arrows) show stronger GFPu signals than glial cells and that the GFPu level in neuronal cells is increased from day 16 to 20 (Fig. 4B). Quantification of the GFPu/RFP ratio also confirmed that this ratio is significantly increased with time in old cultured neurons (p < 0.01) but is only slightly increased in old cultured astrocytes (Fig. 5A). To verify the results obtained with the fluorescent reporters, we performed biochemical assays to measure the proteasomal chymotrypsin-like and trypsin-like activities in lysates of cultured neurons and astrocytes using specific fluorogenic substrates. As expected, the proteasomal chymotrypsin-like and trypsin-like activities are higher in cultured glial cells than in neuronal cells. In contrast to neuronal cells, cultured astrocytes do not show a significant decrease in proteasomal activity, even after being cultured for 20 d (Fig. 5B). However, chymotrypsin-like activity in neurons at day 4 (0.9500 ± 0.01414, n = 4) was significantly reduced at day 12 (0.3406 ± 0.01511, n = 4, p < 0.001). Similarly, trypsin-like activity in cultured neurons was also decreased from day 4 (2.293 ± 0.01791, n = 4) to day 12 (0.8995 ± 0.006551, n = 4, p < 0.001). The differences in UPS activities in cultured neurons versus glial cells may reflect the intrinsic variation in UPS activities in different types of cells.
Figure 4.
Expression of GFPu/RFP in cultured astrocytes at different days of culture. A, Fluorescent images of astrocytes that had been cultured for different days (4, 8, 12, 16, and 20) and then infected by adenoviral GFPu/RFP for 2 d. Note that GFPu signals increased only slightly or remained at similar levels in older astrocytes. Scale bar, 10 μm. B, Fluorescent images of mixed cultured cells containing neurons (arrows) and astrocytes that had been cultured for 16 or 20 d and then infected by adenoviral GFPu/RFP for 2 d. Note that GFPu signal (green) is higher in neuronal cells than in glial cells.
Figure 5.
Quantitative analysis of proteasomal activities in cultured neuronal and glial cells. A, The ratios (mean + SEM, n = 8–18) of GFPu to RFP in cultured neurons or astrocytes at different culturing days. B, Biochemical assays of chymotrypsin-like and trypsin-like activities (mean + SEM) of cultured neurons and astrocytes that had been cultured for various days (4–20 d). **p < 0.01, ***p < 0.001.
Differential UPS activities in the nuclei and cytoplasm of neurons and glial cells
The fact that mutant htt preferentially accumulates in the nuclei of neurons and glia in HD mouse brains (Shin et al., 2005; Chou et al., 2008; Wang et al., 2008a) also prompted us to use the GFPu/RFP reporters to examine the UPS activity in the nuclei and cytoplasm of cultured cells. To do so, we tagged GFPu/RFP with the nuclear localization sequences (NLS) or nuclear export sequences (NES). Thus, NLS–GFPu/RFP is directed to the nucleus to measure nuclear UPS activity, whereas NES–GFPu/RFP remains in the cytoplasm to reflect cytoplasmic UPS activity. The ability of these reporters to detect nuclear or cytoplasmic UPS activity was confirmed by treating transfected glia with MG132, which increased GFPu signals in either the nucleus or cytoplasm (supplemental Fig. 1, available at www.jneurosci.org as supplemental material).
We then expressed these reporters in cultured cortical neurons and astrocytes. Nuclear NLS–GFPu signal was more intense than cytoplasmic NES–GFPu in cultured neurons (Fig. 6A). Similarly, cultured astrocytes also show more intense NLS–GFPu signal in the nucleus than NES–GFPu signal in the cytoplasm (Fig. 6B). Quantification of the GFPu/RFP ratio also confirmed that there is more accumulation of NLS–GFPu in the nucleus than NES–GFPu in the cytoplasm of glia and neurons (Fig. 6C). These findings are in agreement with the biochemical results from our previous study showing a lower level of proteasomal activity in the nuclear fraction than in the cytoplasmic fraction of mouse brain tissues (Zhou et al., 2003).
Figure 6.
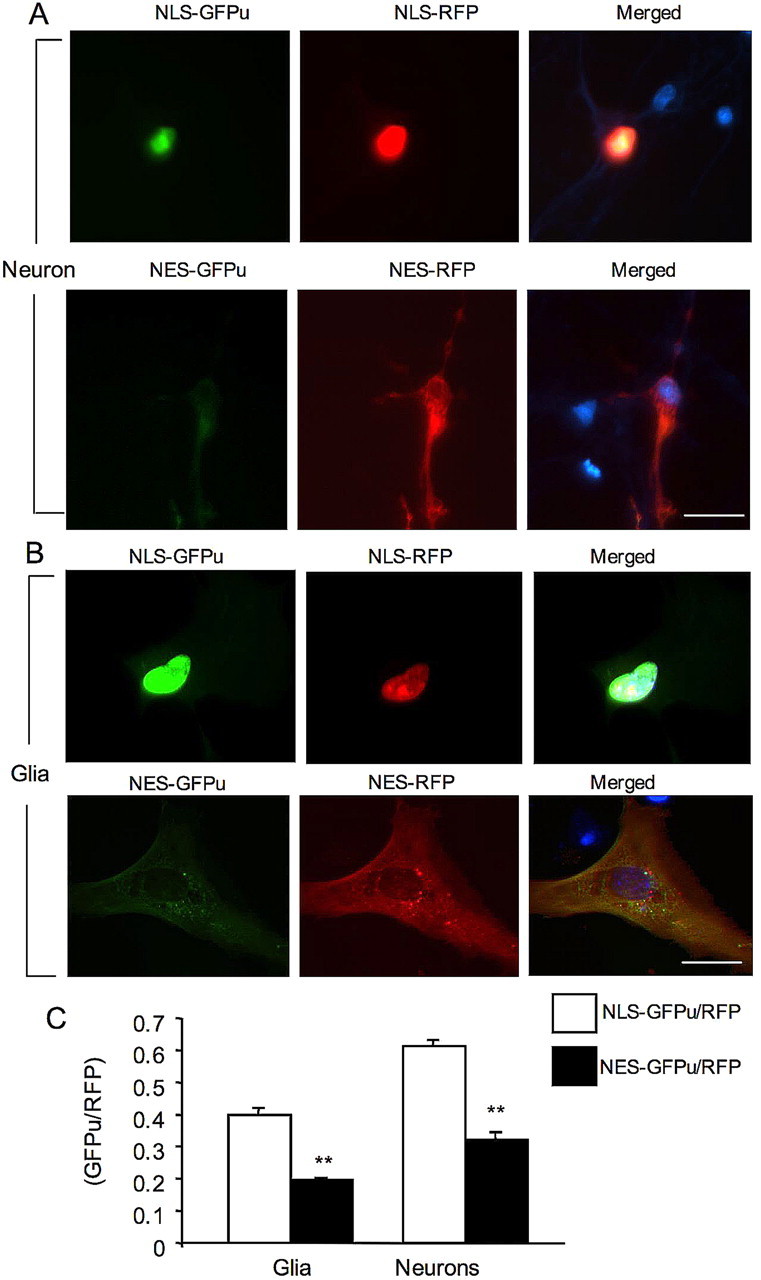
Targeting GFPu/RFP to the nucleus and cytoplasm of cultured cells. A, NLS–GFPu/RFP (top) or NES–GFPu/RFP (bottom) were transfected into cultured rat brain cortical neurons at 8 DIV. Note that nuclear NLS–GFPu is more intense than cytoplasmic NES–GFPu. B, Cultured astrocytes at 20 DIV were infected with adenoviral NLS–GFPu/RFP (top) or NES–GFPu/RFP (bottom). Note that nuclear NLS–GFPu signal is also more intense than cytoplasmic NES–GFPu. In A and B, merged images show the Hoechst-stained nuclei (blue). Scale bars, 10 μm. C, Quantification of the ratios (mean + SEM, n = 10–16) for NLS–GFPu/RFP in the nucleus and NES–GFPu/RFP in the cytoplasm in glia and neurons. **p < 0.01.
Differential UPS activities in neurons and glia in the mouse brain
Our recent studies using a biochemical assay to measure UPS activity of tissue homogenates revealed an age-dependent decrease in UPS activity (Wang et al., 2008a,b). However, it is difficult to separate glial and neuronal cells in brain tissues to measure their UPS activity, respectively. To test whether UPS activity is different in neuronal and glial cells in the brain, we performed stereotaxic injection of adenoviral GFPu/RFP into the neuronal regions (cortex and striatum) and the corpus callosum, which is enriched in glial cells. Using immunofluorescent double labeling, we verified that stereotaxic injection allowed the transgene to be expressed in neurons and glial cells (supplemental Fig. 2, available at www.jneurosci.org as supplemental material). Seven days after injection, we sectioned the mouse brains and examined GFPu/RFP signals in the injected areas using fluorescent microscopy. To determine the relationship between aging and UPS activity in the mouse brains, we injected the UPS reporters into the brains of mice at 4, 12, and 24 months of age. We found that GFPu signals are much weaker than RFP signals in the injected region, which is consistent with a previous earlier finding that the level of a transgenic fluorescence UPS reporter is barely detectable in mouse brains, perhaps because of its short half-life (Lindsten et al., 2003). Low-magnification micrographs (100×) demonstrate that GFPu signal is slightly higher in the striatum than in the glia-enriched corpus callosum of young mice at 4 months (Fig. 7A). Importantly, the GFPu signal in the striatum is increased more drastically than in the corpus callosum in old mouse brains. In the brain, neuronal nuclei are larger than glial nuclei, and this difference can be viewed by Hoechst dye staining. High-magnification micrographs clearly show that GFPu signal is increased to a greater extent in the neurons of 12-month-old mice compared with glial cells (Fig. 7B).
Figure 7.
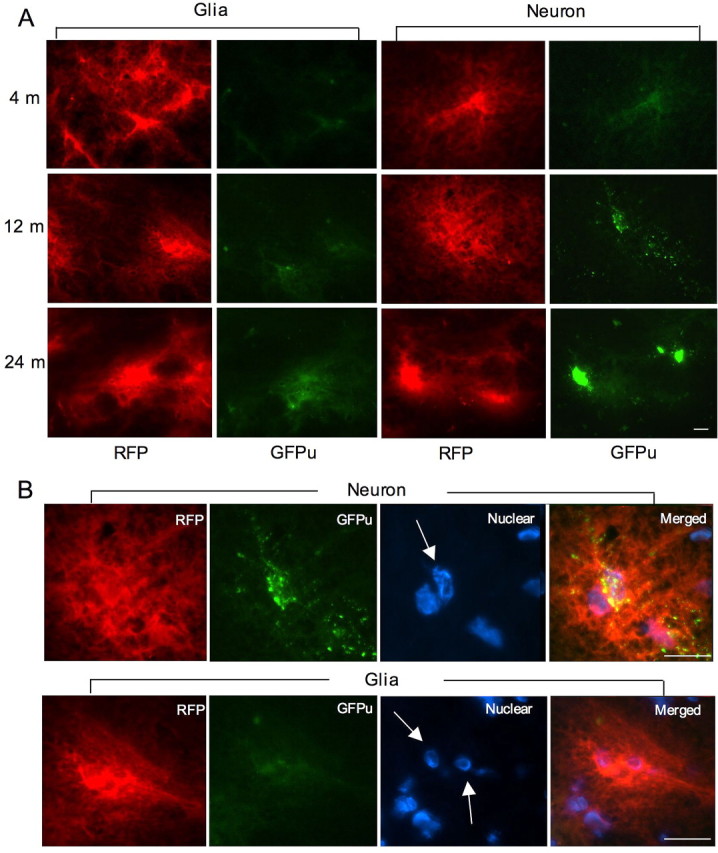
Expression of GFPu/RFP reporters in mouse brains. Stereotaxic injection of adenoviral GFPu/RFP into the white matter of the corpus callosum (glia) and the striatum (neuron) to examine their expression in glial and neuronal cells, respectively, in mice at different ages (4, 12, and 24 months). A, Low-magnification micrographs showing RFP and GFPu signals in the injected regions. Note that the neuronal level of GFPu is higher than the glial GFPu level, suggesting lower UPS activity in neuronal cells. B, High-magnification micrographs (630×) showing the distribution of GFPu and RFP in the infected neurons (top) and glial cells (bottom). Arrows indicate neuronal or glial nuclei that were labeled by Hoechst dye. Scale bars, 10 μm.
Quantitative analysis of the ratio of GFPu to RFP verified that striatal neurons have a significantly higher GFPu/RFP ratio than cortical neurons and glia (Fig. 8A), suggesting that the lower UPS activity is in the striatal neurons. Previous studies using biochemical assays also show lower proteasome activity in the striatum than in the cortex of rat and mouse brains (Zeng et al., 2005; Wang et al., 2008a). Importantly, UPS activity is higher in glia than neuronal cells, because the glial GFP/RFP ratio in the corpus callosum is lower than the neuronal GFPu/RFP ratios in the striatum and cortex. Furthermore, the age-dependent increase in GFPu is also greater in neuronal cells than glial cells (Fig. 8A).
Figure 8.
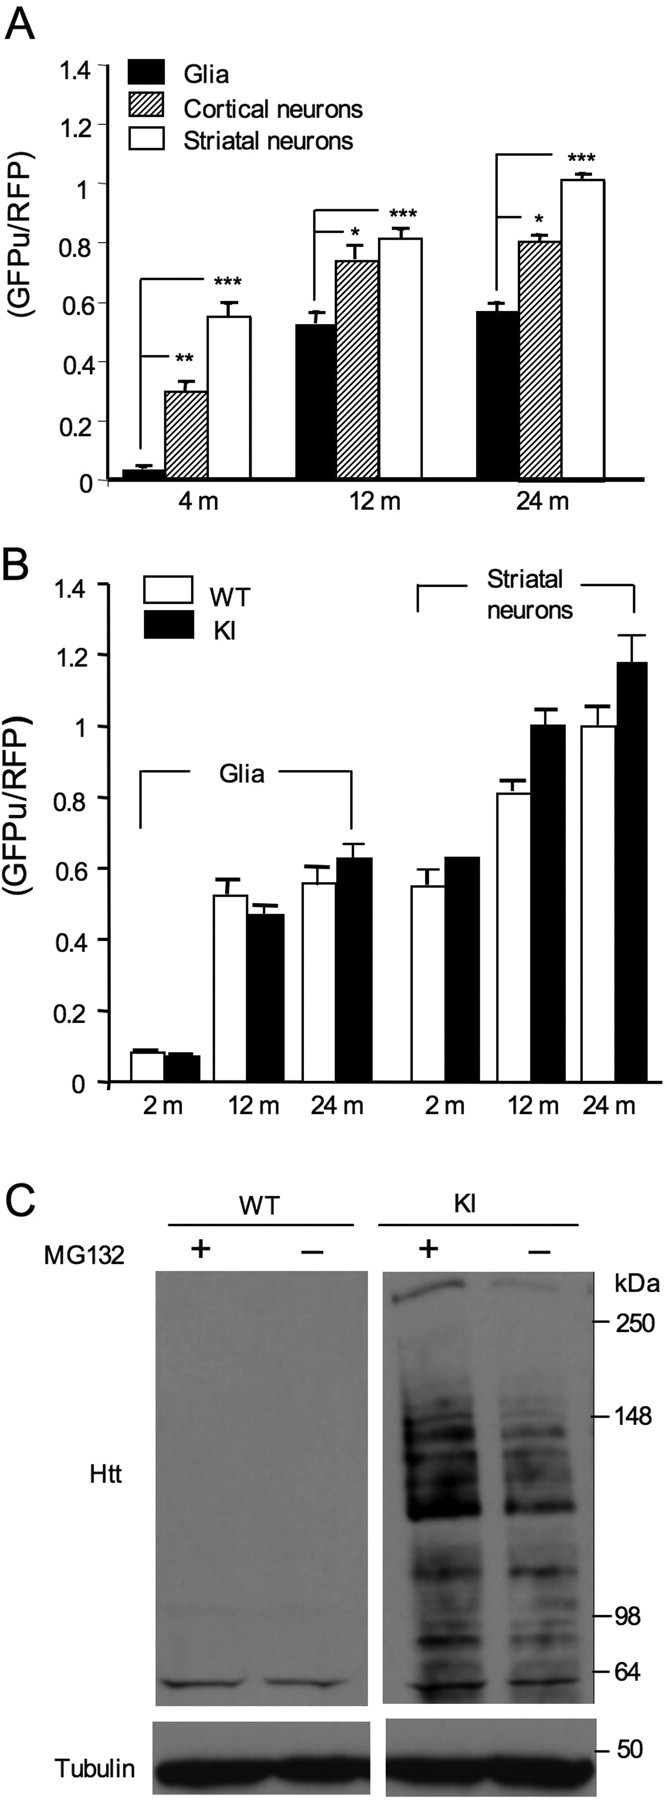
Differential UPS activities in neurons and glia. A, Quantification of the ratios of adenoviral GFPu to RFP in the infected neurons and glial cells in the brains of mice at 4, 12, and 24 months of age. The ratios of GFPu to RFP in glial cells are lower than neuronal GFPu/RFP in the striatum and brain cortex at different ages. *p < 0.05, **p < 0.01, ***p < 0.001. B, The ratios of GFPu to RFP in the glia and striatal neurons in the adenoviral GFPu/RFP-injected brains of wild-type (WT) and HD150Q knock-in (KI) mice at the age of 2, 12, and 24 months. No significant difference in the ratios of GFPu to RFP was seen between wild-type and HD150Q KI cells, although the ratio was lower in glia than neurons and increased in the old mouse brains. C, Cultured astrocytes (8 DIV) from wild-type and HD150Q KI mice were treated with MG132 (10 μm) for 12 h. The accumulation of mutant htt and its fragments, which were recognized by an antibody (1C2) specific to expanded polyQ tracts, was increased by using MG132 to inhibit the proteasome. The blots were also probed with anti-tubulin.
Decreased proteasome activity is not found in brain lysates of HD mice (Díaz-Hernández et al., 2003; Zhou et al., 2003; Bett et al., 2006; Wang et al., 2008b). To examine whether glial UPS activity differs between HD and wild-type mice, we also injected adenoviral GFPu/RFP reporters into the striatum and corpus callosum of HD150Q KI mice of different ages. Quantification of the GFPu/RFP ratio in the corpus callosum did not reveal any significant difference in glial cells between wild-type and HD150Q KI mice at 2 or 12 months of age (Fig. 8B). However, the neuronal GFPu/RFP ratio in the striatal region is slightly higher in HD mice than in wild-type mice at 12 months of age, but the difference is not statistically significant. Although the decrease in UPS activity from 2 to 12 months was more prominent in glia than neurons, the total level of UPS activity in neurons at 12 or 24 months is lower than that in glial cells (Fig. 8B). Given that neuronal cells show more accumulation of mutant htt than glial cells, it is possible that there is a cell-type-specific threshold of UPS activity for the accumulation of misfolded proteins. These results are also consistent with the in vitro finding that neuronal GFPu/RFP ratios are higher than glial GFPu/RFP ratios (Figs. 4, 5), again suggesting that neuronal UPS activity is lower than glial UPS activity.
The above results also indicate that there is an age-dependent decrease in UPS function in neuronal and glial cells in the brain. If the decreased UPS activity is associated with increased htt aggregation in glial cells, as well, we should see a greater accumulation of mutant htt in cultured glial cells after inhibiting the proteasome. Thus, we cultured astrocytes from HD150Q KI mice and treated them with MG132. The inhibition of UPS activity by MG132 markedly increased the accumulation of mutant htt and its degraded products in cultured astrocytes (Fig. 8C), suggesting that UPS function is important for preventing the accumulation of mutant htt. Together, although HD cells do not show significantly different UPS activity compared with wild-type cells, UPS activity is often higher in glial cells than neurons, and suppressing UPS function can increase the accumulation of mutant htt in glial cells.
Discussion
The selective neuronal degeneration seen in a variety of neurological disorders is associated with the accumulation of misfolded proteins in neurons. The mechanisms for this preferential accumulation of misfolded proteins and the associated neurodegeneration remain unclear. Using fluorescent reporters that can detect cellular UPS activities, here we demonstrate for the first time that UPS activity is lower in neurons than in glial cells in the brain. This has broad implications for age-dependent neurodegenerative diseases, because the lower UPS activity in neurons could account for the preferential accumulation of misfolded or toxic proteins in neurons, which is a prerequisite for mutant proteins to induce selective neurodegeneration.
In this study, we examined the cellular distribution of misfolded proteins in the brains of HD mice, because polyglutamine expansion is known to cause protein misfolding and neurodegeneration. Also, mutant htt is expressed ubiquitously in the brain and body but selectively kills neurons, providing us with an ideal model to investigate how selective neurodegeneration occurs in age-dependent neurodegenerative disorders. Previous studies have focused on the expression of mutant polyQ proteins in neurons, with scant attention paid to glial cells, perhaps because glial cells do not contain abundant polyQ aggregates or inclusions. It is likely that glial cells do express polyQ proteins but may have less capacity to accumulate mutant proteins. Understanding how neuronal and glial cells handle polyQ proteins differently is important for elucidating the pathogenesis of polyQ disorders, as well as developing effective treatments for them.
Using our established antibody EM48, which preferentially reacts with mutant htt (Gutekunst et al., 1999; Lin et al., 2001; Wang et al., 2008a), we were able to identify the accumulation of mutant htt in glial cells, which is indicated by increased EM48 nuclear staining or small aggregates in glial cells. Nevertheless, the intensity of EM48 staining and the number of glial cells containing EM48-positive labeling are less than those of neuronal cells. A logical explanation for this finding is that the abilities of neuronal and glial cells to remove misfolded proteins are different. Because the UPS plays a major role in clearing misfolded proteins, we focused on its function and asked whether differential UPS activities could account for the different accumulations of mutant proteins in neurons and glial cells.
We demonstrated that glial UPS activity is indeed higher than neuronal UPS activity. Our conclusion is based primarily on the use of the fluorescence reporter GFPu, which has been widely used to detect UPS activity in a variety of cellular and animal models (Bence et al., 2001; Dong et al., 2004; Avraham et al., 2005; Bennett et al., 2005). Although it indirectly reflects UPS activity, the fluorescent UPS reporter can be expressed in different types of cells for monitoring cellular UPS activity, which confers an advantage when examining UPS activity in neuronal and glial cells in the brain, because previous studies using brain homogenates were unable to define UPS activity in specific brain cell types. Furthermore, the corpus callosum is enriched in glial cells, allowing us to target the expression of the UPS reporters in glia by microinjection and compare their UPS activity with neuronal UPS activity in other regions in the same mouse brain section. By including an internal control (RFP) that does not carry the degradation signal, we can use the ratio of GFPu to RFP to minimize variations attributable to variable transgene expression in different types of cells; hence, we can determine the relative activity of the UPS.
Several in vitro findings also support the idea that UPS activity is higher in glial cells than neurons. First, cultured astrocytes show less GFPu signal than cultured neurons. Second, biochemical assays also demonstrate greater proteasome activity in cultured astrocytes than in cultured neurons. Furthermore, by examining the time-dependent change in the GFPu/RFP ratios in cultures that consist of both neuronal and glial cells, we found a greater increase of the GFPu/RFP ratio in older cultured neurons than glial cells. The preferential increase in GFPu or decrease in UPS activity in brain neurons with age also indicates that the neuronal UPS may be more vulnerable to aging factors than the glial UPS.
By targeting the GFPu/RFP reporters to the nucleus and cytoplasm of neurons and glial cells, we also demonstrated that nuclear UPS activity is intrinsically lower than cytoplasmic UPS activity. This finding is correlated with the preferential accumulation of polyQ proteins in the nucleus and suggests that higher cytoplasmic UPS activity may prevent the accumulation of misfolded protein and subsequent aggregate formation in the cytoplasm of neuronal cells in the brain. However, we did not find any significant change in UPS activity in neuronal and glial cells in the HD150Q KI mouse brains compared with the UPS activity in wild-type mouse brain. Although in vitro studies have shown that polyQ-expanded proteins can impair UPS activity (Bence et al., 2001; Jana et al., 2001; Venkatraman et al., 2004), biochemical assays of brain homogenates from HD mice that express exon1 (Díaz-Hernández et al., 2003; Bett et al., 2006) or full-length (Zhou et al., 2003; Wang et al., 2008b) mutant htt did not uncover any significant reduction in proteasome activity. Conversely, measurement of polyubiquitin chains revealed global changes in polyubiquination in HD mouse brains (Bennett et al., 2007). By targeting the GFPu/RFP reporters to the synapses in mouse brains, we found there is a decrease in synaptic UPS activity in HD mouse brains (Wang et al., 2008b). It seems that the outcome of the UPS activity measurement depends primarily on the functional aspects being measured and the subcellular distribution of the UPS. Using both fluorescent UPS reporters and biochemical assays, we provide compelling evidence that glial UPS activity is higher than neuronal UPS activity in cell cultures and in the mouse brain.
Although a full understanding of the differences in neuronal versus glial UPS activities would require knowledge about the fundamental differences in the biological properties of neurons and glia, some possible explanations can be offered here. Because neurons are nondividing cells, it may be that cell division provides an opportunity for cells to remove misfolded proteins. This can also explain why polyQ and other misfolded proteins do not accumulate in non-neuronal cells. Another possibility is that glial cells maintain a high level of UPS activity to cope with various insults and cellular stresses. For example, astrocytes can be activated by a number of such insults and stresses. They are also able to proliferate and produce various trophic factors and inflammation mediators, processes that involve increased metabolism and protein synthesis as well as turnover (Hertz et al., 2007; Rossi et al., 2007). Accordingly, the intrinsically high level of UPS activity in glial cells prevents the accumulation of mutant htt. The fact that fewer glial cells show htt aggregates than neuronal cells in HD mouse brains also lends support to the idea that glial cells can more efficiently clear misfolded proteins.
Because aging increases cellular oxidative stress, which can damage the UPS (Farout and Friguet, 2006; Breusing and Grune 2008), the age-dependent decline in UPS activity in neuronal and glial cells can lead to the accumulation of mutant htt and htt aggregate formation in old HD mouse brains. Cultured neuronal cells may be more vulnerable to oxidative stress and aging-related factors than neurons in the brain, and their increased vulnerability could contribute to the rapid decline of UPS activity seen in cultured neurons under the in vitro conditions. However, comparison of the GFPu/RFP ratios in neurons and glia in mice at 2 months of age also reveals a markedly increased accumulation of GFPu or decreased UPS activity in neurons (Fig. 8B). The intrinsic lower UPS activity in neurons also has implications for the selective neurodegeneration in other neurological disorders, such as Alzheimer's and Parkinson's diseases, which are caused by misfolded proteins. Given that neuronal cells are affected in these age-dependent neurological disorders and that their UPS activity is lower than in the less vulnerable glia, it is possible that boosting UPS function in neuronal cells could alleviate neuropathology. Because neuron–glia interactions are critical for the normal function and viability of neurons, reducing the age-dependent decline in UPS activity or maintaining a normal UPS level in glial cells should also be beneficial for ameliorating the neuropathology caused by misfolded proteins.
Footnotes
This work was supported by National Institutes of Health Grants AG019206, NS041669 (X.-J.L.), NS045016 (S.L.), and Predoctoral Fellowship AG026804-02 (S.T.). We thank Jianjun Wang at Emory University for technical assistance, Ron Kopito at Stanford University for providing GFPu plasmid, and Cheryl Strauss for critical reading of this manuscript.
References
- Avraham E, Szargel R, Eyal A, Rott R, Engelender S. Glycogen synthase kinase 3beta modulates synphilin-1 ubiquitylation and cellular inclusion formation by SIAH: implications for proteasomal function and Lewy body formation. J Biol Chem. 2005;280:42877–42886. doi: 10.1074/jbc.M505608200. [DOI] [PubMed] [Google Scholar]
- Barres BA, Barde Y. Neuronal and glial cell biology. Curr Opin Neurobiol. 2000;10:642–648. doi: 10.1016/s0959-4388(00)00134-3. [DOI] [PubMed] [Google Scholar]
- Bence NF, Sampat RM, Kopito RR. Impairment of the ubiquitin-proteasome system by protein aggregation. Science. 2001;292:1552–1555. doi: 10.1126/science.292.5521.1552. [DOI] [PubMed] [Google Scholar]
- Bennett EJ, Bence NF, Jayakumar R, Kopito RR. Global impairment of the ubiquitin-proteasome system by nuclear or cytoplasmic protein aggregates precedes inclusion body formation. Mol Cell. 2005;17:351–365. doi: 10.1016/j.molcel.2004.12.021. [DOI] [PubMed] [Google Scholar]
- Bennett EJ, Shaler TA, Woodman B, Ryu KY, Zaitseva TS, Becker CH, Bates GP, Schulman H, Kopito RR. Global changes to the ubiquitin system in Huntington's disease. Nature. 2007;448:704–708. doi: 10.1038/nature06022. [DOI] [PubMed] [Google Scholar]
- Bett JS, Goellner GM, Woodman B, Pratt G, Rechsteiner M, Bates GP. Proteasome impairment does not contribute to pathogenesis in R6/2 Huntington's disease mice: exclusion of proteasome activator REGgamma as a therapeutic target. Hum Mol Genet. 2006;15:33–44. doi: 10.1093/hmg/ddi423. [DOI] [PubMed] [Google Scholar]
- Breusing N, Grune T. Regulation of proteasome-mediated protein degradation during oxidative stress and aging. Biol Chem. 2008;389:203–209. doi: 10.1515/BC.2008.029. [DOI] [PubMed] [Google Scholar]
- Chou SY, Weng JY, Lai HL, Liao F, Sun SH, Tu PH, Dickson DW, Chern Y. Expanded-polyglutamine huntingtin protein suppresses the secretion and production of a chemokine (CCL5/RANTES) by astrocytes. J Neurosci. 2008;28:3277–3290. doi: 10.1523/JNEUROSCI.0116-08.2008. [DOI] [PMC free article] [PubMed] [Google Scholar]
- Ciechanover A. Proteolysis: from the lysosome to ubiquitin and the proteasome. Nat Rev Mol Cell Biol. 2005;6:79–87. doi: 10.1038/nrm1552. [DOI] [PubMed] [Google Scholar]
- Davies SW, Turmaine M, Cozens BA, DiFiglia M, Sharp AH, Ross CA, Scherzinger E, Wanker EE, Mangiarini L, Bates GP. Formation of neuronal intranuclear inclusions underlies the neurological dysfunction in mice transgenic for the HD mutation. Cell. 1997;90:537–548. doi: 10.1016/s0092-8674(00)80513-9. [DOI] [PubMed] [Google Scholar]
- Demartino GN, Gillette TG. Proteasomes: machines for all reasons. Cell. 2007;129:659–662. doi: 10.1016/j.cell.2007.05.007. [DOI] [PubMed] [Google Scholar]
- Díaz-Hernández M, Hernández F, Martín-Aparicio E, Gómez-Ramos P, Morán MA, Castaño JG, Ferrer I, Avila J, Lucas JJ. Neuronal induction of the immunoproteasome in Huntington's disease. J Neurosci. 2003;23:11653–11661. doi: 10.1523/JNEUROSCI.23-37-11653.2003. [DOI] [PMC free article] [PubMed] [Google Scholar]
- DiFiglia M, Sapp E, Chase KO, Davies SW, Bates GP, Vonsattel JP, Aronin N. Aggregation of huntingtin in neuronal intranuclear inclusions and dystrophic neurites in brain. Science. 1997;277:1990–1993. doi: 10.1126/science.277.5334.1990. [DOI] [PubMed] [Google Scholar]
- Ding Q, Dimayuga E, Keller JN. Proteasome regulation of oxidative stress in aging and age-related diseases of the CNS. Antioxid Redox Signal. 2006;8:163–172. doi: 10.1089/ars.2006.8.163. [DOI] [PubMed] [Google Scholar]
- Dong X, Liu J, Zheng H, Glasford JW, Huang W, Chen QH, Harden NR, Li F, Gerdes AM, Wang X. In situ dynamically monitoring the proteolytic function of the ubiquitin-proteasome system in cultured cardiac myocytes. Am J Physiol Heart Circ Physiol. 2004;287:H1417–H1425. doi: 10.1152/ajpheart.01233.2003. [DOI] [PubMed] [Google Scholar]
- Farout L, Friguet B. Proteasome function in aging and oxidative stress: implications in protein maintenance failure. Antioxid Redox Signal. 2006;8:205–216. doi: 10.1089/ars.2006.8.205. [DOI] [PubMed] [Google Scholar]
- Gusella JF, Macdonald ME. Huntington's disease: see the pathogenic process through a genetic lens. Trends Biochem Sci. 2006;31:533–540. doi: 10.1016/j.tibs.2006.06.009. [DOI] [PubMed] [Google Scholar]
- Gutekunst CA, Li SH, Yi H, Mulroy JS, Kuemmerle S, Jones R, Rye D, Ferrante RJ, Hersch SM, Li XJ. Nuclear and neuropil aggregates in Huntington's disease: relationship to neuropathology. J Neurosci. 1999;19:2522–2534. doi: 10.1523/JNEUROSCI.19-07-02522.1999. [DOI] [PMC free article] [PubMed] [Google Scholar]
- Hertz L, Peng L, Dienel GA. Energy metabolism in astrocytes: high rate of oxidative metabolism and spatiotemporal dependence on glycolysis/glycogenolysis. J Cereb Blood Flow Metab. 2007;27:219–249. doi: 10.1038/sj.jcbfm.9600343. [DOI] [PubMed] [Google Scholar]
- Jana NR, Zemskov EA, Wang Gh, Nukina N. Altered proteasomal function due to the expression of polyglutamine-expanded truncated N-terminal huntingtin induces apoptosis by caspase activation through mitochondrial cytochrome c release. Hum Mol Genet. 2001;10:1049–1059. doi: 10.1093/hmg/10.10.1049. [DOI] [PubMed] [Google Scholar]
- Landles C, Bates GP. Huntingtin and the molecular pathogenesis of Huntington's disease. Fourth in molecular medicine review series. EMBO Rep. 2004;5:958–963. doi: 10.1038/sj.embor.7400250. [DOI] [PMC free article] [PubMed] [Google Scholar]
- Leitch V, Agre P, King LS. Altered ubiquitination and stability of aquaporin-1 in hypertonic stress. Proc Natl Acad Sci U S A. 2001;98:2894–2898. doi: 10.1073/pnas.041616498. [DOI] [PMC free article] [PubMed] [Google Scholar]
- Li S, Li XJ. Multiple pathways contribute to the pathogenesis of Huntington disease. Mol Neurodegener. 2006;1:19. doi: 10.1186/1750-1326-1-19. [DOI] [PMC free article] [PubMed] [Google Scholar]
- Li SH, Li XJ. Huntingtin-protein interactions and the pathogenesis of Huntington's disease. Trends Genet. 2004;20:146–154. doi: 10.1016/j.tig.2004.01.008. [DOI] [PubMed] [Google Scholar]
- Lin CH, Tallaksen-Greene S, Chien WM, Cearley JA, Jackson WS, Crouse AB, Ren S, Li XJ, Albin RL, Detloff PJ. Neurological abnormalities in a knock-in mouse model of Huntington's disease. Hum Mol Genet. 2001;10:137–144. doi: 10.1093/hmg/10.2.137. [DOI] [PubMed] [Google Scholar]
- Lindsten K, Menéndez-Benito V, Masucci MG, Dantuma NP. A transgenic mouse model of the ubiquitin/proteasome system. Nat Biotechnol. 2003;21:897–902. doi: 10.1038/nbt851. [DOI] [PubMed] [Google Scholar]
- Martin JB, Gusella JF. Huntington's disease. Pathogenesis and management. N Engl J Med. 1986;315:1267–1276. doi: 10.1056/NEJM198611133152006. [DOI] [PubMed] [Google Scholar]
- Mitchell PJ, Hanson JC, Quets-Nguyen AT, Bergeron M, Smith RC. A quantitative method for analysis of in vitro neurite outgrowth. J Neurosci Methods. 2007;164:350–362. doi: 10.1016/j.jneumeth.2007.04.021. [DOI] [PubMed] [Google Scholar]
- Orr HT, Zoghbi HY. Trinucleotide repeat disorders. Annu Rev Neurosci. 2007;30:575–621. doi: 10.1146/annurev.neuro.29.051605.113042. [DOI] [PubMed] [Google Scholar]
- Rossi DJ, Brady JD, Mohr C. Astrocyte metabolism and signaling during brain ischemia. Nat Neurosci. 2007;10:1377–1386. doi: 10.1038/nn2004. [DOI] [PMC free article] [PubMed] [Google Scholar]
- Shin JY, Fang ZH, Yu ZX, Wang CE, Li SH, Li XJ. Expression of mutant huntingtin in glial cells contributes to neuronal excitotoxicity. J Cell Biol. 2005;171:1001–1012. doi: 10.1083/jcb.200508072. [DOI] [PMC free article] [PubMed] [Google Scholar]
- Venkatraman P, Wetzel R, Tanaka M, Nukina N, Goldberg AL. Eukaryotic proteasomes cannot digest polyglutamine sequences and release them during degradation of polyglutamine-containing proteins. Mol Cell. 2004;14:95–104. doi: 10.1016/s1097-2765(04)00151-0. [DOI] [PubMed] [Google Scholar]
- Vonsattel JP, Myers RH, Stevens TJ, Ferrante RJ, Bird ED, Richardson EP., Jr Neuropathological classification of Huntington's disease. J Neuropathol Exp Neurol. 1985;44:559–577. doi: 10.1097/00005072-198511000-00003. [DOI] [PubMed] [Google Scholar]
- Wang CE, Tydlacka S, Orr AL, Yang SH, Graham RK, Hayden MR, Li S, Chan AW, Li XJ. Accumulation of N-terminal mutant huntingtin in mouse and monkey models implicated as a pathogenic mechanism in Huntington's disease. Hum Mol Genet. 2008a;17:2738–2751. doi: 10.1093/hmg/ddn175. [DOI] [PMC free article] [PubMed] [Google Scholar]
- Wang J, Wang CE, Orr A, Tydlacka S, Li SH, Li XJ. Impaired ubiquitin-proteasome system activity in the synapses of Huntington's disease mice. J Cell Biol. 2008b;180:1177–1189. doi: 10.1083/jcb.200709080. [DOI] [PMC free article] [PubMed] [Google Scholar]
- Zeng BY, Medhurst AD, Jackson M, Rose S, Jenner P. Proteasomal activity in brain differs between species and brain regions and changes with age. Mech Ageing Dev. 2005;126:760–766. doi: 10.1016/j.mad.2005.01.008. [DOI] [PubMed] [Google Scholar]
- Zhou H, Cao F, Wang Z, Yu ZX, Nguyen HP, Evans J, Li SH, Li XJ. Huntingtin forms toxic NH2-terminal fragment complexes that are promoted by the age-dependent decrease in proteasome activity. J Cell Biol. 2003;163:109–118. doi: 10.1083/jcb.200306038. [DOI] [PMC free article] [PubMed] [Google Scholar]


