Abstract
In rapid scan EPR the changing magnetic field creates a background signal with components at the scan frequency and its harmonics. The amplitude of the background signal increases with scan width and is more significant for weak EPR signals such as are obtained in the presence of magnetic field gradients. A procedure for distinguishing this background from the EPR signal is proposed, mathematically described, and tested for various experimental conditions.
1. Introduction
Rapid scan EPR is being developed as an alternative to continuous wave (CW) and pulse methods, with potential for applications in EPR imaging [1-5]. Triangular magnetic field scans that are wider than the spectral width excite all spins twice per scan cycle. Direct detection permits digitization of both the real and imaginary components of the EPR signal. Spectra in the presence of a magnetic field gradient can be obtained with better signal-to-noise ratios (SNR) than by standard CW techniques, where signal broadening limits the modulation amplitude that can be used and where the amplitude of the gradient-broadened spectrum decreases quadratically with gradient [1, 3]. The effectiveness of the rapid scan method approaches that of pulse EPR, and can be applied to signals for which T2* is too short for electron spin echo (ESE) detection. A limitation of rapid scan EPR for imaging experiments or weak signals is the presence of a background (BG) signal that is the result of interaction between the scanning field, the external magnetic field, and the resonator. The background was observed to consist of a sum of sinusoids with frequencies that are multiples of the scan frequency, with various phases, and with amplitudes that decrease with frequency. The background signal increased with increasing scan width and magnetic field at the center of the scan (the center field). Increased background was observed for some frequencies, and mounting the coils more rigidly decreased the background. Both of these observations are consistent with mechanical interaction (microphonics) [6].
In each type of EPR spectroscopy, background corrections are specific to the experiment. In traditional CW EPR, baseline variation is minimized by using narrow band excitation and lock-in phase sensitive detection at the modulation frequency. Background signals are subtracted as needed for weak and/or broad signals. Baseline effects may result from paramagnetic impurities in the resonator and from mechanical instability of the modulation coils and resonator. In pulse ESE, off-resonance signals are used to correct for artifacts in the detection system, and phase cycling is used to correct for imperfections in pulses or to select a desired echo [7]. For rapid scan EPR a background correction method is needed that is based on the source of the background signal and ways in which it can be distinguished from the EPR signal. Since post-processing phase corrections require accurate lineshapes for both the absorption and dispersion signals, the background removal method must work for both. If the background is independent of the main magnetic field, the problem could be solved by measuring the off-resonance signal and subtracting it from the on-resonance one. However, this approach proved to be problematic. Firstly, the background signal changes both in intensity and shape with external magnetic field, which is attributed to changes of forces on the resonator and/or variation of mechanical vibrations of the scan coils caused by the scanning field. Secondly, the background sometimes is time dependent. In studies at 1200 MHz of the radiation induced EPR signal in teeth, a microphonic signal was observed that varied with experimental settings [6]. This signal was removed by subtracting the average of spectra of the empty cavity recorded before and after recording the spectrum of the sample. This approach has the disadvantage that it increases the time for data acquisition. An alternative approach is proposed: signals are recorded at two different center fields, with scans that are wide enough to encompass the full spectrum. The offset in center field is much less than the sweep width. Data acquisition is alternated between the two center fields. The result is two signals with offset EPR lines and very similar background. This approach solves three problems. (i) Since the signal is present in both scans, no time is ‘lost’ acquiring background scans that contain no signal. (ii) The time delay between the two “offset” spectra is small enough to minimize the effects of time dependence. (iii) The field offset is small enough that there is negligible impact on the background. What is then needed is a method to separate the background from the EPR signal. The proposed method, its implementation, and evaluation are described in this manuscript.
2. Samples
Powdered 1:1 complex of organic radical α,γ-bisdiphenylene-β-phenylallyl with benzene (BDPA, Aldrich Chemical Co.) (2.18 mg) was mixed with 50 g finely ground KCl. A portion of the solid was placed in a 1 mm ID capillary supported in a 4 mm OD quartz tube. A second portion was placed directly in a 4 mm OD quartz tube. The two tubes were supported in a 10 mm OD quartz tube. The resulting space between the centers of the two samples is 4 mm. Measurement of the slow-scan spectrum on a narrow scan showed that the full-width at half height of the EPR signal for this sample was 1.07 G. This linewidth is large enough and T2 short enough that rapid scan oscillations were not observed under the conditions of these experiments.
At 250 MHz the trityl-CD3 radical has T2 = 8 μs [2]. A 0.2 mM aqueous solution of trityl in a 10 mm OD quartz tube was deoxygenated by purging with nitrogen gas and flame sealed. The full-width at half height of the EPR signal for this sample was 31 mG.
3. Spectroscopy
Rapid scan EPR experiments were performed with a 250 MHz EPR spectrometer that is built around a Bruker Elexsys console and has locally designed and built bridge, magnet, and resonators [8]. The triangular scans were generated with a locally-designed driver and scan coils. The linearity of the scans is high. For example, the deviation from linearity over the central 85% of a scan is less than 0.04% for a scan width of 60 G at 10 kHz scan frequency [9]. For the BDPA sample the scan widths were 20 G and the scan frequency was 1 kHz. Signals were filtered by a 4th order digital low-pass Krohn-Hite Model 3955 Butterworth filter with 300 kHz cutoff frequency. For the trityl sample the scan widths were 2.0 G, the scan frequency was 2.12 kHz, and the cutoff frequency was 500 kHz. The EPR spectrum of the BDPA sample with good SNR and relatively insignificant background was measured first. This accurate spectrum permits a comparison with the results of the background-subtracted weaker signal. Then, to reduce the signal intensity relative to the background, the sample tube was positioned such that only a small part of the sample was in the resonator. Off-resonance signals were measured with the magnetic center field decreased by 20 G. To permit determination of the impact of the offset of the center fields between the two scans on the effectiveness of the background correction algorithm, data were recorded at 12 different fields between 89.4 and 93.8 G. Data acquisition was alternated between center fields 40 times, with 1024 scans averaged each time. Thus data at each center field were averaged 40,960 times. Data for BDPA also were acquired in the presence of a magnetic field gradient of 7.2 G/cm.
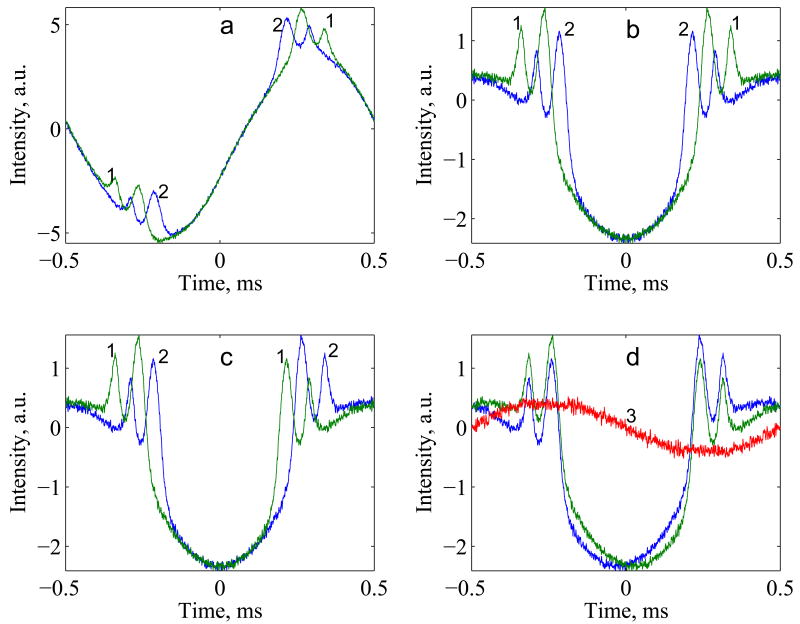
Signals obtained were deconvolved with the function a(t) = exp(ibt2/2) [1, 10]. The parameter b is the scan rate in s-2, which equals γ b′ where γ is the magnetogyric ratio and b′ is the scan rate in G/s. For a 20 G scan at 1 kHz (BDPA) b′ = 40 kG/s and for a 2 G scan at 2.12 kHz (trityl) b′ = 8.48 kG/s [1]. The deconvolution does not change the intensities of harmonics in the background although it changes the phases. The results of the deconvolution are shown in Fig. 1a for a sample in the presence of a gradient, where the background is large relative to the EPR signal. Trace 1 (green) has the larger center field and trace 2 (blue) has the lower center field. Time 0 is the center of the triangular scan. The time interval between the resonances in the two traces is equal to τ = field offset/b′. For the data in Figure 1 the field offset was 2 G so τ = 0.050 ms. Although the EPR signals are offset, the background is similar in the two traces.
Figure 1.
Demonstration of the background removal procedure. The data were obtained for 2 tubes containing BDPA in the presence of a magnetic field gradient, with scan widths of 20 G (a) Absorption signals recorded with center fields offset by 2.0 gauss; (b) symmetric parts of the two signal obtained by combining the up and down half cycles (Eq. 3); (c) Interchange of the second half cycles for traces 1 and 2; (d) shift of the signal towards each other by half the center field offset. The red line is the background signal calculated by subtracting the two shifted traces.
4. Background removal algorithm
The background removal algorithm is based on an understanding of the differences between the EPR and background components in the rapid scan signals, which are recorded at constant RF frequency. (i) The positions of the EPR lines depend on the center field. (ii) After deconvolution the EPR lines for the first half cycle (up-scan) and the second half cycle (down-scan) have mirror symmetry relative to the mid-point in the scan (t = 0) (Figure 1a). (iii) Changing the center field preserves mirror symmetry relative to the mid-point between two half-cycles (Fig. 1a). (iv) The background is a superposition of a few harmonics of the scanning frequency with unknown amplitudes and phases. For this method to work, a small offset in external field must have negligible impact on the background signal.
Rapid scan signals are averaged thousands of times, and the acquisition of each new signal is synchronized with the scanning field. Components, including random noise, that are not repeated with each period of the scan, are reduced by the square root of the number of scans relative to the EPR and background components, which are reproduced in each cycle. Periodic signals can be represented as a Fourier sum of sine and cosine functions with unknown amplitudes ak and bk and frequencies that are integer multiples of the scanning frequency, f. The goal of the removal algorithm is to calculate these amplitudes for the experimental background (BG).
| (1) |
where N is the number of harmonics.
The deconvolved rapid scan signal Y(t) consists of three components:
| (2) |
EPR spectra for up and down scans have mirror symmetry with respect to the mid-point in the scan EPR(t)=EPR(-t). By combining signal(t) and signal(-t) one can obtain the symmetrical part of Y(t), which is Ys(t):
| (3) |
This procedure does not alter the EPR-related information, but eliminates the asymmetric part of the background (Fig. 1b), so Eq.(1) simplifies to:
| (4) |
If the asymmetric part dominates, this procedure significantly improves the appearance of EPR spectra, even at this first stage of the algorithm. For the data shown in Fig. 1 application of Eq. (3) decreases the amplitude of the background signal by a factor of 3 (Fig. 1b) relative to the original data, Fig. 1a. Another advantage of this procedure is that it reduces the random noise level relative to the EPR signal by a factor of .
To permit separation of the background from the EPR signal, the data points at times 0 to T/2 (T is the period of the rapid scan cycle) in trace 1 are swapped with the corresponding points in trace 2. The result is shown in Fig. 1c. This procedure does not affect the background, but changes the positions of EPR lines. The two signals are then cyclically shifted toward each other by τ/2, so that the positions of the EPR lines coincide (Fig. 1d). Data points removed from one end of the signal are moved to the other end of the cycle, so that the array remains the same length. This procedure is mathematically valid, because of the cyclic nature of the signal. The difference between the two traces contains only background information that can be expressed as:
| (5) |
where 2M is the number of points per cycle. Based on the trigonometric expression cos(x+y)=cos(x)cos(y)-sin(x)sin(y), one can rewrite Eq.(5) as:
| (6) |
where
| (7) |
The unknown amplitudes Ak can be found from x(t) (Fig.1d, red curve 3) using the following formula:
| (8) |
and the amplitudes of the components of the background signal, ak, can be calculated from Eq.(7).
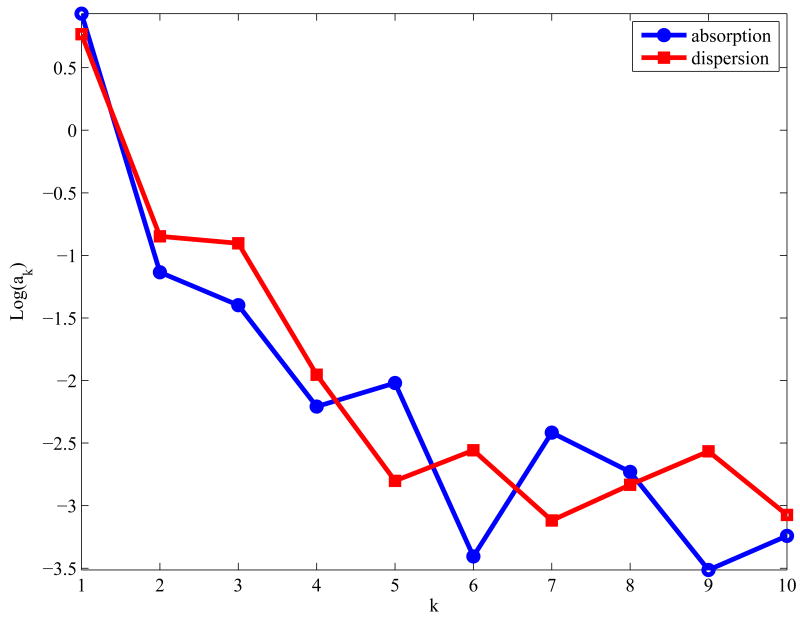
Figure 2 shows values of ak for the background signals in the absorption (Fig. 1d) and dispersion signals for the BDPA samples in the presence of a gradient. The figure demonstrates that the first few harmonics dominate the background. For k > ∼ 5 the amplitudes are reduced by about 4 orders of magnitude and are comparable to the noise in the data. Including too many harmonics in the background reconstruction increases noise. For noisier data, a smaller number of harmonics may be distinguishable above the noise level.
Figure 2.
Values of log(ak) (Eq. (7) for the background in the absorption (red squares) and dispersion (blue circles) signals. The lines connect the points for the discrete values.
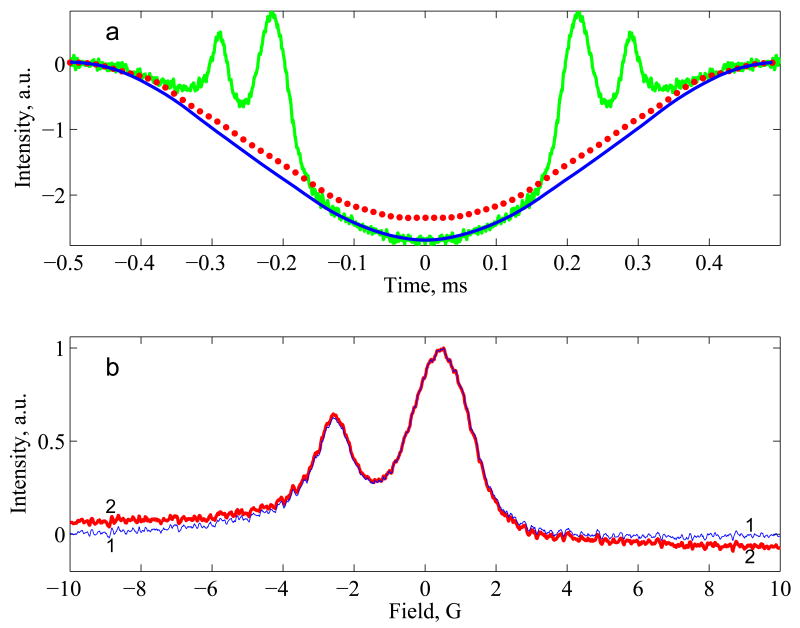
Amplitudes ak are substituted into Eq. [4] to obtain the calculated background signal that is used to find the EPR signal via Eqn. (2). The background obtained for the data shown in Figs.1, 2 is the solid noise-free (blue) line in Fig. 3a. An off-resonance background recorded with a 20 G offset of center field (Fig. 3a red dotted) was filtered to eliminate components with frequencies higher than five times the scan frequency. In Fig. 3 the off-resonance background is compared with the reconstructed background signal (noise-free blue line) and the experimental signal (green line). This comparison demonstrates that changing the center field by 20 G alters the amplitude, more than the shape of the background signal. The EPR signal obtained by subtracting the different estimates of the background from trace 1 in Fig. 1b and converting the x-axis from time to gauss is shown in Fig. 3b. The spectrum obtained by subtraction of the off-resonance background (Fig. 3b, trace 2) has a residual baseline slope that is not present when the reconstructed baseline is used in the subtraction (Fig. 3b, trace 1). For this absorption spectrum the residual slope could be removed by polynomial fit of the regions where intensities of EPR line is negligibly small, which are the beginning and the end of the curve. However, if the magnetic field changed the background in a more non-linear way, the fitting would fail to eliminate distortion. Moreover, the baseline correction for the dispersion component of the EPR spectrum is a more challenging problem. At the edges of the scan the signal often is not negligibly small, and one cannot use polynomial fitting to subtract the residual background component. Accurate background correction of both the absorption and dispersion components is needed for phase correction of the absorption signal.
Figure 3.
(a) Comparison of the experimental signal (green) with the reconstructed background (solid blue), and the off-resonance background (dotted red). (b) Spectra obtained by subtraction of the reconstructed background (trace 1, blue) or the off-resonance background (trace 2, red) from the experimental signal (Fig. 1b, trace 1).
The effectiveness of the proposed background removal procedure depends on the size of the magnetic field offset relative to the scan widths. If the offset is too small, values of αk also become very small and the result obtained by Eq. (9)
| (9) |
is contaminated by the kth harmonic of the random noise. This is especially true for the case k = 1, because the denominator has the smallest magnitude.
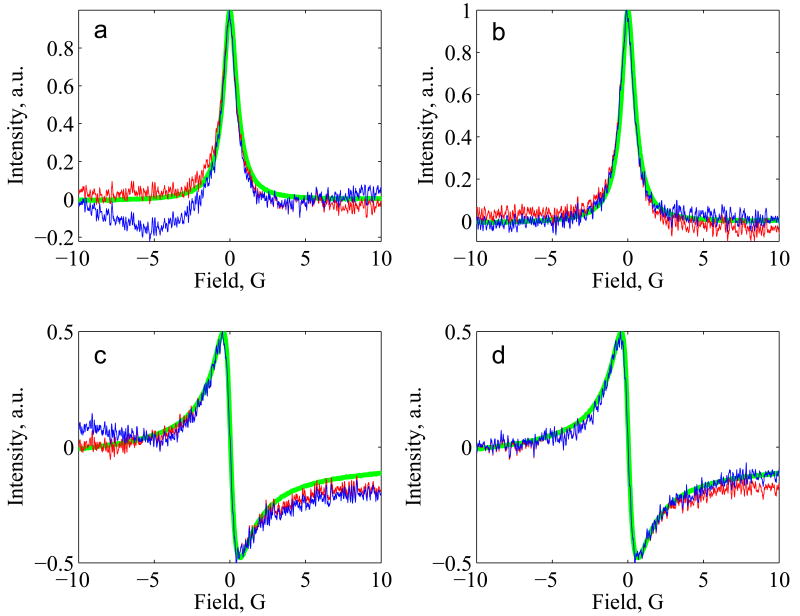
Figure 4 demonstrates the differences in the results of the background removal procedure for the BDPA sample for 0.4 and 2 G offsets in the center field. Dispersion and absorption spectra are distorted when the center field offset is about 2% (0.4 G) of scan width. Distortions become smaller as the offset increases and essentially disappear when the offset is about 10%. Further increasing the offset does not significantly improve baseline removal and requires wider scans.
Figure 4.
Comparison of absorption (a,b) and dispersion (c,d) spectra of BDPA obtained by subtraction of the reconstructed background (blue curves) or off-resonance background subtraction (red curves), with spectra of BDPA with negligible noise and background components (green curves). Data with a center field offset of 0.4 G were used to calculate spectra in (a, c) and data with a center field offset of 2 G were used to spectra in (b,d).
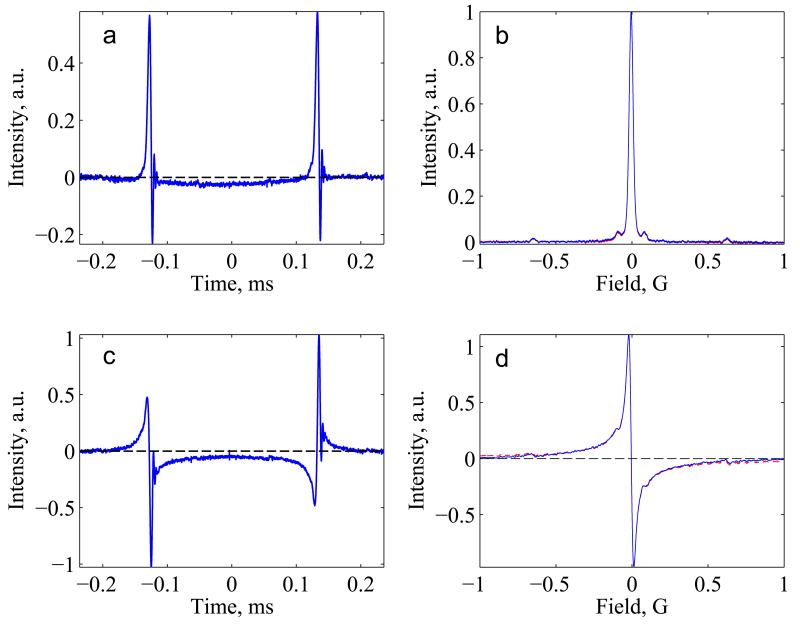
To test the impact of deconvolution on the background removal procedure, data for trityl-CD3 in water were acquired with 2 G scans and a center field offset of 0.2 G (Fig. 5). The scans were fast enough to cause rapid-scan oscillations on the narrow trityl line (Fig. 5a,c). The background signals are very small for these narrow scans. Deconvolution followed by application of the background removal procedure gave well defined absorption and dispersion spectra, including the weak 13C hyperfine lines (Fig. 5b,d). For these relatively narrow scans subtraction of an off-resonance scan has approximately the same impact as the background removal procedure (Fig. 5b,d), but unlike the proposed algorithm requires acquisition of scans that do not improve signal-to-noise.
Figure 5.
Absorption and dispersion rapid-scan signals for trityl-CD3 (a,c), that show the deviation of the baseline from a constant (dashed) line. Deconvolution followed by the background removal procedure gave the blue (solid) lines (b,d). Subtraction of an off-resonance background trace gave the red (dashed) lines (b,d), which is nearly superimposable on the trace obtained by the background removal procedure.
5. Summary
Rapid scan EPR spectra have a background signal that is induced by the scans and becomes significant in the case of broad scan widths and weak signals. In principle, the background can be removed by subtraction of an off-resonance signal. However, this signal depends on the magnitude of the main magnetic field. In addition acquiring off-resonance signals reduces the time-efficiency of the experiment and may increase noise if the off-resonance signal is not smoothed. An alternate procedure was developed that combines scans that are wide enough to encompass the full spectrum, and are obtained with center fields that differ by about 10% of the scan width. The difference between the two scans is used to define a fit-function for the background signal that can be subtracted from the experimental data without degrading the signal-to-noise.
Acknowledgments
This work was supported by NIH NIBIB grants EB000557 (GRE and SSE) and by EB002034 (Howard Halpern, PI), by Russian Science Support Foundation grants 06-03-32175, 04-03-97514, by the Program “Leading Scientific Schools” NSh 6213.2006.2, and by the CRDF grant (BRHE program) (MT).
Footnotes
Publisher's Disclaimer: This is a PDF file of an unedited manuscript that has been accepted for publication. As a service to our customers we are providing this early version of the manuscript. The manuscript will undergo copyediting, typesetting, and review of the resulting proof before it is published in its final citable form. Please note that during the production process errors may be discovered which could affect the content, and all legal disclaimers that apply to the journal pertain.
References
- 1.Joshi JP, Ballard JR, Rinard GA, Quine RW, Eaton GR. Rapid-Scan EPR with Triangular Scans and Fourier Deconvolution to Recover the Slow-Scan Spectrum. J Magn Reson. 2005;175:44–51. doi: 10.1016/j.jmr.2005.03.013. [DOI] [PubMed] [Google Scholar]
- 2.Stoner JW, Szymanski D, Eaton SS, Quine RW, Rinard GA, Eaton GR. Direct-Detected Rapid-Scan Epr at 250 MHz. J Magn Res. 2004;170:127–135. doi: 10.1016/j.jmr.2004.06.008. [DOI] [PubMed] [Google Scholar]
- 3.Tseitlin M, Dhami A, Eaton SS, Eaton GR. Comparison of Maximum Entropy and Filtered Back-Projection Methods to Reconstruct Rapid-Scan EPR Images. J Magn Res. 2007;184:157–168. doi: 10.1016/j.jmr.2006.09.027. [DOI] [PMC free article] [PubMed] [Google Scholar]
- 4.Tseitlin M, Dhami A, Quine RW, Rinard GA, Eaton SS, Eaton GR. Electron Spin T2 of a Nitroxyl Radical at 250 Mhz Measured by Rapid Scan EPR. Appl Magn Reson. 2006;30:651–656. [Google Scholar]
- 5.Joshi JP, Eaton GR, Eaton SS. Impact of Resonator on Direct-Detected Rapid-Scan EPR at 9.8 Ghz. Appl Magn Reson. 2005;29:239–249. [Google Scholar]
- 6.Iwasaki A, Walczak T, Grinberg O, Swartz HM. Differentiation of the Observed Low Frequency (1200 MHz) EPR Signals in Whole Human Teeth. Appl Radiat Isotop. 2005;62:133–139. doi: 10.1016/j.apradiso.2004.08.038. [DOI] [PubMed] [Google Scholar]
- 7.Schweiger A, Jeschke G. Principles of Pulse Electron Paramagnetic Resonance. Oxford University Press; Oxford: 2001. [Google Scholar]
- 8.Quine RW, Rinard GA, Eaton SS, Eaton GR. A Pulsed and Continuous Wave 250 MHz Electron Paramagnetic Resonance Spectrometer. Magn Reson Engineer. 2002;15:59–91. [Google Scholar]
- 9.Quine RW, Czechowski T, Eaton GR. A Linear Magnetic Field Scan Driver. Magn Reson Engineer. 2008 doi: 10.1002/cmr.b.20128. submitted for publication. [DOI] [PMC free article] [PubMed] [Google Scholar]
- 10.Dadok J, Sprecher RF. Correlation NMR Spectroscopy. J Magn Reson. 1974;13:243–248. [Google Scholar]


