

Abstract
A new S-nitrosothiol (RSNO) detection strategy based on an electrochemical sensor is described for rapidly estimating levels of total RSNOs in blood and other biological samples. The sensor employs a cellulose dialysis membrane covalently modified with an organoselenium catalyst that converts RSNOs to NO at the distal tip of an amperometric NO sensor. The sensor is characterized by very low detection limits (< 20 nM), good long-term stability and can be employed for the rapid detection of total low molecular weight (LMW) RSNO levels in whole blood samples using a simple standard addition method. A strategy for detecting macromolecular RSNOs is also demonstrated via use of a transnitrosation reaction with added LMW thiols allowing the estimation of total RSNO levels in blood. The sensor is shown to exhibit high selectivity over nitrosamines and nitrite. Such RSNO detection is potentially useful to reveal correlation between blood RSNO levels and endothelial cell dysfunction, which often is associated with cardiovascular diseases.
Keywords: S-Nitrosothiols, Transnitrosation, Organoselenium catalyst, Amperometric nitric oxide sensor, Cellulose dialysis membrane
1. Introduction
S-Nitrosothiols (RSNOs) represent the major form of circulating nitric oxide (NO) metabolites in vivo (Giustarini et al. 2003). Recent studies have suggested that plasma RSNO levels can serve as markers for assessing endothelial cell (EC) dysfunction (Heiss et al. 2006), which is a hallmark for cardiovascular disease, and often leads to atherosclerosis (Bonetti et al. 2003). Failure in the storage and/or delivery of NO by means of RSNOs has been implicated in EC dysfunction and an associated risk of heart attack, stroke, hypertension, and diabetes (Braam and Verhaar 2007; Feletou and Vanhoutte 2006; Heiss et al. 2006; Ignarro 2002; Miller and Megson 2007). Hence, the monitoring of endogenous RSNO levels in blood is of great interest for diagnosing vascular disease as well as assessing the benefits of potential treatments (Heiss et al. 2006).
Various assay methods have been developed for determination of physiological RSNO levels (Cook et al. 1996; Giustarini et al. 2007; Gow et al. 2007; MacArthur et al. 2007; Noble and Williams 2001); however, more reliable and simple methods of analysis are still needed largely due to the inherent instability (e.g., toward trace metal ions and light exposure) of these compounds. Recently, we developed a series of electrochemical/amperometric RSNO sensors based on various immobilized catalysts (e.g., Cu(I/II)-complex, glutathione peroxidase (GPx), organoselenium (RSe) and organotellurium (RTe) compounds) (Cha et al. 2005; Cha and Meyerhoff 2006b; Hwang et al. 2008; Musameh et al. 2006). It has been demonstrated that these sensors enable direct RSNO detection in complex physiological samples (e.g., whole blood, (Cha and Meyerhoff 2006b)). Typically, a thin catalyst layer (e.g., a cross-linked RSe hydrogel layer) is created between the tip of an underlying amperometric NO sensor and a protective outer dialysis membrane (DM). The reaction between the catalyst layer and RSNOs releases NO that is subsequently detected by the underlying NO sensor (see Fig. 1A below for typical sensor configuration). The proposed reaction mechanism requires catalyst activation steps (rxns 1 and 2, see below) (Cha and Meyerhoff 2007). It should be noted that due to the molecular-weight cut-off (MWCO) of the applied DM all previous RSNO sensors can selectively detect low-molecular-weight (LMW) RSNO species, but not macromolecular RSNOs, e.g., S-nitrosoalbumin (AlbSNO).
Fig. 1.

(a) Proposed amperometric S-nitrosothiol sensor configuration. a: Ag wire for Ag/AgCl reference electrode; b: Pt wire sealed in glass capillary as the working electrode; c: sensor housing (PP); d: internal solution; e: O-ring; f: PTFE gas-permeable membrane with TeflonAF® coating; g: dialysis membrane modified with Se-catalyst (RSeDM); (b) Schematic representation of the cellulose backbone structure of dialysis membrane following the coupling reaction with selenocystamine and subsequent treatment with GSH/GSNO.
Reactions 1-4.

In this study, the sensitivity of RSe-based RSNO sensors is enhanced significantly (> 5 fold) by covalently immobilizing the RSe catalyst to the polymer structure of the outer cellulose DM, thereby simplifying sensor configuration, without requiring a separate inner cross-linked RSe-PEI hydrogel layer as used previously (Cha and Meyerhoff 2006b). It will be shown that this new design also exhibits the capability of detecting macromolecular RSNOs (i.e., AlbSNO) with reasonable response times when using exogenous cysteine as a reducing agent for the catalytic reaction. The mechanisms of the improved sensitivity toward both low MW and macromolecular RSNOs are discussed in detail, as is the sensor’s lifetime and selectivity over nitrosamines and nitrite.
2. Materials and methods
2.1 Materials
Dialysis membranes (Spectra/Por 7, MWCO = 50 kDa) were purchased from Spectrum Laboratories Inc. (Rancho Dominguez, CA). Cysteine, glutathione (GSH), bovine serum albumin (BSA), ethylenediamine tetraacetic acid (EDTA) and sodium periodate (> 99%) were products of Sigma-Aldrich (St. Louis, MO) and were used as received. Sodium cyanoborohydride and N-nitroso-L-proline were also used as received from Acros Organics (Morris Plains, NJ) and TRC Inc. (North York, ON, Canada), respectively. Selenocystamine (SeCA) was synthesized as described in the literature (Gunther and Mautner 1964; Kalyman 1965). RSNOs were synthesized by nitrosating sulfhydryl groups of corresponding thiols in acidified nitrite solution as described elsewhere (Cha and Meyerhoff 2007). Buffers as well as all other solutions employed in this work were prepared in the laboratory from Milli-Q grade deionized water (18.2 MΩ, Millipore Corp., Billerica, MA).
2.2 Organoselenium catalyst immobilization on cellulose dialysis membrane (DM)
All pieces of DM used in this study were pre-soaked at least overnight in 1 mM EDTA solution to remove trace metal contaminants before use. Then, the cellulose backbone of DM was first oxidized in 10 mM NaIO4 solution for 1.5 h to create dialdehydes (from diols of glucopyranose units (Kim et al. 2000)), and subsequently reacted with SeCA (10 mM unless otherwise noted) for 1 h in 0.1 M MOPS buffer (pH 7.6). By then adding sodium cyanoborohydride to the reaction mixture, the Schiff-base linkage created from reaction between aldehydes and amines (of SeCA) was further reduced for 6 h to form the desired C-N single bonds. Fresh RSe-immobilized DMs (RSeDM) were further soaked in 100 μM GSNO and 200 μM GSH for 2 h before use so that any uncoupled halves of the diselenide (SeCA) species can be effectively removed (see Rxn. 1, above). The resultant RSeDMs were used in two weeks while stored at 4 °C in PBS. Control DMs were also prepared in the exact same manner except that no SeCA was employed in the coupling step.
2.3 Fabrication of amperometric NO/RSNO sensors
The proposed RSNO sensor is based on an NO(g) sensor configuration that we reported previously and is shown in Fig. 1A (Lee et al. 2004). Platinum wire (0.5 mm diameter, Sigma-Aldrich (St. Louis, MO)) was employed to prepare a planar working electrode sealed in a glass capillary. To minimize ammonia interference, the microporous PTFE gas permeable membrane (PTFE-GPM) was treated in advance with 0.5 μL TeflonAF® (DuPont Fluoroproducts, Wilmington, DE) after mounting on the tip of sensor body (Cha and Meyerhoff 2006a). Finally, the new RSNO sensor was constructed by attaching a wet piece of RSeDM prepared as described above to the outside of the PTFE-GPM with an O-ring. For the control NO sensor, a blank dialysis membrane without the immobilized catalyst was used to assemble the device. All subsequent calibrations and measurements were performed at the applied potential, + 0.75 V vs. Ag/AgCl.
2.4 Amperometric detection with NO and RSNO sensors
Amperometric responses from both the NO and RSNO sensors were collected via a multi-channel potentiostat (Biostat®, ESA Biosciences Inc., Chelmsford, MA) and associated software. The slopes of calibration curves obtained during NO calibration or RSNO measurement are denoted as (amperometric) sensitivity with units expressed in nA/μM or pA/nM. All sensor responses illustrated in figures were collected by using the same NO or RSNO sensor for the experiment. Other experimental conditions were as reported earlier (Cha et al. 2005). The influence of thiol reducing agents on the RSNO sensor sensitivity was examined by using two endogenous thiols, GSH and cysteine. The RSNO sensor’s capability of detecting macromolecular AlbSNO was examined using different cysteine concentrations.
2.5 Detection of RSNOs in blood
Detailed procedures for blood sampling and RSNO detection in blood were same as described in prior reports (Cha et al. 2005; Cha and Meyerhoff 2006b). Briefly, the amperometric responses from two sensors (RSNO and control) were collected simultaneously by adding a known amount of whole blood into PBS solution (pH 7.3) containing a thiol (100 μM, after final blood addition). Once the amperometric responses from both sensors (NO and RSNO sensors) reached steady-state after the blood injection, a standard addition of GSNO (typically, 1-3 μM in the diluted blood) was employed to calculate the blood RSNO concentration. To compare the effect of thiol species, a pair of measurements using one of the reducing thiols (GSH or cysteine) each time was implemented consecutively (approximately within 1 h) with freshly drawn blood sample from the same animal.
2.6 Standard addition method for endogenous RSNO concentration determination
For each measurement, the RSNO concentration in blood is calculated according to the following two equations.
| (1) |
| (2) |
where DF represents the dilution factor of blood sample; ΔISNO and ΔINO are the changes in current response due to the blood addition for the RSNO and NO sensors, respectively; ΔI*NO is the normalized ΔINO based on Eq. 2 to reflect inherent disparity between two sensors’ sensitivities for detecting NO; SSNO, GSNO is the RSNO sensor sensitivity (or the slope of calibration curve) toward GSNO added into the diluted blood; SSNO, NO and SSNO, NO refer to both RSNO and NO sensor sensitivities obtained during the previous calibration of NO in buffer, respectively. Hence, the measured RSNO concentrations are based on the whole blood volume (see sample calculation in Supplemental Information Fig. S1).
3. Results and discussion
3.1 RSNO decomposition by RSeDM
The RSeDM obtained from the optimized reaction procedure exhibits reproducible heterogeneous NO generation from RSNO species as measured by chemiluminescence (see Supplemental Information Fig. S2). Only RSeDM, not a control dialysis membrane, can produce a significant amount of NO when inserted into solutions containing a given RSNO and a reducing thiol. This proves that immobilized RSe sites are required for NO generation. In addition, most RSe sites bound on cellulose backbone appear to exist in the form of selenenyl-sulfide or diselenide (i.e., RSe-SG or RSe-SeR; see Fig. 1B) species immediately after the GSH/GSNO pretreatment step because in the absence of any added thiol reducing agent, the RSeDM produces only a limited amount of NO from the reaction with RSNO (data not shown).
3.2 Amperometric detection of RSNOs with RSeDM-based sensors
As illustrated in Fig. 1A, an amperometric RSNO sensor can be readily prepared by attaching a piece of the new RSeDM material over the PTFE-GPM of a planar type NO sensor. Sensitivity for detecting NO observed during the calibration process is very close to that of the control sensor with blank DM (see Supplemental Information Fig. S3A). This suggests that the membrane pore structure of the RSeDM materials remains nearly intact after modification, and NO diffusion is quite similar for both the control DM and the RSeDM materials. However, only the sensor fabricated with the RSeDM outer membrane can yield significant amperometric response to RSNOs; the control sensor with a blank DM produces negligible amperometric response under the same conditions (see Supplemental Information Fig. S3B). This result indicates that the RSNO decomposition only occurs within the RSeDM membrane mounted at the distal end of the RSNO sensor and a fraction of the NO generated can diffuse through the PTFE-GPM and oxidize at the inner platinized Pt working electrode (to nitrate).
Range of detection and sensitivity
The range of detection of this new type of RSNO sensor spans from ca. 20 nM to several μM levels of RSNOs (see Supplemental Information Figs. S3B and S4). As expected, the sensitivity is found to vary depending on the amount of RSe sites bound on DM, which can be controlled by changing SeCA concentration during the catalyst coupling reactions (see Supplemental Information Fig. S5). One noticeable enhancement is that at highest catalyst loading, the sensitivity can be increased up to ~ 1 nA/μM compared to that of the previous sensor (~ 0.04 nA/μM, based on cross-linked RSe-PEI hydrogel as the catalytic layer (Cha and Meyerhoff 2006b)). This leads to a much lower limit of detection; less than 20 nM for GSNO and CySNO as illustrated in Fig. 2A (based on S/N ratio of 3). In part, such improvement in sensitivity is associated with the sensor’s simplified outer bimembrane configuration, consisting of the PTFE-GPM and RSeDM membranes, without additional thick diffusion barrier (e.g., cross-linked RSePEI hydrogel (Cha and Meyerhoff 2006b)). Hence, NO generated within RSeDM from analyte RSNOs creates a steeper concentration gradient and larger flux of NO through the underlying GPM and to the Pt working electrode.
Fig. 2.
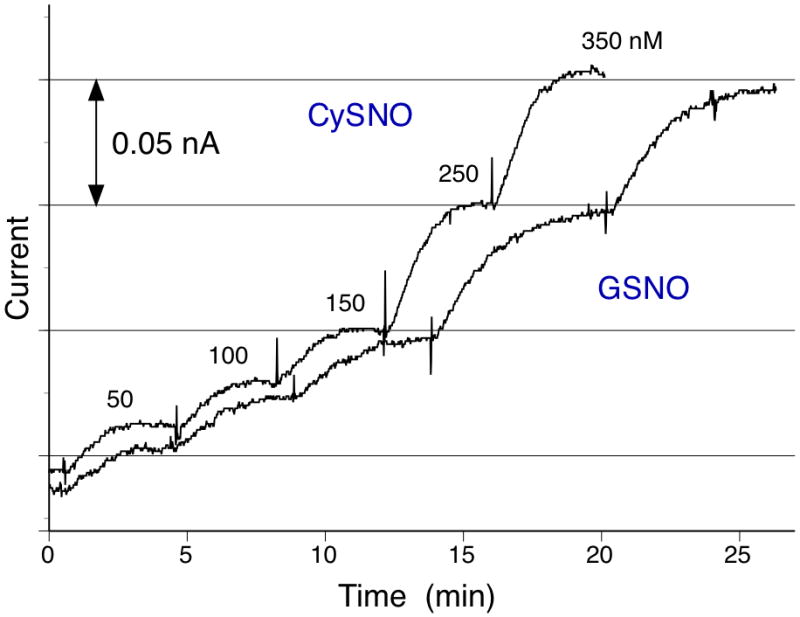
Amperometric responses of RSeDM-based RSNO sensor toward CySNO and GSNO in the low concentration range. All tests were carried out in PBS (pH 7.3) containing GSH (50 μM) and EDTA (0.1 mM) at room temperature.
Selectivity and stability
The new RSeDM-based RSNO sensors exhibit excellent selectivity against common ionic interfering species; for example, nitrite and ascorbate added in test solutions result in about six orders of magnitude lower current responses than those observed for NO (see Supplemental Information Fig. S6A). Moreover, the additional TeflonAF® coating applied to the microporous PTFE-GPM imparts enhanced NO(g) selectivity against nitrite and ammonia (NH3, in equilibrium with ammonium ions (NH4+)), major interferents present in biological samples (Cha and Meyerhoff 2006a). The potential interference from N-nitrosamines (one form of metabolic NO-adducts) was also examined. Amperometric signal from N-nitroso-L-proline is approximately four orders of magnitude lower than that of GSNO, with only minimal current changes observed up to 300 μM N-nitroso-L-proline (see Supplemental Information Fig. S6B). This demonstrates the high selectivity of the immobilized RSe catalyst for reducing only RSNOs, not other nitroso compounds.
The long-term stability of the RSNO sensor sensitivity was also examined by periodically calibrating sensor response toward GSNO in the presence of 100 μM GSH. The results revealed very stable sensor performance for 2 weeks (see Supplemental Information Fig. S7), reflecting the stable NO generating catalytic activity of the immobilized RSe species. Even after 1 month, there is still useful sensor sensitivity, despite gradual loss in response after the first two weeks of use (data not shown).
3.3 Influence of thiol reducing agents
The effects of different thiol reducing agents and their concentration were also investigated by adding either cysteine or glutathione into the test buffer and monitoring amperometric responses toward endogenous RSNO species (CySNO and GSNO as LMW RSNOs and AlbSNO as a model S-nitrosoprotein). At low thiol levels, amperometric sensitivity increases depending on the added thiol concentration (see Supplemental Information Fig. S8). Since Rxn. 2 (see above), in which the reactive selenol/selenolate is generated, is viewed as a rate-determining step (Cha and Meyerhoff 2007; Mugesh and Singh 2000; Sarma and Mugesh 2008), the overall NO production is expected to depend on the reducing agent levels within the reaction medium. However, such sensitivity enhancement saturates at higher thiol concentration (> ~ 50 μM, see Fig. S8). Therefore, to exploit the sensor’s maximal sensitivity for RSNO measurements, a high concentration of thiol (50 ~ 100 μM) was chosen throughout the study unless otherwise noted.
More importantly, the sensor’s sensitivity significantly varies depending on the specific thiol chosen as a reducing agent. Figs. 3A and 3B clearly demonstrate that employing cysteine leads to about a 2-fold increase in sensitivity for detection of GSNO and to an even greater extent for AlbSNO, compared to use of GSH (see next section for the detailed discussion regarding AlbSNO detection via use of cysteine). Similarly, for CySNO detection, the use of cysteine also induces a 2-fold enhancement in sensitivity (data not shown). In fact, both CySNO and GSNO are detected with almost identical sensitivities when the same thiol species is used as the reducing agent (e.g., GSH or cysteine). Such uniform amperometric sensitivity toward various LMW RSNO species is useful to determine total LMW RSNOs directly in whole blood samples (Cha and Meyerhoff 2006b).
Fig. 3.
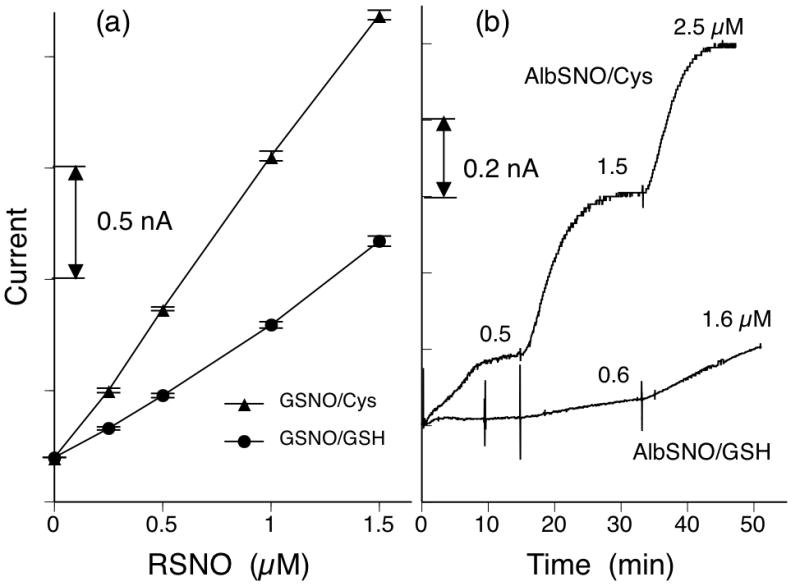
Influence of given thiol reducing agent on the amperometric response of RSeDM-based RSNO sensor toward (a) GSNO; (b) AlbSNO. In (a), more than three measurements were carried out at each data point for statistics of error bars. All results were obtained under the same test condition with PBS (pH 7.3) containing cysteine or GSH (50 μM) and EDTA (0.1 mM) at room temperature, except the use of 100 μM thiol concentration in (b). Background current levels are adjusted for comparison.
We hypothesize that three factors can contribute to such thiol dependent sensitivity changes. First, due to the lower molecular weight of cysteine compared to GSH (cysteine MW = 121.1 and GSH MW = 307.3), cysteine exhibits more facile diffusion into the DM matrix and likely creates a higher steady-state concentration of reducing agent within the RSeDM film and consequently more reactive selenol/selenolate sites within the catalytic membrane. Second, since thiolate anions rather than thiols are believed to be the actual species responsible for reduction of selenenyl-sulfides (as well as diselenides), the same concentration of cysteine with a lower pKa (8.30 vs. 8.75 of GSH (Wang et al. 2001)) can produce more selenols/selenolates compared to GSH (Mugesh and Singh 2000). Third, the intermediate RSe-SCy species possesses a less sterically hindered molecular structure and may undergo a more facile reduction compared to the RSe-SG, which has a tri-peptide linked sulfide group. In summary, with a given amount of bound catalyst on the DM, the steady-state selenol/selenolate concentration, ([RSeH/RSe-]) is apparently a key parameter determining the amperometric sensitivity of RSNO sensors. Hence, the higher sensitivity with cysteine as the added reducing agent as shown in Fig. 3 suggests that [RSeH/RSe-]Cy is higher than [RSeH/RSe-]GSH within the RSeDM.
3.4 S-Nitrosoalbumin detection and transnitrosation
The lower trace of Fig. 3B illustrates the sluggish current response for macromolecular AlbSNO detection with GSH as the added reducing agent. In contrast, when using cysteine as the added reducing agent, a rapid and near-quantitative current change occurs in response to added AlbSNO (see upper trace of Fig. 3B). Such capability of detecting AlbSNO directly from the solution (in the presence of cysteine) is encouraging since previous sensor designs only allow the determination of LMW RSNO species, primarily due to the MWCO of the outer dialysis membrane employed.
As illustrated in Fig. 4, at any level of cysteine tested, amperometric responses toward AlbSNO additions reach a plateau with time and these current changes are considerably higher than those obtained when GSH is employed as the added reducing reagent (at 100 μM GSH, the current keeps drifting with no clear steady-state level; see Fig. 3B). In addition, the response time (the time required to achieve 95% of the steady-state current level) becomes much faster as the cysteine concentration in solution increases. Further, if the amperometric sensitivities toward AlbSNO are calculated based on the signals shown in Fig. 4, this sensitivity is approximately 90 % of that for the direct GSNO response (data not shown). All these observations strongly suggest that the species being detected in the response shown in Fig. 4 is actually a LMW RSNO, very likely CySNO, created via transnitrosation between AlbSNO and cysteine.
Fig. 4.
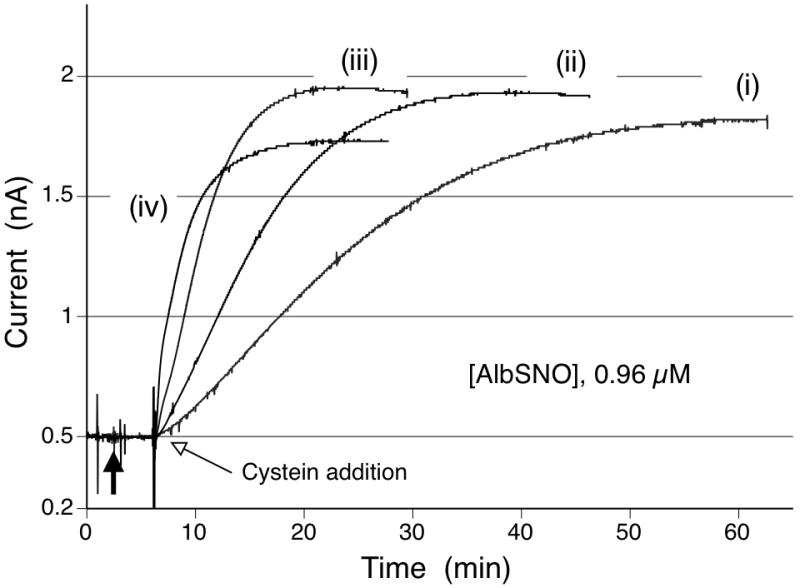
Varying RSNO sensor’s response time during AlbSNO detection depending on cysteine concentration; (i) 10 μM, (ii) 25 μM, (iii) 100 μM, (iv) 300 μM in test solution (PBS, pH 7.3) containing 0.96 μM AlbSNO and 0.1 mM EDTA at room temperature.
S-Transnitrosation is an equilibrium reaction where nucleophilic substitution of the nitrosonium (NO+) group occurs via the reaction of a thiolate anion and an RSNO species (see Rxn. 5 below) (Barnett et al. 1994; Barnett et al. 1995; Hogg 1999). The reaction rate for transnitrosation depends on the pKa of thiol species; as a result, the rate constants reported for transnitrosation with cysteine are 2-4 times higher than those for GSH (Barnett et al. 1994; Barnett et al. 1995; Hogg 1999). In fact, the transnitrosation between AlbSNO and LMW thiols (especially with cysteine) is a facile process partially due to the pKa of Cys-34 of albumin, ~ 8.1 (for HSA) that is close to those of LMW thiols (Gordge et al. 1996; Noble and Williams 2001), and its forward and backward reaction are reversible indicating that AlbSNO behaves much like a LMW RSNO (Hogg 1999; Jourd’heuil et al. 2000; Zhang and Means 1996).
Reaction 5.

The addition of an excess amount of thiol (R’SH) into a solution containing the RSNO can drive the equilibrium to the right (Rxn. 5) to create R’SNO. Due to the second-order reaction rate of the NO+ exchange reaction, the observed kinetics should be faster with a higher initial thiol concentration, which explains the accelerated response time for AlbSNO observed with increasing cysteine concentration (see Fig. 4). Indeed, further studies suggest the continuous accumulation of CySNO with time in a solution mixture containing both AlbSNO and cysteine (see Supplemental Information Fig. S9). Thus, it is concluded that the current responses to AlbSNO in the presence of cysteine are primarily the result of the transnitrosation equilibrium. This process is potentially useful for measuring S-nitrosoprotein species in various biological samples.
3.5 S-Nitrosothiol detection in whole blood
A preliminary test was conducted to prove the RSNO sensor’s capability of directly detecting changes in AlbSNO level in whole blood (see Supplemental Information Fig. S10). With cysteine added in advance (100 μM in sampled sheep blood), the spiked exogenous AlbSNO (i.e., synthetic BSA-SNO) in whole blood clearly induces a corresponding current level increase for the RSNO sensor proportional to the amount of AlbSNO added. This result indicates that even endogenous high-molecular-weight RSNO species can be amperometrically detected in a complex sample matrix with the proposed RSNO sensor via the transnitrosation reaction with the added thiol reducing agent.
To further investigate the utility of the new RSNO sensor to detect endogenous RSNO species, several additional experiments were conducted with fresh whole blood samples. Fig. 5 shows the results from two separate blood experiments with each added thiol reagent (cysteine and GSH). The RSNO sensor’s responses obtained using cysteine typically leads to a larger current change (denoted by ΔΔ ICys-GSH) than one using GSH as a reducing thiol. Such an enhanced amperometric signal when using cysteine results both from the ability of cysteine to increase sensor sensitivity (see above) and the generation of additional LMW RSNOs (i.e., CySNO) owing to the favorable transnitrosation from S-nitrosoprotein species to the added cysteine. In contrast, there are only minimal differences in the NO sensor’s responses, indicating similar background contribution between two sets of blood samples (traces (c) and (d) in Fig. 5). Therefore, to quantitatively assess such differences in current response between the two measurements, i.e., ΔΔICys-GSH, a standard addition method was adopted by adding known amounts of GSNO (incrementally up to 3 μM, see Materials and Methods Section and Supplemental Information Fig. S1) following the blood injection, as illustrated in Fig. 5.
Fig. 5.
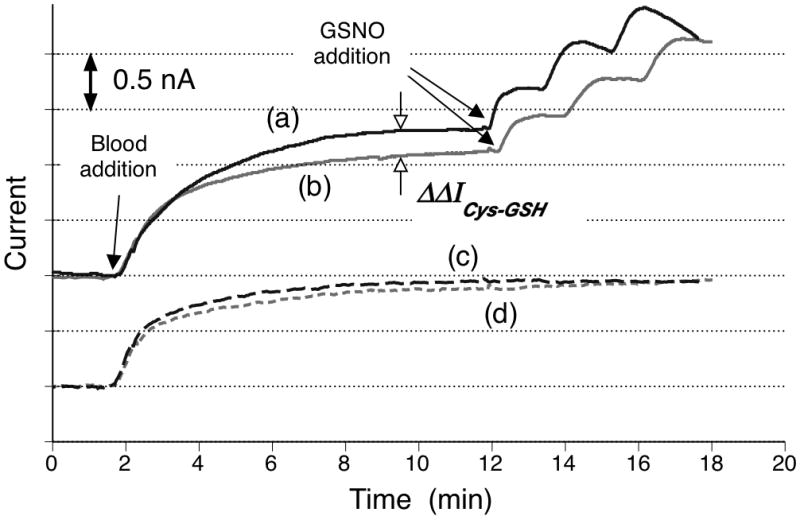
Direct detection of endogenous RSNOs in fresh sheep blood. Results of two separate measurements using cysteine ((a) and (c)) or GSH ((b) and (d)) as a catalyst reducing agent are combined in this one figure. Two sensors (RSeDM-based RSNO sensors and control NO sensor) were initially stabilized in PBS buffer (10 mL, pH 7.3) at 34 °C under N2 environment. Upon addition of 5 mL of fresh sheep blood, the RSNO sensor displays significantly higher responses ((a) and (b)) than those of NO sensor ((c) and (d)). The addition of exogenous GSNO to the given diluted blood solution also raise the amperometric current levels significantly only for the RSNO sensor. Background current levels are adjusted for comparison.
Table 1 summarizes the results from blood RSNO determinations from a series of measurements using fresh sheep blood samples. The calculated endogenous RSNO concentrations based on Eq. 1 are in the low μM range, and the values obtained using cysteine as the added thiol are ca. two fold higher than those obtained using GSH. Indeed, such higher estimated RSNO levels are expected based on the above discussion regarding the more facile transnitrosation between S-nitrosoproteins in blood and cysteine compared to using GSH. As a result, this creates more CySNO that can be effectively detected by the RSNO sensor.
Table 1.
Influence of thiol reducing agent on determination of endogenous RSNO levels.
| Test | RSNO Levels (μM)* |
CCys / CGSH | |
|---|---|---|---|
| CGSH | CCys | ||
| A | 0.56 | 1.2 | 211% |
| B | 0.9 | 1.9 | 200% |
| C | 1.0 | 2.1 | 222% |
| D | 4.2 | 6.9 | 162% |
| E | 4.4 | 6.2 | 140% |
|
| |||
| Average | 187% | ||
Endogenous S-nitrosoproteins (mostly AlbSNO) are consistently identified as the major form (> 80%) of RSNOs in plasma (Jourd’heuil et al. 2000; Stamler 2004). Further, it has been reported that the infused exogenous LMW RSNOs in plasma are rapidly converted to AlbSNO (> 80% conversion in 10-15 min at 37 °C) via transnitrosation, supporting the notion that albumin is a major sink for LMW RSNOs and a key carrier of NO+ in blood (Carballal et al. 2003). This nitrosoprotein NO pool can be mobilized to exert NO-like biological functions via a reverse transnitrosation reaction in the presence of excess LMW thiols (Keaney et al. 1993). Therefore, plasma AlbSNO levels may serve as a more reliable and stable barometer representing the total RSNO pool.
Although we believe the RSNO concentrations reported in Table 1 for fresh sheep blood are within a reasonable range of physiological values, they are likely proportional to total RSNOs levels, not exact concentrations, due to incomplete transnitrosation even when cysteine is employed as the added reducing agent. Further, when applying standard additions of GSNO, the measured sensitivity values of the RSNO sensor in the blood matrix could be in error, due to the possible reverse transnitrosation reaction between added GSNO and abundant free thiols on the albumin present in plasma. The rapid decline of current signals from the added GSNO as observed in Figs. 5 and S10 may indicate the occurrence of such a reverse-transnitrosation reaction to form additional AlbSNO species. Hence, the sensitivity to GSNO in diluted blood (i.e., SSNO, GSNO in Eq. 1) may be underestimated and this can make the total RSNOs reported, based on Eqs. 1 and 2, higher than the actual values. Thus, for more accurate assessment of total endogenous RSNO blood concentrations, additional strategies need to be explored in detail to reliably utilize the transnitrosation equilibrium. These can include the effects of a higher dilution factor to lower albumin thiol levels in the diluted blood; the use of other thiols as reducing agents that form LMW RSNOs even more favorably than cysteine; and the use of a controlled reaction temperature since the transnitrosation equilibrium constants between LMW species and macromolecular RSNOs are reported to be temperature dependent (Wang et al. 2001).
4. Conclusions
Application of an outer RSeDM possessing covalently immobilized RSe sites greatly enhances the amperometric sensitivity and limit of detection toward LMW RSNOs (ca. 20 nM levels) of electrochemical RSNO sensors compared to previously reported devices. Further, it has been clearly shown that the use of cysteine as an exogenous reducing agent leads to an approximately two-fold increase in the RSNO sensor’s sensitivity as compared to employing GSH as the reducing agent. Such improvements of the RSeDM-based RSNO sensor are explained based on a step-wise reaction mechanism of the immobilized organoselenium species suggested previously (Cha and Meyerhoff 2007). Moreover, it has been demonstrated for the first time that AlbSNO also can be amperometrically detected by exploiting transnitrosation between cysteine and AlbSNO. If the levels of the reaction product CySNO reliably represent the AlbSNO concentration in plasma, this strategy may allow the detection of total RSNO species in the plasma phase of a whole blood sample, i.e., LMW RSNOs plus protein-SNOs. Further studies with respect to the blood dilution factor, choice of LMW thiol for transnitrosation and temperature control may help to further optimize such total RSNO measurement capability via the proposed standard addition method. The new type of amperometric RSNO sensor reported in this work may provide a more reliable and simpler detection method to monitor levels of these highly labile markers in whole blood samples.
Supplementary Material
Following supplementary data associated with this article can be found, in the online version, at http://www.sciencedirect.com.
Acknowledgments
The authors gratefully acknowledge the NIH (EB-000783 and EB-004527), the Coulter Foundation and Shuichi Takayama in the Department of Biomedical Engineering, University of Michigan, for supporting this work.
Footnotes
Publisher's Disclaimer: This is a PDF file of an unedited manuscript that has been accepted for publication. As a service to our customers we are providing this early version of the manuscript. The manuscript will undergo copyediting, typesetting, and review of the resulting proof before it is published in its final citable form. Please note that during the production process errors may be discovered which could affect the content, and all legal disclaimers that apply to the journal pertain.
References
- Barnett DJ, McAninly J, Williams DLH. Journal of the Chemical Society, Perkin Transactions. 1994;2:1131–1133. [Google Scholar]
- Barnett DJ, Rios A, Williams DLH. Journal of the Chemical Society, Perkin Transactions. 1995;2:1279–1282. [Google Scholar]
- Bonetti PO, Lerman LO, Lerman A. Arteriosclerosis, Thrombosis, and Vascular Biology. 2003;23(2):168–175. doi: 10.1161/01.atv.0000051384.43104.fc. [DOI] [PubMed] [Google Scholar]
- Braam B, Verhaar MC. Current Pharmaceutical Design. 2007;13(17):1727–1740. doi: 10.2174/138161207780831275. [DOI] [PubMed] [Google Scholar]
- Carballal S, Radi R, Kirk MC, Barnes S, Freeman BA, Alvarez B. Biochemistry. 2003;42(33):9906–9914. doi: 10.1021/bi027434m. [DOI] [PubMed] [Google Scholar]
- Cha W, Lee Y, Oh BK, Meyerhoff ME. Analytical Chemistry. 2005;77(11):3516–3524. doi: 10.1021/ac048192u. [DOI] [PubMed] [Google Scholar]
- Cha W, Meyerhoff ME. Chemical Analysis (Warsaw) 2006a;51(6):949–961. [Google Scholar]
- Cha W, Meyerhoff ME. Langmuir. 2006b;22(25):10830–10836. doi: 10.1021/la0612116. [DOI] [PubMed] [Google Scholar]
- Cha W, Meyerhoff ME. Biomaterials. 2007;28(1):19–27. doi: 10.1016/j.biomaterials.2006.08.019. [DOI] [PubMed] [Google Scholar]
- Cook JA, Kim SY, Teague D, Krishna MC, Pacelli R, Mitchell JB, Vodovotz Y, Nims RW, Christodoulou D, Miles AM, Grisham MB, Wink DA. Analytical Biochemistry. 1996;238(2):150–158. doi: 10.1006/abio.1996.0268. [DOI] [PubMed] [Google Scholar]
- Feletou M, Vanhoutte PM. American Journal of Physiology, Heart and Circulatory Physiology. 2006;291(3):H985–1002. doi: 10.1152/ajpheart.00292.2006. [DOI] [PubMed] [Google Scholar]
- Giustarini D, Milzani A, Colombo R, Dalle-Donne I, Rossi R. Clinica Chimica Acta. 2003;330(12):85–98. doi: 10.1016/s0009-8981(03)00046-9. [DOI] [PubMed] [Google Scholar]
- Giustarini D, Milzani A, Dalle-Donne I, Rossi R. Journal of Chromatography. 2007;B 851(12):124–139. doi: 10.1016/j.jchromb.2006.09.031. [DOI] [PubMed] [Google Scholar]
- Gordge MP, Hothersall JS, Neild GH, Dutra AA. British Journal of Pharmacology. 1996;119:533–538. doi: 10.1111/j.1476-5381.1996.tb15704.x. [DOI] [PMC free article] [PubMed] [Google Scholar]
- Gow A, Doctor A, Mannick J, Gaston B. Journal of Chromatography. 2007;B 851(12):140–151. doi: 10.1016/j.jchromb.2007.01.052. [DOI] [PMC free article] [PubMed] [Google Scholar]
- Gunther WHH, Mautner HG. Journal of Medicinal Chemistry. 1964;7:229–232. doi: 10.1021/jm00332a023. [DOI] [PubMed] [Google Scholar]
- Heiss C, Lauer T, Dejam A, Kleinbongard P, Hamada S, Rassaf T, Matern S, Feelisch M, Kelm M. Journal of the American College of Cardiology. 2006;47(3):573–579. doi: 10.1016/j.jacc.2005.06.089. [DOI] [PubMed] [Google Scholar]
- Hogg N. Analytical Biochemistry. 1999;272(2):257–262. doi: 10.1006/abio.1999.4199. [DOI] [PubMed] [Google Scholar]
- Hwang S, Cha W, Meyerhoff ME. Electroanalysis. 2008;20(3):270–279. [Google Scholar]
- Ignarro LJ. Journal of Physiology and Pharmacology. 2002;53(4):503–514. [PubMed] [Google Scholar]
- Jourd’heuil D, HallÈn K, Feelisch M, Grisham MB. Free Radical Biology and Medicine. 2000;28(3):409–417. doi: 10.1016/s0891-5849(99)00257-9. [DOI] [PubMed] [Google Scholar]
- Kalyman D. Journal of Organic Chemistry. 1965;30:2454–2456. [Google Scholar]
- Keaney JFJ, Simon DI, Stamler JS, Jaraki O, Scharfstein J, Vita JA, Loscalzo J. The Journal of Clinical Investigation. 1993;91(4):1582–1589. doi: 10.1172/JCI116364. [DOI] [PMC free article] [PubMed] [Google Scholar]
- Kim UJ, Kuga S, Wada M, Okano T, Kondo T. Biomacromolecules. 2000;1(3):488–492. doi: 10.1021/bm0000337. [DOI] [PubMed] [Google Scholar]
- Lee Y, Oh BK, Meyerhoff ME. Analytical Chemistry. 2004;76(3):536–544. doi: 10.1021/ac035064h. [DOI] [PubMed] [Google Scholar]
- MacArthur PH, Shiva S, Gladwin MT. Journal of Chromatography. 2007;B 851(12):93–105. doi: 10.1016/j.jchromb.2006.12.012. [DOI] [PubMed] [Google Scholar]
- Miller MR, Megson IL. British Journal of Pharmacology. 2007;151(3):305–321. doi: 10.1038/sj.bjp.0707224. [DOI] [PMC free article] [PubMed] [Google Scholar]
- Mugesh G, Singh HB. Chemical Society Reviews. 2000;29(5):347–357. [Google Scholar]
- Musameh M, Moezzi N, Schauman LM, Meyerhoff ME. Electroanalysis. 2006;18(21):2043–2048. [Google Scholar]
- Noble DR, Williams DLH. Journal of the Chemical Society, Perkin Transactions. 2001;2(1):13–17. [Google Scholar]
- Sarma BK, Mugesh G. Organic and Biomolecular Chemistry. 2008;6(6):965–974. doi: 10.1039/b716239a. [DOI] [PubMed] [Google Scholar]
- Stamler JS. Circulation Research. 2004;94(4):414–417. doi: 10.1161/01.RES.0000122071.55721.BC. [DOI] [PubMed] [Google Scholar]
- Wang K, Wen Z, Zhang W, Xian M, Cheng J-P, Wang PG. Bioorganic and Medicinal Chemistry Letters. 2001;11(3):433–436. doi: 10.1016/s0960-894x(00)00688-0. [DOI] [PubMed] [Google Scholar]
- Zhang H, Means GE. Analytical Biochemistry. 1996;237(1):141–144. doi: 10.1006/abio.1996.0212. [DOI] [PubMed] [Google Scholar]
Associated Data
This section collects any data citations, data availability statements, or supplementary materials included in this article.
Supplementary Materials
Following supplementary data associated with this article can be found, in the online version, at http://www.sciencedirect.com.