

Abstract
Background
Smoking is associated with increased postprandial hypertriglyceridemia (PPT). Inflammation and insulin resistance are potential “drivers” for this phenomenon. We tested whether inflammatory patterns and/or insulin resistance explain the effect of smoking on PPT.
Methods and Results
Men and women in the NHLBI Genetics of Lipid-Lowering Drugs and Diet Network (GOLDN) study (n=1036, age 49±16 y) were included. Each participant was asked to suspend use of lipid-lowering drugs for three weeks and was given a high-fat milkshake (83% fat and 700 kcal/m2). Triglyceride concentrations at 0, 3.5 and 6 hr after the fat load were measured. Inflammatory markers were measured at baseline. Principal component analysis was used to derive inflammatory patterns from individual inflammatory markers (hsCRP, IL2 soluble receptor-α, IL6, TNF-α and MCP-1). Insulin resistance (IR) was estimated using the HOMA equation. Repeated measures-ANOVA was used for analyses. Two inflammatory patterns, namely CRP-IL6 pattern and MCP1-TNF-α pattern, were derived. We found significant main (smoking and time) and interaction (smoking*time) effects (P<0.01) for triglycerides. The multivariate-adjusted triglyceride (mg/dl) concentrations (mean ± s.e.m) for never, past and current smokers were 127.38±1.04, 119.82±1.05 and 134.92±1.08 at 0 hr; 229.42±1.04, 238.39±1.05 and 293.94±1.08 at 3.5 hr; and 194.63±1.04, 208.38±1.05 and 248.27±1.08 at 6 hr after the fat load, respectively. Smoking remained significant after adjusting for HOMA-IR and/or inflammatory patterns which showed independent associations with PPT (P<0.05).
Conclusions
These data confirm impaired metabolism of fat among smokers and suggest that mechanisms other than inflammation or insulin resistance may explain the observed hypertriglyceridemia among smokers.
Keywords: smoking, triglycerides, lipids, inflammation, insulin resistance
1.0 Introduction
Postprandial hypertriglyceridemia (PPT) is an independent risk factor for atherosclerosis and other cardiovascular conditions [1-3]. Both genetic and environmental factors, including lifestyle and pharmacologic interventions, might regulate PPT. Smoking, alcohol intake and presence of the metabolic syndrome are associated with increased PPT, even in normolipemic men and women [1, 4-6]. Smokers have been reported to have greater increases in postprandial plasma triglycerides than non-smokers [5]. Alcohol, a close correlate of habitual smoking, is independently associated with postprandial triglyceridemia but the effect is transient and results in concomitant increase in high-density lipoprotein (HDL) cholesterol [6, 7]. The cause of impaired fat metabolism among smokers may be due to smoke-induced insulin resistance and/or inflammation [5, 8, 9].
Data linking insulin resistance or inflammation with PPT in the context of smoking are scarce and those available are mainly from studies with very small sample sizes [8, 9]. Furthermore, most studies did not examine determinants of postprandial lipemia in the context of lipid-lowering drugs or inflammatory patterns. Although, specific studies on the role of inflammation in regulation of plasma lipids are lacking, there are a few studies that suggest a link between inflammation and fasting or postprandial lipid profiles [9-11]. Interleukin-6 (IL6), tumor necrosis factor (TNF)-α and C-reactive protein (CRP) are associated with fasting triglycerides [11] while CRP in some studies was also associated with PPT [9, 10], probably through the down-regulation of lipoprotein lipase activity [12]. Whether other inflammatory markers, individually or in combination with each other as an inflammatory pattern, contribute to PPT is not known.
In the NHLBI GOLDN study with more than 1200 men and women in Utah and Minnesota, we tested (1) whether habitual smoking influences postprandial hypertriglyceridemia, (2) whether the potential effects of smoking are due to inflammatory pattern or insulin resistance and (3) if the potential effects of smoking would be abrogated by treatment with a daily dose of 160 mg of micronized fenofibrate for three weeks. We further tested whether inflammatory patterns have an independent effect on PPT.
2.0 Methods
2.1. Study design and population
The subjects were 1328 Caucasian men and women in the Genetics of Lipid-Lowering Drugs and Diet Network (GOLDN) family study with three-generational pedigrees in two genetically homogeneous centers in Minneapolis, MN and Salt Lake City, Utah [13-15]. The GOLDN study is part of the PROgram for GENetic Interaction (PROGENI) Network, a group of National Institutes of Health (NIH)-funded family intervention studies focusing on gene-environment interactions [16]. The main aim of the GOLDN study is to characterize the genetic basis of the variable response of triglycerides to two environmental contexts, one that raises triglycerides (dietary fat), and one that lowers triglycerides (fenofibrate treatment). Men and women in this study participated in a three week open-label clinical trial that tested triglyceride responses to a high-fat milkshake (83% fat and 700 kcal/m2) before and after three weeks of daily treatment with 160 mg of micronized fenofibrate. A flow diagram showing the design of the GOLDN study is shown in Fig 1. The study participants were asked to abstain from alcohol and cigarette smoking during the fat challenge.
Fig. 1.
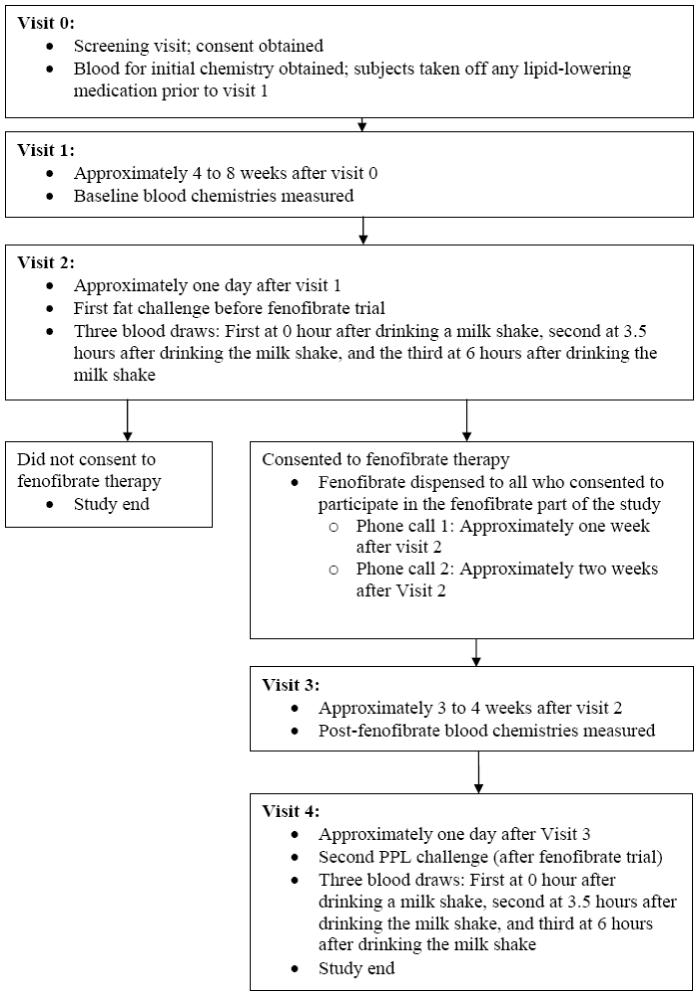
Design of NHLBI Genetics of Lipid-Lowering Drugs and Diet Network (GOLDN) study.
After the screening visit (visit 0) and before beginning fenofibrate therapy, the study subjects were asked to suspend use of their lipid-lowering drugs (at least 4 weeks prior to the baseline measurements at visit 1) and had their fasting blood and lipid profiles taken one day before an oral fat load. On the following day (visit 2) anthropometric measurements and a fasting blood sample were taken before an oral fat challenge (0 hr). Additional blood samples for lipid profiles were taken at 3.5 hr and at 6 hr after the oral fat challenge. The oral fat challenge was repeated three weeks after treatment with fenofibrate (visit 4) and plasma lipid profiles were determined one day before, at 0, 3.5 and 6 hours after an oral fat challenge. Triglyceride measurements taken one day before the oral fat challenge were used in secondary analyses as baseline covariates in models.
2.2. Laboratory measurements
All samples were centrifuged within 20 minutes of collection at 2000 × g for 15 min at 4°C and stored frozen at -70°C. For each analyte, specimens from each participant were assayed in the same batch to eliminate inter-assay imprecision.
Biochemical analysis were performed as previously described [14, 17]. Briefly, triglycerides were measured using a glycerol blanked enzymatic method (Trig/GB, Roche Diagnostics Corporation, Indianapolis, IN) and cholesterol was measured using a cholesterol esterase, cholesterol oxidase reaction (Chol R1, Roche Diagnostics Corporation) on the Roche/Hitachi 911 Automatic Analyzer (Roche Diagnostics Corporation). For HDL-cholesterol, the non-HDL-cholesterol was first precipitated with magnesium/dextran. LDL-cholesterol was measured by a homogeneous direct method (LDL Direct Liquid Select™ Cholesterol Reagent, Equal Diagnostics, Exton, PA).
Fasting glucose was measured using the hexokinase-mediated reaction on a Hitachi 911 analyzer (Roche Diagnostics) while fasting insulin was measured using the human insulin specific RIA kit (Linco Research, St. Charles, MO) [18]. hsCRP was measured on the Hitachi 911 using a latex particle enhanced immunoturbidimetric assay (Kamiya Biomedical Company, Seattle, WA). IL6, interleukin-2 (IL2) soluble receptor-α, TNF-α and monocyte chemoattractant protein-1 (MCP1) were measured using quantitative sandwich enzyme immunoassay techniques (ELISA kit assays, R&D Systems Inc., Minneapolis, MN) as described elsewhere [17]. The reliability coefficients for various assays were very good and are shown in Table 1.
Table 1.
Reliability coefficients for various assays in the NHLBI GOLDN Study Sample
| Phenotype | Laboratory quality assurance |
|---|---|
| (reliability coefficients) | |
| Enzymatic Labs | |
| TG (mg/dL) | 0.99 |
| LDL-c (mg/dL) | 0.99 |
| HDL-c (mg/dL) | 0.98 |
| Glucose (mg/dL) | 0.98 |
| CRP (mg/dL) | 0.99 |
| IL-2 Sol. Receptor (pg/mL) | 0.97 |
| IL-6 (pg/mL) | 0.92 |
| MCP-1 (pg/mL) | 0.91 |
| TNF-a (pg/mL) | 0.76 |
| Adiponectin (pg/mL) | 0.95 |
| NMR Labs | |
| Chylomicrons (mg/dL) | 0.99 |
| Large HDL (mg/dL) | 0.99 |
| Medium HDL (mg/dL) | 0.96 |
| Small HDL (mg/dL) | 0.95 |
| IDL (mg/dL) | 0.90 |
| Large LDL (mg/dL) | 0.95 |
| Medium small LDL (mg/dL) | 0.93 |
| Small LDL (mg/dL) | 0.95 |
| Very small LDL (mg/dL) | 0.93 |
| Total VLDL (mg/dL) | 0.99 |
| Large VLDL (mg/dL) | 0.99 |
| Medium VLDL (mg/dL) | 0.99 |
| Small VLDL (mg/dL) | 0.96 |
2.3. Potential confounders
Habitual dietary intake was assessed with the National Cancer Institute diet history questionnaire (DHQ) [19] while data on medical history, physical activity and other lifestyle variables such as alcohol intake were collected using an interviewer-administered questionnaire.
2.4. Statistical analysis
SAS Software version 9.1.3 (SAS Institute, Inc., Cary, NC) was used for statistical analyses. From the 1328 men and women in the GOLDN study, we excluded all subjects with a self-reported history of kidney disease, Grave’s disease, those in the top and lowest one percentile of total energy intake and those with missing data on major exposure variables and potential confounders. The final data set consists of 1036 subjects in 187 families. The significance of differences in the distribution of categorical variables by the smoking status (never, past and current smoker) were tested using the Cochran-Mantel-Haenszel test after stratifying by field center while for continuous variables we used a mixed model that adjusted for the age, sex, field center and pedigree as a random effect using the Mixed procedure in SAS.
We used the Spearman correlation coefficients to determine the relation between continuous variables and triglyceride concentrations at 0, 3.5 and 6 hr after the oral fat challenge in the period before and after treatment with fenofibrate. We assessed insulin resistance using the homeostatic model assessment for insulin resistance (HOMA-IR) as described elsewhere [20].
We used the Factor Procedure in SAS to implement principal component analysis and derive inflammatory patterns before and after treatment with fenofibrate. Inflammatory markers (CRP, IL2, IL6, TNF-α and MCP1) measured before treatment with fenofibrate were entered into the model and based on evaluation of eigenvalues and the Scree plot two pre-fenofibrate inflammatory patterns were derived and rotated using the VARIMAX option in SAS to improve interpretability [21]. The procedure was repeated with the same inflammatory markers but measured during treatment with fenofibrate and just before the second oral fat load to derive post-fenofibrate inflammatory patterns.
We used repeated measures ANOVA to test for associations between smoking (never, past and current smoker) and log-transformed triglycerides. In these analyses, we adjusted for age, sex, waist circumference, alcohol intake, field center, hours spent on TV/computer/week (as a proxy for physical activity), history of hypertension, history of diabetes, intake of total energy, percent energy from individual dietary fats (saturated, monounsaturated, polyunsaturated and trans fat) and carbohydrates. The pedigree was entered into the model as a random effect. Means and standard errors for log-transformed triglycerides that are adjusted for other covariates in the model were obtained and plotted. Because the Mixed procedure in SAS underestimates standard errors in repeated measures analyses, we adjusted the standard errors using the Kenward-Roger method [22, 23]. The other covariates tested for confounding but not included in the final model were intake of fiber and percent energy from protein. We also examined the plasma triglyceride concentrations one day before the oral fat load as a baseline covariate. While this may be considered an over-adjustment, it allows each subject to be his/her own control and reduces the covariance of between subject effects [22].
To further examine relationships between smoking, inflammation, IR and PPT, we further adjusted for inflammatory patterns and HOMA-insulin resistance sequentially and together as continuous variables and determined whether the smoking-by-time interaction would remain significant.
To examine whether there are independent effects of insulin resistance or inflammatory patterns on PPT we distributed men and women into tertiles of inflammatory patterns and tertiles of insulin resistance and tested whether the interactions between tertiles of inflammatory patterns or insulin resistance and time would be significant in models adjusted for smoking, alcohol intake and other covariates mentioned above.
3.0. Results
3.1. Subject characteristics
Table 2 shows the characteristics of the study subjects by their smoking status. Compared to never smokers, current smokers were younger, less likely to be from the Utah field center and were more likely to consume alcohol. Except for total energy from carbohydrate, current smokers were similar to never smokers in the dietary variables examined in Table 2. At baseline, current smokers were not significantly different (P>0.05) from past and never smokers with regard to insulin, glucose, HOMA-insulin resistance, lipids and inflammatory markers. Correlations between potential confounders and triglyceride measurements at 0, 3.5 and 6 hr after the fat load are showed in the online Supplemental Table 1.
Table 2.
Baseline characteristics of the study subjects by smoking status*
| Variable | Never smoker | Past smoker | Current smoker | |
|---|---|---|---|---|
| n = 737 | n = 223 | n = 76 | P† | |
| Age, y‡ | 47.4 ± 0.6 | 55.1 ± 1.1 | 43.0 ± 1.9 | <0.0001 |
| Sex, % women | 54.4 | 43.1 | 55.3 | 0.01 |
| Field center, % from Utah | 61.7 | 19.3 | 10.5 | <0.0001 |
| Current alcohol drinker, % | 40.3 | 77.6 | 82.9 | <0.0001 |
| BMI, kg/m2 | 28.3 ± 0.2 | 28.3 ± 0.4 | 28.5 ± 0.7 | 0.94 |
| Waist circumference, m | 0.96 ± 0.01 | 0.98 ± 0.01 | 0.98 ± 0.02 | 0.56 |
| Watching TV/on computer, hr/d | 0.76 ± 0.02 | 0.81 ± 0.03 | 0.80 ± 0.05 | 0.37 |
| Systolic blood pressure, mmHg | 116 ± 1 | 113 ± 1 | 112 ± 2 | 0.01 |
| Diastolic blood pressure, mmHg | 67 ± 1 | 66 ± 1 | 66 ± 1 | 0.33 |
| Total energy intake, kcal/d | 2046 ± 42 | 2055 ± 66 | 2170 ± 102 | 0.49 |
| Saturated fat, % energy | 11.5 ± 0.2 | 11.5 ± 0.2 | 12.0 ± 0.3 | 0.29 |
| Monounsaturated fat, % energy | 12.7 ± 0.2 | 12.6 ± 0.3 | 12.8 ± 0.4 | 0.86 |
| Polyunsaturated fat, % energy | 7.3 ± 0.2 | 7.1 ± 0.2 | 7.2 ± 0.3 | 0.53 |
| Total trans fat, % energy | 2.01 ± 0.04 | 1.99 ± 0.06 | 2.03 ± 0.08 | 0.88 |
| Carbohydrate intake, % energy | 51.0 ± 0.6 | 49.6 ± 0.8 | 47.8 ± 1.1 | 0.003 |
| Protein intake, % energy | 15.9 ± 0.1 | 15.9 ± 0.2 | 15.1 ± 0.3 | 0.07 |
| Energy-adjusted glycemic load | 117 ± 2 | 113 ± 2 | 112 ± 3 | 0.06 |
| Insulin, pmol/L | 84.2 ± 1.8 | 81.7 ± 3.5 | 74.0 ± 5.7 | 0.23 |
| Glucose, mmol/L | 5.57 ± 0.05 | 5.70 ± 0.08 | 5.73 ± 0.12 | 0.17 |
| HOMA-insulin resistance | 3.61 ± 0.09 | 3.48 ± 0.17 | 3.20 ± 0.28 | 0.36 |
| HDL-cholesterol, mg/dl | 43.8 ± 0.9 | 43.9 ± 1.1 | 43.9 ± 1.6 | 1.00 |
| LDL-cholesterol, mg/dl | 115.8 ± 1.6 | 118.8 ± 2.4 | 120.6 ± 3.6 | 0.26 |
| Triglycerides, mg/dl | 135.5 ± 4.3 | 143.3 ± 8.0 | 161.7 ± 13.3 | 0.16 |
| Total VLDL, mg/dl | 103.7 ± 3.8 | 109.8 ± 7.2 | 127.2 ± 11.9 | 0.17 |
| High sensitivity C-reactive protein, mg/dl | 0.21 ± 0.03 | 0.21 ± 0.04 | 0.35 ± 0.06 | 0.10 |
| Interleukin-2 soluble receptor-alpha, pg/ml | 971 ± 25 | 974 ± 33 | 1067 ± 47 | 0.10 |
| Interleukin-6, pg/ml | 1.84 ± 0.15 | 2.43 ± 0.24 | 2.40 ± 0.38 | 0.05 |
| Tumor necrosis factor-alpha, pg/ml | 3.30 ± 0.20 | 4.07 ± 0.38 | 3.06 ± 0.63 | 0.17 |
| Monocyte chemoattractant protein-1, pg/ml | 215 ± 4 | 209 ± 6 | 226 ± 8 | 0.11 |
| Park years smoked | 0 | 18.6 ± 22.8 | 18.9 ± 18.3 | -- |
| Smoking intensity, cig/d | 0 | 18.1 ± 15.2 | 13.0 ± 9.3 | -- |
Values are means ± SEM or %. Means and SEM are adjusted for age, sex and field center and pedigree using a mixed model.
ANOVA P for main smoking fixed effect.
Age adjusted for sex, field center and pedigree as above.
Table 3 shows inflammatory patterns derived from CRP, IL2, IL6, TNF-α and MCP1 for subjects with complete data (n =785) before and after treatment with fenofibrate. For each treatment period, two inflammatory patterns were identified using principal components analysis. Before fenofibrate, the principal inflammatory pattern was CRP-IL6 pattern. After fenofibrate treatment MCP1-TNF-α pattern became the dominant pattern (Table 3). In the final model, the inflammatory patterns used were derived from all men and women with data on inflammatory markers even if they did not participate in the fenofibrate phase of the study. The resulting patterns were similar to those from the restricted sample of 785 men and women. For instance the rotated factor loadings for CRP, IL2, IL6, TNF-α and MCP1 in the complete sample were 0.72, 0.65, 0.62, -0.11 and 0.21 for the CRP-IL6 pattern and -0.13, 0.34, 0.05, 0.76 and 0.73 for the MCP1-TNF-α pattern, respectively. As expected, individuals scoring high on each pattern had correspondingly higher concentrations of the inflammatory markers with high factor loadings (data not shown).
Table 3.
Inflammatory patterns before and after treatment with fenofibrate
| Inflammatory patterns | ||||
|---|---|---|---|---|
| Before fenofibrate (n = 785)* | After fenofibrate (n = 785) | |||
| Pattern 1 (CRP-IL-6 pattern) | Pattern 2 (MCP1-TNF-α pattern) | Pattern 1 (MCP1-TNF-α pattern) | Pattern 2 (CRP-IL-6 pattern) | |
| CRP | 0.71 | -0.23 | 0.21 | 0.73 |
| IL-2 | 0.68 | 0.32 | 0.57 | 0.53 |
| IL-6 | 0.58 | 0.08 | -0.06 | 0.78 |
| TNF-α | -0.09 | 0.73 | 0.79 | -0.07 |
| MCP-1 | 0.20 | 0.75 | 0.72 | 0.21 |
The numbers in the table are factor loadings for each inflammatory marker after the varimax rotation. The first column in each treatment period shows the principal pattern. The patterns were derived using principal component analysis.
Next we examined whether habitual smoking is associated with increased postprandial triglyceridemia and whether inflammatory patterns or HOMA-insulin resistance would modify this association (Table 4 and Fig. 2). Current smokers showed a greater postprandial triglyceride response than non-smokers before and after adjustment for several potential confounders including alcohol intake, field center, sex, baseline triglycerides, BMI, and dietary variables. In these analyses there was a strong interaction between smoking and time after the oral fat load (P<0.0001), suggesting that current smokers had a greater rise in plasma triglycerides after the fat load. Although the triglyceride concentrations were lower during the fenofibrate phase, the relation between smoking and triglycerides concentrations before fenofibrate was similar to that after fenofibrate (Fig 2).
Table 4.
Triglyceride responses after an oral fat load by smoking status in the period before fenofibrate
| Model 1*† | Model 1 + Inflammatory patterns‡ | Model 1 + HOMA-IR§ | |||||||
|---|---|---|---|---|---|---|---|---|---|
| Time | Never smoker | Past smoker | Current smoker | Never smoker | Past smoker | Current smoker | Never smoker | Past smoker | Current smoker |
| 0 hr | 127.38±1.04 | 119.8±1.1 | 134.9±1.1 | 127.1±1.0 | 120.0±1.1 | 136.6±1.1 | 121.5±1.0 | 115.3±1.1 | 130.8±1.1 |
| 3.5 hr | 229.42±1.04 | 238.4±1.1 | 293.9±1.1 | 228.9±1.0 | 238.7±1.1 | 297.6±1.1 | 218.4±1.0 | 229.6±1.1 | 285.1±1.1 |
| 6 hr | 194.63±1.04 | 208.4±1.1 | 248.3±1.1 | 194.2±1.0 | 208.6±1.1 | 250.5±1.1 | 185.6±1.0 | 201.0±1.1 | 240.8±1.1 |
| Smoking P = 0.02 | Smoking P = 0.01 | Smoking P = 0.01 | |||||||
| Time P < 0.0001 | Time P <0.0001 | Time P <0.0001 | |||||||
| Smoking*Time P < 0.0001 | Smoking*Time P <0.0001 | Smoking*Time P <0.0001 | |||||||
Values are means ± s.e.m of triglyceride concentrations (mg/dl).
Means are adjusted for age, sex, field center, alcohol intake, waist circumference, hours spent on TV/computer (as a proxy for physical activity), history of hypertension, history of diabetes, intake of total energy, energy from saturated fat, monounsaturated fat, polyunsaturated fat, trans fat, carbohydrate and pedigree (as a random effect).
The inflammatory patterns were CRP-IL-6 pattern and MCP1-TNF-α pattern simultaneously entered into the model as continuous variables. Both patterns were independently associated with postprandial triglyceridemia (P <0.01).
HOMA-IR is homeostatic model assessment of insulin resistance [20] and was entered into the model as a continuous variable. HOMA-IR was also independently associated with postprandial triglyceridemia whether added to model 1 alone or together with the inflammatory patterns (P <0.0001).
Fig 2.

The relation between smoking and postprandial triglyceride responses before and after treatment with fenofibrate in the NHLBI GOLDN study. The analyses are adjusted for age, sex, field center, alcohol intake, waist circumference, hours spent on TV/computer (as a proxy for physical activity), intake of total energy, energy from saturated fat, monounsaturated fat, polyunsaturated fat, trans fat, carbohydrate and pedigree (as a random effect).
Because insulin resistance and inflammation are speculated to increase postprandial hypertriglyceridemia [9-11], we further adjusted our main repeated measures model for these covariates to see if they would abrogate or attenuate the observed effect of smoking (Table 3). Although, inflammatory patterns (Fig 3) and HOMA-insulin resistance (supplemental Fig 1) showed significant independent associations with hypertriglyceridemia, none of them explained the association between smoking and hypertriglyceridemia when entered into the model individually or together (Table 4).
Fig 3.

The relation between inflammatory patterns and postprandial triglyceride responses before treatment with fenofibrate in the NHLBI GOLDN study. The analyses are adjusted for age, sex, smoking, field center, alcohol intake, waist circumference, hours spent on TV/computer (as a proxy for physical activity), intake of total energy, energy from saturated fat, monounsaturated fat, polyunsaturated fat, trans fat, carbohydrate and pedigree (as a random effect).
Both CRP-IL6 and MCP1-TNF-α pattern showed significant associations with triglycerides in models adjusted for covariates other than waist circumference. When waist circumference was added to the multivariate model, only the MCP1-TNF-α pattern remained significantly associated with PPT (Fig 3). In all models waist circumference remained significantly associated with PPT, suggesting that smoking, central obesity (assessed by waist circumference), inflammation and HOMA-IR may all have independent effects on PPT.
As in other studies, alcohol intake was associated with lower fasting triglyceride concentrations but with a higher increase in triglyceride concentrations at 3.5 hr after the oral fat load. Interestingly by 6 hr after the oral fat load, triglyceride concentrations of current drinkers were similar to those of non-drinkers (supplemental Fig. 2).
4.0. Discussion
We have shown that cigarette smoking is associated with a significantly increased postprandial triglyceride response, independent of factors known to affect lipid concentrations e.g., alcohol intake, sex, diet, hypertension and physical activity. We have also shown that insulin resistance and inflammatory markers also had significant positive associations with postprandial lipemia which were independent of the effects of cigarette smoking. This is the largest study on postprandial lipemia and the first to report on a relation between inflammatory patterns and PPT. The current findings are robust in that the observed associations persisted even after sequential adjustment for various potential confounders including triglyceride concentrations a day before the oral fat load.
Our data are in agreement with those of others in showing that smoking is associated with increased PPT [5] and additionally show that the effect of smoking is not due to insulin resistance or inflammation as speculated in other studies [5, 8, 9]. The mechanism for increased PPT among smokers remains obscure but may be related to the down-regulation of lipid metabolizing enzymes probably through mechanisms other than inflammation or insulin resistance. One potential mechanism could be increase in oxidative stress by components of cigarette smoke [24-26]. Oxidative stress following strenuous exercise has been associated with an increase in VLDL and triglycerides [27]. Whether this is via down-regulation of LPL enzyme or other lipid-lowering enzymes is not known.
Another potential mechanism is reduction in the binding of peroxisome proliferator activator receptors (PPAR) by natural (e.g., polyunsaturated fatty acids) or pharmacologic ligands (e.g., fibrates or thiazolinediones). This is because even after treatment with fenofibrate, a very potent PPAR-α ligand associated with significant lowering of plasma triglycerides, current smokers in this study showed less benefit than past or never smokers. Indeed, when compared to never smokers in this study current smokers have significantly less available polyunsaturated fats in red blood cell membrane (P <0.05) as well as tendency for lower plasma concentrations of fibric acid, suggesting impaired availability of PPAR ligands. For instance, the percentage of long-chain n3 polyunsaturated fatty acids in erythrocyte membranes of never, past and current smokers were 5.70 ± 0.04, 5.70 ± 0.08 and 5.37 ± 0.13, respectively (P<0.05). The areas under the curve for fenofibric acid among never, past and current smokers were 68.5 ± 1.5, 69.1 ± 2.6 and 63.0 ± 4.7, respectively (P >0.05). The effect of cigarette smoking on availability of PPAR family ligands needs to be further studied.
We found that the MCP1-TNF-α pattern was independently associated with increased PPT. This is plausible given that up-regulation of proinflammatory cytokines is associated with down-regulation of lipoprotein lipase, a key enzyme in the metabolism of triglycerides [12]. It is interesting that unlike the CRP-IL6 pattern, the association between MCP-1-TNF-α pattern and PPT is independent of central adiposity and other potential confounders.
One limitation of the current analyses is the low number of current smokers and the low-intensity of smoking in this study. Thus we were unable to perform analyses to determine dose-response relationships between intensity of cigarette smoking and triglycerides. Despite this limitation, we found a strong increase in postprandial lipemia among current smokers following an oral high-fat challenge. The other limitation is that we used the HOMA-model to assess insulin resistance. This may not be accurate but there are no better options for assessing insulin resistance in large epidemiologic studies such as ours. In an attempt to quantify the magnitude and pattern of systemic inflammation we used principal component analysis (PCA) to derive inflammatory patterns from individual markers of inflammation. This is a limitation since PCA might not fully capture the state of systemic inflammation. Finally we used statistical approaches to account for covariates (HOMA-insulin resistance and inflammatory patterns) that may be correlated. Although there is a potential for multicollinearity, this is not likely to have been a problem in our analyses because the correlation between inflammatory patterns and HOMA-IR were very low (r = 0.15, P<0.0001 for pattern 1 and r= 0.09, P = 0.02 for pattern 2). In our experience, especially with dietary variables which tend to be highly correlated, collinearity does not affect model estimates until the correlation coefficient approaches r = 0.80.
In summary, our study confirms impaired dietary fat metabolism among smokers and shows that this association is not due to inflammation, insulin resistance or central obesity, which are independently associated with increased postprandial hypertriglyceridemia. We speculate that oxidative stress due to smoke by-products could down-regulate key lipid-metabolizing enzymes and that smoke bi-products could reduce availability of PPAR ligands (e.g., fatty acids and pharmacologic products such as fibrates) leading to impaired fat metabolism among current smokers.
Supplementary Material
Acknowledgements
We are grateful to the staff of the GOLDN study for the assistance in data collection and management.
Grant/funding Support: This study was funded by NHLBI grant number U01HL072524-04.
Footnotes
Supplemental Tables and Figs are available as e-components at www.elsevier.com
Financial Disclosures: None to declare.
References
- 1.Sharrett AR, Heiss G, Chambless LE, Boerwinkle E, Coady SA, Folsom AR, Patsch W. Metabolic and Lifestyle Determinants of Postprandial Lipemia Differ From Those of Fasting Triglycerides: The Atherosclerosis Risk in Communities (ARIC) Study. Arterioscler Thromb Vasc Biol. 2001;21:275–81. doi: 10.1161/01.atv.21.2.275. [DOI] [PubMed] [Google Scholar]
- 2.Steiner G. Triglyceride-rich lipoproteins and atherosclerosis, from fast to feast. Ann Med. 1993;25:431–5. doi: 10.3109/07853899309147307. [DOI] [PubMed] [Google Scholar]
- 3.Bansal S, Buring JE, Rifai N, Mora S, Sacks FM, Ridker PM. Fasting Compared With Nonfasting Triglycerides and Risk of Cardiovascular Events in Women. JAMA. 2007;298:309–16. doi: 10.1001/jama.298.3.309. [DOI] [PubMed] [Google Scholar]
- 4.Kolovou G, Anagnostopoulou K, Pavlidis A, Salpea K, Iraklianou S, Tsarpalis K, Damaskos D, Manolis A, Cokkinos D. Postprandial lipemia in men with metabolic syndrome, hypertensives and healthy subjects. Lipids in Health and Disease. 2005;4:21. doi: 10.1186/1476-511X-4-21. [DOI] [PMC free article] [PubMed] [Google Scholar]
- 5.Eliasson B, Mero N, Taskinen MR, Smith U. The insulin resistance syndrome and postprandial lipid intolerance in smokers. Atherosclerosis. 1997;129:79–88. doi: 10.1016/s0021-9150(96)06028-5. [DOI] [PubMed] [Google Scholar]
- 6.Chung B-H, Doran S, Liang P, Osterlund L, Cho BHS, Oster RA, Darnell B, Franklin F. Alcohol-mediated enhancement of postprandial lipemia: a contributing factor to an increase in plasma HDL and a decrease in risk of cardiovascular disease. Am J Clin Nutr. 2003;78:391–9. doi: 10.1093/ajcn/78.3.391. [DOI] [PubMed] [Google Scholar]
- 7.Kabagambe EK, Baylin A, Ruiz-Narvarez E, Rimm EB, Campos H. Alcohol intake, drinking patterns and risk of nonfatal acute myocardial infarction in Costa Rica. Am J Clin Nutr. 2005;82:1336–45. doi: 10.1093/ajcn/82.6.1336. [DOI] [PubMed] [Google Scholar]
- 8.Gronholdt MLM, Sillesen H, Wiebe BM, Laursen H, Nordestgaard BG. Increased Acute Phase Reactants are Associated with Levels of Lipoproteins and Increased Carotid Plaque Volume. European Journal of Vascular and Endovascular Surgery. 2001;21:227. doi: 10.1053/ejvs.2001.1321. [DOI] [PubMed] [Google Scholar]
- 9.Lanes R, Paoli M, Carrillo E, Villaroel O, Palacios A. Peripheral inflammatory and fibrinolytic markers in adolescents with growth hormone deficiency: Relation to postprandial dyslipidemia. The Journal of Pediatrics. 2004;145:657. doi: 10.1016/j.jpeds.2004.07.037. [DOI] [PubMed] [Google Scholar]
- 10.Bradescu OM, Georgescu M, Ifrim S, Ioacara S, Ionescu-Tirgoviste C. Meal testing and postprandial state of type 2 diabetic patients with metabolic syndrome. Rom J Intern Med. 2005;43:97–113. [PubMed] [Google Scholar]
- 11.Chung CP, Oeser A, Solus J, Avalos I, Gebretsadik T, Shintani A, Linton MF, Fazio S, Stein CM. Inflammatory Mechanisms Affecting the Lipid Profile in Patients with Systemic Lupus Erythematosus. J Rheumatol. 2007 [PubMed] [Google Scholar]
- 12.Borba EF, Carvalho JF, Bonfa E. Mechanisms of dyslipoproteinemias in systemic lupus erythematosus. Clin Dev Immunol. 2006;13:203–8. doi: 10.1080/17402520600876945. [DOI] [PMC free article] [PubMed] [Google Scholar]
- 13. [Last accessed: March 03, 2008];Genetics of Lipid Lowering Drugs and Diet Network (GOLDN) study. http://wwwbiostatwustledu/goldn/
- 14.Corella D, Arnett DK, Tsai MY, Kabagambe EK, Peacock JM, Hixson JE, Straka RJ, Province M, Lai CQ, Parnell LD, et al. The -256T>C polymorphism in the apolipoprotein A-II gene promoter is associated with body mass index and food intake in the genetics of lipid lowering drugs and diet network study. Clin Chem. 2007;53:1144–52. doi: 10.1373/clinchem.2006.084863. [DOI] [PubMed] [Google Scholar]
- 15.Kabagambe EK, Tsai MY, Hopkins PN, Ordovas JM, Peacock JM, Borecki IB, Arnett DK. Erythrocyte Fatty Acid Composition and the Metabolic Syndrome: A National Heart, Lung, and Blood Institute GOLDN Study. Clin Chem. 2008;54:154–62. doi: 10.1373/clinchem.2007.095059. [DOI] [PubMed] [Google Scholar]
- 16. [Last accessed: March 3, 2008];PROGENI (PROgram for GENetic Interaction) http://wwwbiostatwustledu/progeni/
- 17.Tsai MY, Hanson NQ, Straka RJ, Hoke TR, Ordovas JM, Peacock JM, Arends VL, Arnett DK. Effect of influenza vaccine on markers of inflammation and lipid profile. J Lab Clin Med. 2005;145:323–7. doi: 10.1016/j.lab.2005.03.009. [DOI] [PubMed] [Google Scholar]
- 18.Shen J, Arnett DK, Peacock JM, Parnell LD, Kraja AJ, Hixson JE, Tsai MY, Lai C-Q, Kabagambe EK, Straka RJ, ordovas JM. Interleukin 1-beta genetic polymorphisms interact with polyunsaturated fatty acids to modulate risk of the metabolic syndrome. J Nutr. 2007;137:1846–51. doi: 10.1093/jn/137.8.1846. [DOI] [PubMed] [Google Scholar]
- 19.NCI . Diet History Questionnaire. Version 1.0 National Institutes of Health, Applied Research Program, National Cancer Institute; 2007. [Google Scholar]
- 20.Matthews DR, Hosker JP, Rudenski AS, Naylor BA, Treacher DF, Turner RC. Homeostasis model assessment: insulin resistance and beta-cell function from fasting plasma glucose and insulin concentrations in man. Diabetologia. 1985;28:412–9. doi: 10.1007/BF00280883. [DOI] [PubMed] [Google Scholar]
- 21.Hu FB, Rimm EB, Stampfer MJ, Ascherio A, Spiegelman D, Willett WC. Prospective study of major dietary patterns and risk of coronary heart disease in men. Am J Clin Nutr. 2000;72:912–21. doi: 10.1093/ajcn/72.4.912. [DOI] [PubMed] [Google Scholar]
- 22.Littell RC, Milliken GA, Stroup WW, Wolfinger RD, Schabenberger O. SAS for Mixed Models. Second edn. SAS; Cary, NC: 2006. [Google Scholar]
- 23.Kenward MG, Roger JH. Small sample inference for fixed effects from restricted maximum likelihood. Biometrics. 1997;53:983–97. [PubMed] [Google Scholar]
- 24.Hulea SA, Olinescu R, Nita S, Crocnan D, Kummerow FA. Cigarette smoking causes biochemical changes in blood that are suggestive of oxidative stress: a case-control study. J Environ Pathol Toxicol Oncol. 1995;14:173–80. [PubMed] [Google Scholar]
- 25.Ozguner F, Koyu A, Cesur G. Active smoking causes oxidative stress and decreases blood melatonin levels. Toxicol Ind Health. 2005;21:21–6. doi: 10.1191/0748233705th211oa. [DOI] [PubMed] [Google Scholar]
- 26.Tanriverdi H, Evrengul H, Kuru O, Tanriverdi S, Seleci D, Enli Y, Kaftan HA, Kilic M. Cigarette smoking induced oxidative stress may impair endothelial function and coronary blood flow in angiographically normal coronary arteries. Circ J. 2006;70:593–9. doi: 10.1253/circj.70.593. [DOI] [PubMed] [Google Scholar]
- 27.Aguilo A, Tauler P, Fuentespina E, Tur JA, Cordova A, Pons A. Antioxidant response to oxidative stress induced by exhaustive exercise. Physiology & Behavior. 2005;84:1. doi: 10.1016/j.physbeh.2004.07.034. [DOI] [PubMed] [Google Scholar]
Associated Data
This section collects any data citations, data availability statements, or supplementary materials included in this article.