

Abstract
Nanoconjugates composed of TiO2 nanoparticles, DNA oligonucleotides and a gadolinium contrast agent were synthesized for use in magnetic resonance imaging. Transfection of cultured cancer cells with these nanoconjugates showed them to be superior to the free contrast agent of same formulation with regard to 1) intracellular accumulation, 2) retention and 3) subcellular localization. Our results have shown that 48 hours after treatment, the concentration of gadolinium in nanoconjugate treated cells was 1000 fold higher compared to cells treated with contrast agent alone. Consequently, T1-weighted contrast enhancements were observed in cells treated with nanoconjugates but not in cells treated by the contrast agent alone. This type of nanoconjugate with increased retention time, Gd accumulation and intracellular delivery may find its use in gadolinium neutron-capture cancer therapy.
Keywords: nanoconjugates, magnetic resonance imaging, subcellular targeting
Introduction
Magnetic resonance imaging (MRI) is a non- or minimally- invasive method for in vivo imaging that permits down to a micrometer spatial resolution (1). Imaging using gadolinium (Gd) based MR contrast agents requires, under most circumstances, administration of a contrast agent either simultaneously with or shortly followed by imaging. Some of the recently developed Gd containing contrast agents (CA) have increased molecular weight and retention times. For example: gadolinium oxide nanoparticles (2, 3) and nanoparticle filled carbon nanohorns (3), GdPO4 dextran coated nanorods (4), Gd loaded nanoparticles (5, 6), micelles (7), liposomes (8), dendrimers (9), antibody-functionalized vesicles (10), and protein shells such as viral capsids (11) or apoferritin (12) have in some cases peak signal at 5 hours post injection (12). Imaging at time periods in excess of 24 hours post delivery is generally not possible for gadolinium-based contrast agents due to their rapid clearance (13). Prolonged retention of contrast agents in a tissue may be desirable since this would decrease the dependence of MR signals on blood-flow and tissue-perfusion factors, and comparisons of MR images immediately post delivery with the signal achieved at 24 hours or later post-delivery may bring a wealth of new approaches to MRI diagnostics.
In the work described here we used TiO2 nanoparticles to achieve intracellular and intranuclear, locally high Gd concentration, reaching a 1000-fold increase in Gd quantity on a per cell basis at 48 hours post-delivery when compared to the un-conjugated CA compound. The use of TiO2 nanoparticles as scaffolding provided us with chemistry solutions to functionalize the nanoconjugates and make them specific for selected subcellular compartments (14–18) which allows retention of nanoconjugates in subcellular compartments of up to several days. In the experiments presented here, cells treated with nanoconjugates of TiO2-DNA oligonucleotide-Gd contrast agent (TiO2-DNA-Gd) were imaged in cells by MRI 24 or 48 hours post-treatment.
Materials and Methods
Synthesis of contrast agent
The first step of synthesis process was synthesis of poly (L-glutamic acid) (PGA, Mn = 69.1 KDa, Mw = 80.8KDa,) using the procedure described by Idelson (19). Poly(L-glutamic acid) N-hydroxysuccinimide esters (PGA-OSu) (1) and 1,4,7,10-tetraazacyclododecane-1,4,7-tris(acetic acid)-10-(acetic acid-1,6-hexanediamine monoamide (2) were prepared according to the literature (20). The other reagents were purchased from Sigma-Aldrich (St. Louis, MO). Spectra/Por® 6 membrane (MWCO: 25,000) was purchased from Spectrum Laboratory, Inc. (Rancho Dominguez, CA).
The molecular weights of the polymers were determined by size exclusion chromatography (SEC) with poly((N-2-hydroxypropyl)methacrylamide) calibration on an AKTA FPLC system with a Superose 6 column, UV and refractive index detectors. The Gd wt % content in the copolymers was determined by inductively coupled plasma-optical emission spectroscopy (ICP-OES) (Perkin-Elmer, Norwalk, CT, Optima 3100XL). The content of dopamine in the conjugate was determined by UV spectroscopy.
PGA-1,6-hexanediamine-(Gd-DOTA)/Dopamine conjugate (5) was prepared according to Figure 1. Briefly, PGA-OSu (1, 80 mg), 1,4,7,10-tetraazacyclododecane-1,4,7-tris(acetic acid)-10-(acetic acid-1,6-hexanediamine monoamide) (2, 373 mg, 0.34 mmol), dopamine (3, 5.0 mg, 0.036 mmol), p-(dimethylamino)pyridine (55 mg, 0.45 mmol) and 2.0 mL triethylamine were added sequentially into 15 ml anhydrous DMF with stirring. The mixture was stirred overnight at room temperature and the solvent was then evaporated under vacuum. The product was precipitated from acetone. The precipitate was then dissolved in deionized water and the pH of the solution was adjusted to 5~6. An excess of Gd(OAc)3 (200 mg) was added to the solution and the mixture was stirred overnight at room temperature. Xylenol Orange indicator was added into the solution and EDTA was then added until the pink color disappeared. The polymer conjugate was purified by dialysis with Spectra/Por® 6 membrane (MWCO: 25,000). The solution was lyophilized to a pink product, which was dissolved in distilled water again and treated with sodium dithionite. After dialysis and lyophilization, a colorless final product was obtained. The yield was 67 mg. The molecular weight of the conjugate is 50.9 kDa (PDI = 1.17). Based on weight content (9% for Gd, 2.7% for dopamine), each molecule of contrast agent contains 28 molecules of gadolinium and 10 molecules of dopamine. Due to the rigidity and bulk of the contrast agent molecule, we anticipate that steric hindrance will make it unlikely that more than one dopamine per molecule of contrast agent establishes interactions with the TiO2 nanoparticle surface.
Figure 1.
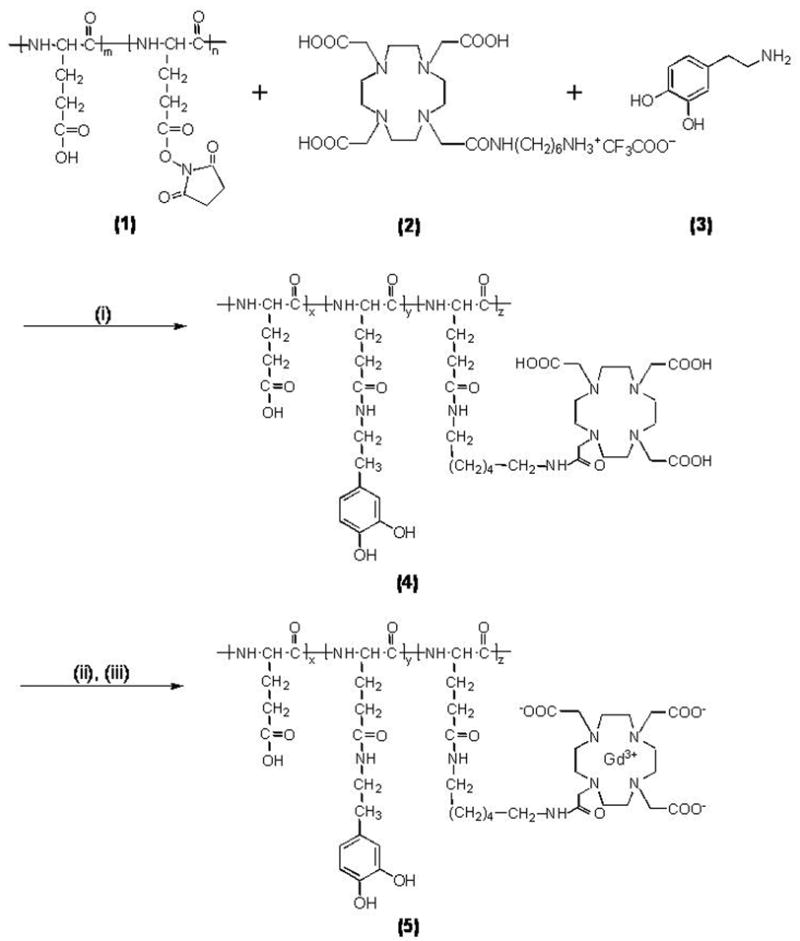
i) DMAP, DMF, rt, overnight, NaOH; ii) Gd(OAc)3, pH 5.0–5.5, rt, 24 h; iii) Na2-EDTA. (x = 0.03, y = 0.12 and z = 0.85).
Synthesis of nanoparticles and nanoconjugates
TiO2 nanoparticles were prepared by a modification of a procedure published by Rajh and others (14, 16, 21). For the experiments described here 0.8 μM (TiO2) 6 nm nanoparticles were used. The concentration of the nanoparticles was determined by ICP-MS. The size, dispersal and uniformity of nanoparticles were examined by atomic force microscopy and transmission electron microscopy.
Uncoated TiO2 nanoparticles were mixed with DNA oligonucleotides (synthesized with glycerol on 3′ end of the molecule) in the ratio (TiO2):oligonucleotide=1:7 (corresponding to approximately 1:0.01 ratio if number of active nanoparticle surface sites is considered). The oligonucleotide sequence was matching the sense stand of the R18S ribosomal RNA gene: 5′ ttccttggatgtggt-glycerol 3′ (R18Ss) universally present in mammalian cells (16). OH groups of glycerol bound loosely to the surface of the nanoparticles, similarly to the OH groups of phosphates (22). Such nanoconjugates were mixed with Gd CA in 1:69 molar ratio (for active surface sites ratio of 1:0.1). Because each CA molecule contained more than one Gd atom, with this stoichiometry we expected that the final molar ratio of (TiO2):Gd could be up to 1932:1. Using Inductively Coupled Plasma Mass Spectrometry (ICP-MS), however, we found the actual ratio to be maximally 630:1. This may be a result of steric hindrance between CA molecules as they compete for binding sites on the TiO2 nanoparticle surface. Conjugation between the dopamine-Gd CA molecule and TiO2 was immediate and the color of nanoparticonjugates upon binding changed from transparent-whitish to ochre; this was expected because binding all active surface sites of TiO2 with dopamine causes a color change to deep brown (21). Completed nanoconjugates were dialyzed in 10 mM sodium phosphate, purified and concentrated by centrifugation to 4 μM (TiO2-DNA-Gd) and stored at 4 °C.
Cell culture and nanoconjugate transfections
For transfection experiments MCF-7/W8/WS8 breast cancer cells (American Type Culture Collection ATCC) and PC3-M prostate cancer cells (ATCC) were grown in a 5% CO2 humidified atmosphere in RPMI1640 cell culture medium (this and all other standard cell culture supplements were Invitrogen/Gibco) supplemented with 10% fetal bovine serum and antibiotic-antimycotic. MCF-7/W8 media also contained insulin at a concentration of 10 μg/ml (Sigma), 200 mM L-glutamine and 10 mM Non-essential Amino Acids; while PC3-M media also contained 25 μg/ml G418 and 2.4 mg/ml HEPES. Nearly confluent cells were serum starved for 16 to 20 hours before transfection or treatment.
For SuperFect transfection, 60 μL of SuperFect reagent (Qiagen) and 300 μL of any one of the following: (1) Gd CA, (2) TiO2 nanoparticles, or (3) TiO2-DNA-Gd nanoconjugates; these mixtures were applied onto 16 million cells each. Final concentrations of these agents in the media were (1) 144 μM Gd; (2) 0.12 μM TiO2 nanoparticles, or (3) TiO2-DNA-Gd nanoconjugates wherein TiO2 nanoparticles were 0.12 μM and Gd was 75.6 μM in concentration. Media were exchanged for fresh complete cell media 24 hours later and, following an additional 24 hour incubation, cells were harvested for imaging.
For transfection by electroporation, cells were collected by trypsinization (0.05% trypsin, Invitrogen/Gibco) and resuspended in MZB solution (Tritech, Carlsbad, CA). For each electroporation: mix of 106 cells and 5 μl of nanoconjugate each was electroporated using the Mammozapper™ apparatus (Tritech, Carlsbad, CA) following the manufacturer’s instructions. The cells were placed in complete medium and allowed to grow for 24 hours before harvesting.
In all cases, cells harvested for MRI were embedded in 300 μL agarose phantoms. Once the MR imaging was completed, these phantoms were used for ICP-MS and/or preparation of paraffin embedded samples for sectioning and imaging by X-ray fluorescence imaging.
Magnetic Resonance Imaging
In order to prepare samples for MRI, 150 μl of Hank’s balanced buffered salt solution (HBBS; Invitrogen/Gibco) containing cells were mixed with 2% agarose melted in 150 μl of HBBS. Cells in agarose solidified as a plug and were transferred into tubes, placed in a water bath and imaged using a 1.5 T Siemens Sonata system (Erlangen, Germany) with a four channel head coil for signal reception and body coil for excitation. T1 of each sample was measured using an inversion recovery sequence with repetition time (TR) = 4000 ms and inversion times of 50, 200, 500, 800, 1000, 1200, 1500, and 2000 ms. Other scan parameters were: field of view = 125 × 200 mm2; acquisition matrix = 115 × 192; readout bandwidth = 965 Hz/pixel; slice thickness = 5 mm; all images were acquired in the coronal orientation.
For data analysis the raw data of signal intensity versus TI were fit to the equation:
Variables “A” and “C” are free parameters of the model. The confidence interval was determined statistically; R2 indicates goodness of fit. The TI corresponding to the lowest signal intensity (TInull) is an indication of the T1 value; a relationship estimated by the equation: T1 = TInull / ln(2). T1 values determined using the results of the equation fit and the null point relationship are listed in Table 1. Signal intensity, a quantitative metric of relative brightness, was measured with a circular region-of-interest within each sample.
Table 1.
T1 values of samples from Figure 1, calculated using two different approaches.
| cell number | Treatment (Transfection) |
Null Point Method | Equation Method | 95% CI (Eqn.Mth.) |
R2 (Eqn.Mth.)* |
Signal Intensity |
|---|---|---|---|---|---|---|
| 7×10⁶ | TiO2 –DNA – Gd (Electroporation) |
813 | 621 | ± 50 | 0.9841 | 428 |
| 15×106 | 759 | 615 | ± 43 | 0.9887 | 405 | |
| 5×10⁵ | TiO2 –DNA – Gd (SuperFect) |
446 | 626 | ± 84 | 0.9662 | 348 |
| 5×10⁶ | 205 | 351 | ± 68 | 0.9973 | 766 | |
| 5×10⁵ | Gd (SuperFect) |
1436 | 1799 | ± 28 | 0.9958 | 33 |
| 5×10⁶ | 1235 | 1625 | ± 27 | 0.9938 | 71 | |
| 5×10⁵ | TiO2 (SuperFect) |
1459* | 2210 | ± 20 | 0.9977 | 30 |
| 5×10⁶ | 1309 | 1783 | ± 40 | 0.9868 | 48 | |
| 5×10⁵ | Control | 1326* | 1608 | ± 36 | 0.9924 | 49 |
| 5×10⁶ | Control | 1245 | 1655 | ± 40 | 0.986 | 46 |
R2 indicates goodness of fit
X-ray fluorescence imaging
Agarose phantoms with cells used for MRI were embedded in paraffin and sectioned. Five micron thick sections were placed on silicon nitride (Si3N4) windows (Silson, UK). K alpha characteristic X-ray fluorescence of elements between P and Zn and L alpha shell characteristic X-ray fluorescence of Gd were mapped simultaneously in 2D using an ultra-LEGe energy dispersive detector (Canberra, Meriden, CT) (14, 16, 17). The XFM facility at the 2-ID-D beamline at the Advanced Photon Source at Argonne National Laboratory was used to produce hard X-rays with 10 keV energy were monochromatized and focused to a beam spot ~0.3×0.2 μm. The fluorescence spectra were acquired at every pixel and fitted with modified Gaussians corresponding to X-ray fluorescence lines. Elemental quantification against NBS thin film standards 1832 and 1833 (NIST, Gaithersburg, MD) and co-localization of elemental signals were investigated using MAPS program (23).
Results
MRI measurements were performed with PC3-M or MCF7 cells, 24 or 48 hours post-treatment, respectively. These two different types of cells were either transfected by electroporation or chemically (SuperFect reagent) with complete nanoconjugate or its components. Figure 2 shows a set of T1-weighted images acquired at an inversion time of 1000 ms. Signal enhancement was only observed in those samples that contained cells treated with TiO2-DNA-Gd while cell samples treated with TiO2 or “free” Gd CA showed no T1-weighted enhancement at this time. Results of signal intensity and T1 measurements done on samples in Figure 2 are shown in Table 1.
Figure 2.
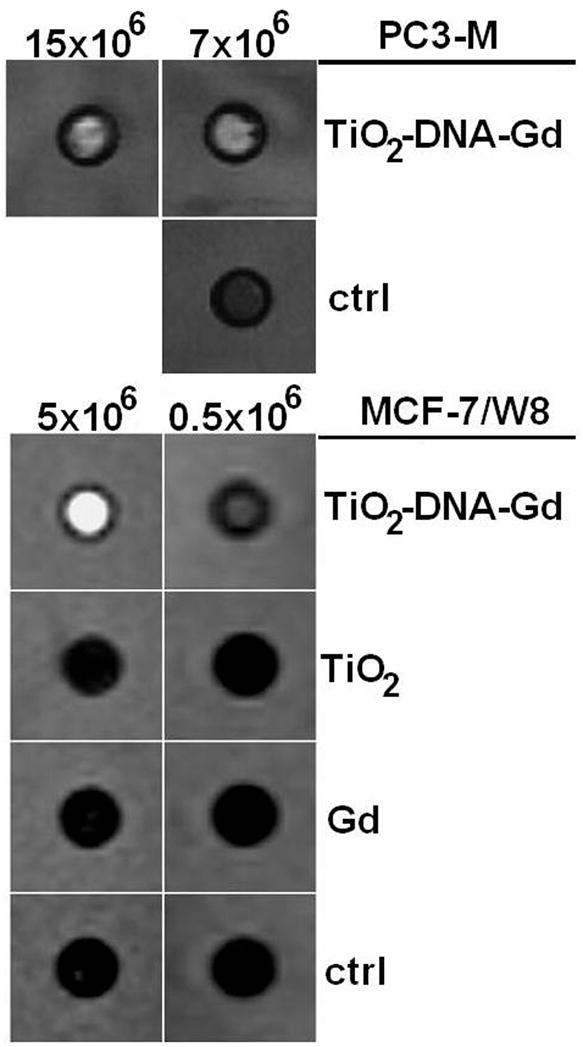
A T1-weighted image of samples containing PC3-M (transfected by electroporation) and MCF7 cells (transfected by SuperFect reagent) treated with TiO2-DNA-Gd, TiO2, Gd CA or nothing (Control). Differential T1-weighted signal enhancements from the samples labeled with TiO2-DNA-Gd CA with respect to other samples are apparent; T1 values for each of these samples are given in Table 1. These samples were prepared by embedding in agarose different numbers of cells from each treatment.
The use of the SuperFect transfection procedure showed no differences in cell viability between cells treated with TiO2 nanoparticles or TiO2-DNA-Gd nanoconjugates. Nevertheless, SuperFect-mediated transfection with such high quantities of nanoparticles resulted in high cell mortality (between 50 and 75% in different experiments), and we decided to improve cell viability by decreasing the nanoparticle quantity and performing the transfection by electroporation. Cell viability following electroporation was nearly 100%, and cells continued to grow in culture without any noticeable change in growth rate. While it has been suggested that Gd may be toxic for cells (24), our results demonstrate that the Gd conjugation did not change toxicity of nanoparticles.
Sections of agarose phantoms with embedded cells were analyzed by ICP-MS. If we consider that the volume of 5 × 10⁶ cells is at most 1/20 of the volume of the phantom (considering cellular r =10 μm, phantom V of 300 μL), the intracellular concentration of Gd in cells treated with Gd CA alone reaches an average of 0.75 μM, while intracellular concentration of Gd in cells treated with nanoconjugates reaches an average of 3940 μM. In terms of retention of the material present in the cell media during the first 24 hours of incubation, these numbers correspond to 0.75 μM/144 μM Gd or 0.5% Gd retention for the free contrast agent vs. 3940 μM/75.6 μM or 500% Gd retention for the TiO2- DNA-Gd nanoconjugate treatment. Therefore, at 48 hours post transfection, Gd in cells treated with nanoconjugates rather than the “free” Gd CA achieved about 1000-fold higher Gd concentration. This is a combined outcome of increasing nanoconjugate retention by using a DNA oligonucleotide as a tether (16) and by concentrating Gd through its binding it to a nanoparticle (groups of up to 630 Gd atoms travel as a package attached to the nanoparticle).
Figure 3 shows co-localization of Ti and Gd inside cells. XFM maps of two cells treated by TiO2-DNA-Gd show the positions of nuclei by the regions of more intense P and Zn signals, corresponding to location of DNA and Zn finger nuclear transcription factors, respectively (17). Localization of Ti and Gd in these cells overlaps with P and Zn, suggesting intranuclear nanoconjugate accumulation. The ratio of Ti:Gd in μg/cm2 varying between 1:7 and 1:14 does not reflect well the molar ratio of Ti:Gd considering that (i) the ratio (TiO2):Gd is 1:27 to 1:630; (ii) each TiO2 nanoparticle has 3320 Ti atoms, mwt~48dal, and (iii) Gd mwt~157dal; based on this, the expected weight ratio of Ti:Gd would be 37:1 to 37:23. This discrepancy between the expected and obtained Ti:Gd ratio can be explained by the fact that the calibration of XFM for elements that are detected by Lα fluorescence (such as Gd) and Kα fluorescence (such as Ti) may not be readily directly comparable.
Figure 3.
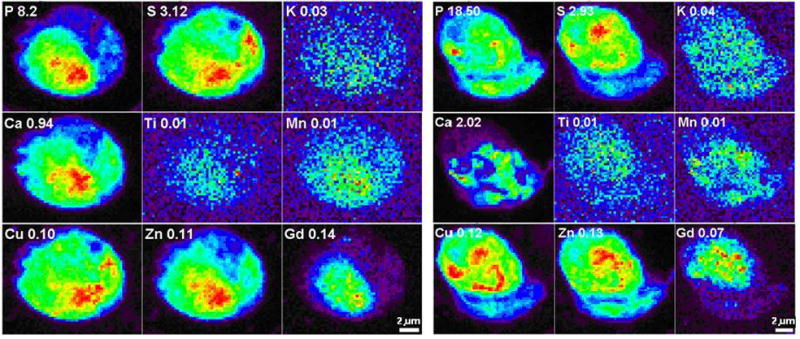
X-ray fluorescence maps of 2 whole MCF-7/W8 cells transfected with TiO2-DNA oligonucleotide-Gd CA nanoconjugates. Elemental maps of P, S, K, Ca, Ti, Mn, Cu, Zn and Gd in two cells treated with nanoconjugates for 24 hours and then “washed” for 24 hours in nanoconjugate-free medium. Elemental maps show the range of concentrations in the sample in a rainbow color scale from highest (red) to lowest signal (black). Elemental concentrations are given in micrograms per cm2.
Discussion
We have prepared a nanoconjugate-bound contrast agent that has the capacity to provide increased T1-weighted contrast enhancement and prolonged presence/retention in cells compared to the free contrast agent. Under the present experimental conditions (~1% of the nanoparticle surface covered by DNA oligonucleotide and ~10 % of the nanoparticle surface covered with CA) an intracellular Gd concentration increase of 1000-fold in comparison to free CA was achieved. Most of the other nanoparticles described in the literature are larger in size which allows for a high Gd load. For example, Zhu and others describe 130 nm nanoparticles that can be loaded with up to 105 Gd atoms (5). With our 6 nm nanoparticles we found loading of up to 630 Gd atoms per nanoparticle. Unlike larger nanoparticles, however (18), nanoconjugates used in this study are sufficiently small to be easily taken up by the cells, as shown. Nanoparticles in excess of 20 nm experience difficulties in cellular uptake (18), and the 130 nm nanoparticles coated with Gd may be expected to remain in the space between cells. Furthermore, due to an oligonucleotide that recognized intracellular target, nanoconjugates described here are endowed with long intracellular retention times (16); while the CA agent used on its own shows minimal long-term tissue retention (20). In addition, nanoparticles described here still have a large number of potential binding sites for other molecules that can functionalize them for additional boost to tumor uptake and retention. For example, coating with folic acid facilitates tumor cell internalization and retention of other types of Gd-nanoparticles tested in vivo (6). In the future, we too may attempt to use folic acid or glucose to target these nanoconjugates to tumor tissues in vivo. Both molecules possess free OH groups that could be used to functionalize TiO2 nanoparticles. Glucose in particular may be an interesting molecule, since it has been used successfully for tumor-specific imaging by positron emission tomography. It is possible that the ability to use CA with long tumor retention will enable development of new procedures for MR imaging, the benefits of which we may not be aware of at this time.
The nanoconjugate with Gd contrast agent may provide us with a future opportunity to compare immediate MRI signal gain (dependent upon vascular permeability and tissue perfusion) with delayed MRI signal (>24 hours post treatment; dependent on cellular uptake of the nanoconjugate). If retention of nanoconjugates for prolonged periods of time is associated with target specific interaction between nanoconjugate and cells, we can achieve both signal amplification (T1-weighted enhancements) and cell specific delivery. Moreover, if sufficient concentration of 157Gd can be achieved (157Gd makes about 16% of natural Gd(III)), especially in close proximity to its primary target—nuclear DNA, this type of treatment could be used as a preparatory step for neutron capture therapy. Neutron capture therapy leads to local production of high linear energy transfer radiation, with subsequent production of Auger electrons (8, 25, 26). Due to target dependent retention of nanoconjugate associated Gd, if neutron capture therapy is to be attempted, target cells would be by the most affected by this treatment, while normal tissues would suffer very limited radiation damage. By altering the coating of the nanoconjugates we can change the intensity of the MR signal (more or less Gd contrast agent can be attached per nanoparticle); and/or change the specificity of the nanoconjugate for homing into different cell types or subcellular localities (by changing the oligonucleotide sequence or adding other conjugates onto the nanoparticle surface). These types of nanoconjugate modulations could further increase usefulness of Gd containing nanoconjugates in imaging and therapy.
Supplementary Material
TI null values for 5 × 10⁵ cells samples transfected by different agents using SuperFect reagent. This figure illustrates the Null Point Method for T1 calculation.
Acknowledgments
This work was supported in part by the following NIH grants: CA107467, EB002100, P50 CA89018, U54CA119341, by DOE FG02-04 ER 63920 and Siemens Medical Solutions. Use of the Advanced Photon Source was supported by the U. S. Department of Energy, Office of Science, Office of Basic Energy Sciences, under Contract No. W-31-109-Eng-38.
References
- 1.Fuster V, Kim RJ. Frontiers in cardiovascular magnetic resonance. Circulation. 2005;112(1):135–144. doi: 10.1161/01.CIR.0000155618.37779.A0. [DOI] [PubMed] [Google Scholar]
- 2.McDonald MA, Watkin KL. Investigations into the physicochemical properties of dextran small particulate gadolinium oxide nanoparticles. Acad Radiol. 2006;13(4):421–427. doi: 10.1016/j.acra.2005.11.005. [DOI] [PubMed] [Google Scholar]
- 3.Miyawaki J, Yudasaka M, Imai H, Yorimitsu H, Isobe H, Nakamura E, et al. Synthesis of ultrafine Gd2O3 nanoparticles inside single-wall carbon nanohorns. J Phys Chem B. 2006;110(11):5179–5181. doi: 10.1021/jp0607622. [DOI] [PubMed] [Google Scholar]
- 4.Hifumi H, Yamaoka S, Tanimoto A, Citterio D, Suzuki K. Gadolinium-based hybrid nanoparticles as a positive MR contrast agent. J Amer Chem Soc. 2006;128(47):15090–15091. doi: 10.1021/ja066442d. [DOI] [PubMed] [Google Scholar]
- 5.Zhu DH, White RD, Hardy PA, Weerapreeyakul N, Sutthanut K, Jay M. Biocompatible nanotemplate-engineered nanoparticles containing gadolinium: Stability and relaxivity of a potential MRI contrast agent. J Nanosci Nanotech. 2006;6(4):996–1003. doi: 10.1166/jnn.2006.169. [DOI] [PubMed] [Google Scholar]
- 6.Oyewumi MO, Yokel RA, Jay M, Coakley T, Mumper RJ. Comparison of cell uptake, biodistribution and tumor retention of folate-coated and PEG-coated gadolinium nanoparticles in tumor-bearing mice. J Controlled Release. 2004;95(3):613–626. doi: 10.1016/j.jconrel.2004.01.002. [DOI] [PubMed] [Google Scholar]
- 7.Briley-Saebo KC, Amirbekian V, Mani V, Aguinaldo JGS, Vucic E, Carpenter D, et al. Gadolinium mixed-micelles: Effect of the amphiphile on in vitro and in vivo efficacy in apolipoprotein E knockout mouse models of atherosclerosis. Mag Reson Med. 2006;56(6):1336–1346. doi: 10.1002/mrm.21094. [DOI] [PubMed] [Google Scholar]
- 8.Le UM, Cui ZG. Biodistribution and tumor-accumulation of gadolinium (Gd) encapsulated in long-circulating liposomes in tumor-bearing mice for potential neutron capture therapy. International J Pharmaceut. 2006;320(1–2):96–103. doi: 10.1016/j.ijpharm.2006.04.009. [DOI] [PubMed] [Google Scholar]
- 9.Kobayashi H, Brechbiel MW. Nano-sized MRI contrast agents with dendrimer cores. Advanced Drug Del Rev. 2005;57(15):2271–2286. doi: 10.1016/j.addr.2005.09.016. [DOI] [PubMed] [Google Scholar]
- 10.Sipkins DA, Cheresh DA, Kazemi MR, Nevin LM, Bednarski MD, Li KCP. Detection of tumor angiogenesis in vivo by alpha(v)beta(3)-targeted magnetic resonance imaging. Nat Med. 1998;4(5):623–626. doi: 10.1038/nm0598-623. [DOI] [PubMed] [Google Scholar]
- 11.Anderson EA, Isaacman S, Peabody DS, Wang EY, Canary JW, Kirshenbaum K. Viral nanoparticles donning a paramagnetic coat: Conjugation of MRI contrast agents to the MS2 capsid. Nano Lett. 2006;6(6):1160–1164. doi: 10.1021/nl060378g. [DOI] [PubMed] [Google Scholar]
- 12.Crich SG, Bussolati B, Tei L, Grange C, Esposito G, Lanzardo S, et al. Magnetic resonance visualization of tumor angiogenesis by targeting neural cell adhesion molecules with the highly sensitive gadolinium-loaded apoferritin probe. Cancer Res. 2006;66(18):9196–9201. doi: 10.1158/0008-5472.CAN-06-1728. [DOI] [PubMed] [Google Scholar]
- 13.Merbach A, Toth E. The chemistry of contrast agents in magnetic resonance imaging. Chichester, UK: Willey; 2001. [Google Scholar]
- 14.Paunesku T, Rajh T, Wiederrecht G, Maser J, Vogt S, Stojicevic N, et al. Biology of TiO2- oligonucleotide nanocomposites. Nat Mater. 2003;2(5):343–6. doi: 10.1038/nmat875. [DOI] [PubMed] [Google Scholar]
- 15.Paunesku T, Stojicevic N, Vogt S, Maser J, Lai B, Rajh T, et al. Intracellular localization of titanium dioxide-biomolecule nanocomposites. J Physique Iv. 2003;104:317–319. [Google Scholar]
- 16.Paunesku T, Vogt S, Lai B, Maser J, Stojicevic N, Thurn KT, et al. Intracellular Distribution of TiO(2)-DNA Oligonucleotide Nanoconjugates Directed to Nucleolus and Mitochondria Indicates Sequence Specificity. Nano Lett. 2007;7(3):596–601. doi: 10.1021/nl0624723. [DOI] [PMC free article] [PubMed] [Google Scholar]
- 17.Paunesku T, Vogt S, Maser J, Lai B, Woloschak G. X-ray fluorescence microprobe imaging in biology and medicine. J Cell Biochem. 2006;99(6):1489–1502. doi: 10.1002/jcb.21047. [DOI] [PubMed] [Google Scholar]
- 18.Thurn KT, Brown EMB, Wu A, Vogt S, Lai B, Maser J, et al. Nanoparticles for Applications in Cellular Imaging. Nanoscale Res Lett. 2007;2(9):430–441. doi: 10.1007/s11671-007-9081-5. [DOI] [PMC free article] [PubMed] [Google Scholar]
- 19.Idelson M, Blout ER. Polypeptides. 18 A Kinetic Study of the Polymerization of Amino Acid N-Carboxyanhydrides Initiated by Strong Bases. J Amer Chem Soc. 1958;80(10):2387–2393. [Google Scholar]
- 20.Ke TY, Feng Y, Guo JY, Parker DL, Lu ZR. Biodegradable cystamine spacer facilitates the clearance of Gd(III) chelates in poly(glutamic acid) Gd-DO3A conjugates for contrast-enhanced MR imaging. Mag Reson Imaging. 2006;24(7):931–940. doi: 10.1016/j.mri.2006.03.009. [DOI] [PubMed] [Google Scholar]
- 21.Rajh T, Chen LX, Lukas K, Liu T, Thurnauer MC, Tiede DM. Surface restructuring of nanoparticles: An efficient route for ligand-metal oxide crosstalk. J Phys Chem B. 2002;106(41):10543–10552. [Google Scholar]
- 22.Michelmore A, Gong WQ, Jenkins P, Ralston J. The interaction of linear polyphosphates with titanium dioxide surfaces. Phys Chem Chem Phys. 2000;2(13):2985–2992. [Google Scholar]
- 23.Vogt S, Maser J, Jacobsen C. Data analysis for X-ray fluorescence imaging. J Physique Iv. 2003;104:617–622. [Google Scholar]
- 24.Cacheris WP, Quay SC, Rocklage SM. The relationship between thermodynamics and the toxicity of gadolinium complexes. Magn Reson Imaging. 1990;8(4):467–81. doi: 10.1016/0730-725x(90)90055-7. [DOI] [PubMed] [Google Scholar]
- 25.Hofmann B, Fischer CO, Lawaczeck R, Platzek J, Semmler W. Gadolinium neutron capture therapy (GdNCT) of melanoma cells and solid tumors with the magnetic resonance imaging contrast agent Gadobutrol. Invest Radiol. 1999;34(2):126–33. doi: 10.1097/00004424-199902000-00005. [DOI] [PubMed] [Google Scholar]
- 26.De Stasio G, Casalbore P, Pallini R, Gilbert B, Sanita F, Ciotti MT, et al. Gadolinium in human glioblastoma cells for gadolinium neutron capture therapy. Cancer Res. 2001;61(10):4272–7. [PubMed] [Google Scholar]
Associated Data
This section collects any data citations, data availability statements, or supplementary materials included in this article.
Supplementary Materials
TI null values for 5 × 10⁵ cells samples transfected by different agents using SuperFect reagent. This figure illustrates the Null Point Method for T1 calculation.