Abstract
microRNAs (miRNAs) are challenging molecules to amplify by PCR because the miRNA precursor consists of a stable hairpin and the mature miRNA is roughly the size of a standard PCR primer. Despite these difficulties, successful real-time RT-PCR technologies have been developed to amplify and quantify both the precursor and mature microRNA. An overview of real-time PCR technologies developed by us to detect precursor and mature microRNAs is presented here. Protocols describe presentation of the data using relative (comparative CT) and absolute (standard curve) quantification. Real-time PCR assays were used to measure the time course of precursor and mature miR-155 expression in monocytes stimulated by lipopolysaccharide. Protocols are provided to configure the assays as low density PCR arrays for high throughput gene expression profiling. By profiling over 200 precursor and mature miRNAs in HL60 cells induced to differentiate with 12-O-tetradecanoylphorbol-13-acetate, it was possible to identify miRNAs who’s processing is regulated during differentiation. Real-time PCR has become the gold standard of nucleic acid quantification due to the specificity and sensitivity of the PCR. Technological advancements have allowed for quantification of miRNA that is of comparable quality to more traditional RNAs.
Keywords: Lipopolysaccharide, Differentiation, microRNA biogenesis, High throughput gene expression profiling, miR-155
1. Introduction
microRNAs (miRNAs) are small, regulatory, noncoding RNAs. miRNA genes are located within introns of coding or noncoding genes, exons of noncoding genes or in inter-genic regions [1]. miRNA genes are transcribed by RNA polymerase II to generate large precursor molecules called the primary precursor miRNA (pri-miRNA) [2]. The primiRNA is processed in the nucleus by the ribonuclease Drosha/DGCR8 to produce the microRNA precursor (pre-miRNA) [3]. Pre-miRNA is transported to the cytoplasm via Exportin 5 [4,5] and then processed by Dicer to generate an active, mature miRNA.
miRNA was discovered in Caenorhabditis elegans in the Ruvkun [6] and Ambros labs [7] in 1993. In 2001, considerable interest in the field was generated when large numbers of miRNAs were discovered in C. elegans, drosophila and human cells [8–10]. miRNA differs considerably from traditional RNAs (e.g. mRNA, rRNA or snoRNA) since the mature miRNA is approximately 21 nts in length and the miRNA precursor exists as a stable hairpin. Early on, tried and true technologies to analyze traditional RNAs were adapted to study miRNA. These include Northern blotting [9], RNAse protection assays and cDNA arrays [11,12]. The first real-time PCR method to quantify miRNA (e.g. miRNA precursors) was developed by one of us (Schmitt-gen et al.) in 2004 [13]. Shortly thereafter, another one of us (Chen et al.) developed a real-time PCR assay to quantify mature miRNA [14]. Other PCR-based technologies have been published that includes extending the size of the mature miRNA by primer extension or using poly A polymerase [15,16]. This article will focus on real-time PCR methodologies developed by us to amplify and quantify both precursor and mature miRNA.
2. Real-time PCR detection of precursor miRNA
2.1. Introduction
Mature miRNA is the active species and exerts its activity by binding to the 3′ untranslated region of mRNA. Quantification of the active, mature miRNA, rather than the inactive, pre-miRNA, is generally preferred. We completed several studies that profiled the expression of several hundred miRNA precursors in cancer cell lines [17,18] and tissues [19]. Quantification of miRNA precursor was also used to validate the results obtained from miRNA array profiling experiments [12,20,21]. Situations exist where it is desirable to measure both the precursor and mature miRNA. As demonstrated in several studies by Northern blotting, pre-miRNA is often detectable while the mature miRNA is undetectable [22–24]. These studies suggest that in certain situations, miRNA biogenesis may be regulated at the level of nuclear transport or perhaps Drosha or Dicer processing. Having the ability to measure both precursor and mature miRNA using sensitive real-time PCR, allows one to pin point specific sites for which regulation may exists in the miRNA biogenesis pathway.
2.2. Primer design
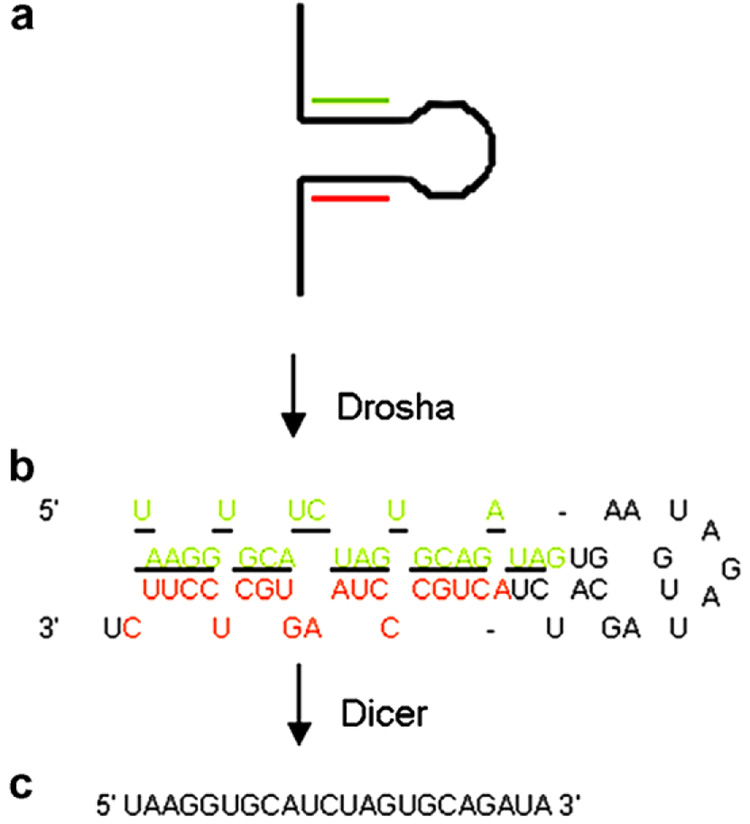
Pre-miRNA exists as a stable hairpin of approximately 70 nts in length (Fig. 1). To amplify the pre-miRNA, for-ward and reverse primers were designed to anneal to the stem portion of the hairpin (Fig. 1). Pre-miRNA sequences were obtained from the miRNA registry [25]. Precursor sequences listed in the miRNA registry do not represent the identical pre-miRNA sequence and contain additional nts that are 5′ and 3′ of the hairpin. The putative sequence of the pre-miRNA was determined by the rules based upon Drosha processing, including a 2 nts overhang at the 3′ end of the precursor. If the mature miRNA is located on the 5′ end of the miRNA precursor, then the 5′ portion of the mature miRNA will be the 5′ most nts of the precursor. If the mature miRNA is located on the 3′ end of the pre-miRNA, then the 3′ overhang of the pre-miRNA is composed of the 3′ end of the mature miRNA. Shown in Fig. 1 is an example of a pre-miRNA with a 5′ mature miRNA.
Fig. 1. miRNA processing and primer design for pre-miRNA.
miRNAs such as human miR-18 are transcribed as a (a) large primary precursor (pri-miRNA) that is processed by the nuclear enzyme Drosha to produce the (b) putative 62 nts precursor miRNA (pre-miRNA). Both the pri-miRNA and pre-miRNA contain the hairpin structure. The underlined portion of the pre-miRNA represents the sequence of the (c) 22 nts mature miRNA that is processed from the pre-miRNA by the ribonuclease Dicer. Green, hybridization sequence of the forward primer; Red, hybridization sequence of the reverse primer. (For interpretation of color mentioned in this figure legend the reader is referred to the web version of the article.)
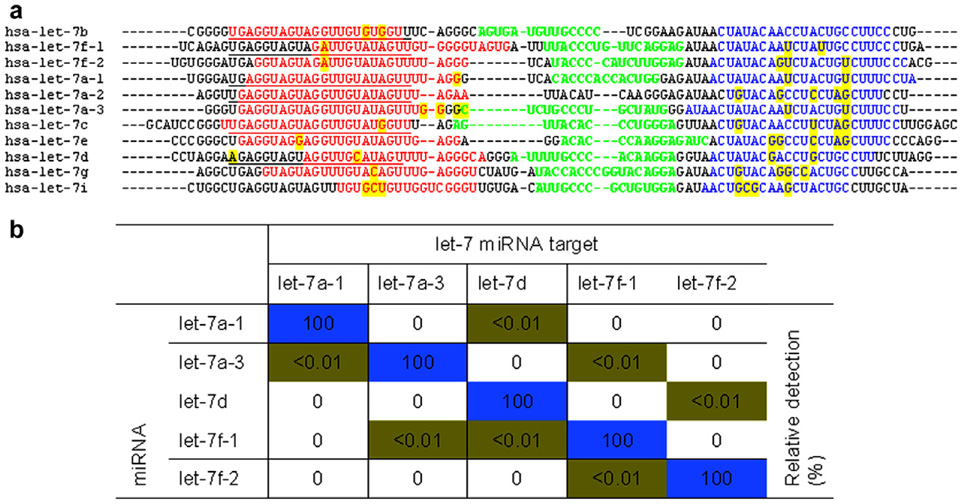
Isoforms present another issue that needs to be carefully considered when designing assays to quantify miRNA. Numerous miRNAs exists as isoforms of nearly identical mature and precursor sequences [25]. Using SYBR green detection, it is often not possible for the PCR primers designed to the hairpin to discriminate among the various isoforms. This issue can be resolved with TaqMan™ MGB probes that anneal to the loop portion of the precursor (Section 2.3). Pre-designed TaqMan™ MGB probes to pre-miRNA are not commercially available. It is not practical to purchase dozens of TaqMan™ probes to all the miRNA isoforms as was done for the let-7 family (Fig. 2). Using SYBR green detection, there may be situations where one is amplifying multiple miRNA precursors. Primers reported in our prior publication with multiple miRNAs (e.g. miR-124a, b, c) represent such miRNAs [17].
Fig. 2. Primer and TaqMan™ probe sequences to let-7 miRNA isoforms.
(a) The sequences of the miRNA precursors for the members of the human let-7 family of miRNA isoforms are shown. Underlined, sequence of the mature miRNA; red, sequences of the forward PCR primers; blue, sequences of the reverse PCR primers; green, sequences of the TaqMan™ MGB probe; yellow, priming sequences that differ among isoforms. Sequences are in the 5′ to 3′ direction. (b) Real-time PCR was attempted on miRNA precursor genes cloned into plasmids using gene specific primers and TaqMan™ MGB probes. The relative detection was calculated based upon the CT difference between the perfectly matched and mismatched targets. Reproduced by permission of Oxford University Press. (For interpretation of color mentioned in this figure legend the reader is referred to the web version of the article.)
Primers were designed using Primer Express version 2.0 (Applied Biosystems, Foster City, CA). The following criteria were used during the primer design. Both sense and antisense primers were designed to be located within the hairpin sequence of the miRNA precursors (Fig. 1). A maximal extension of 4 nts in the 5′ direction was allowed for each primer over the presumed termini of the pre-miRNA. Primers were designed with a maximal Tm difference between both primers of ≤2°C and a primer length between 18 and 24 nts. An ideal Tm of 55–59 °C was selected for the primers, however due to size constraints, some primers were designed with a Tm that was below 55 °C. Additional criteria included no 3′ GC clamps, and a minimal amplicon size of 55 bp. Since the hairpin is contained within both the pri-miRNA and the pre-miRNA, primers designed to the hairpin should simultaneously amplify both RNAs.
Following extensive validation, some primers designed to amplify the hairpin of the pre-miRNA did not effectively work. Issues include weak signal on genomic DNA amplification or multiple dissociation peaks following the thermal dissociation protocol. In these situations, we choose to design primers to the pri-miRNA. Both forward and reverse primers were designed to anneal to ~50 bp on the 5′ and 3′ direction of the hairpin. Primers that were designed in this manner are listed with the designation (P) for pri-miRNA [17]. Primers to over 200 pre-miRNAs were previously published [17].
2.3. TaqMan™ probe design
TaqMan™ minor groove binding (MGB) probes were used to discriminate 11 of the let-7 family of isoforms [17]. These probes were designed to anneal to the loop portion of the miRNA precursor (Fig. 2). Addition of the MGB to the TaqMan™ probe increases the Tm of very small probes; this is critical since the amount of sequence in between the PCR primers on the hairpin is very small. TaqMan™ MGB probes were designed using Primer Express software and are typically designed to have a Tm that is 10 °C higher than the primers. Probes were designed to have a 5′ FAM and a MGB at the 3′ end. All TaqMan™ MGB probes were synthesized by Applied Biosystems. Sequences of the primers and TaqMan™ MGB probes to the let-7 family were previously published [17].
2.4. Reverse transcription
For quantitative PCR studies of both precursor and mature miRNA, we routinely isolate total RNA from cultured cells or tissues using TRIZOL (Invitrogen, Carlsbad, CA) per the manufacturer’s protocol. Total RNA is briefly exposed to RNAase-free DNAase I [13]. RNA is reverse transcribed to cDNA using a gene specific primer (i.e. the antisense PCR primer) and Thermoscript, thermostable reverse transcriptase (Invitrogen). We demonstrated that in order to reverse transcribe stable hairpins, such as those found in pre-miRNA, optimal reverse transcription efficiency was determined by priming long, gene specific primers at an elevated temperature rather than short primers (random hexamers) at room temperature [13]. We typically reverse transcribe 1 µg of DNase treated total RNA. A 10.5 µl reaction was assembled using 10 µM of the anti-sense primer and a primer for the internal control (typically 18S rRNA). The reaction was heated to 80 °C for 5 min to denature the RNA, followed by a 5 min incubation at 60 °C to anneal the primers. The reactions were cooled to room temperature and the remaining reagents (5× buffer, dNTPs, DTT, RNase inhibitor, Thermoscript) were added as specified in the Thermoscript protocol. The reaction proceeded for 45 min at 60 °C followed by a 5 min incubation at 85 °C to inactivate the Thermoscript RT. cDNA may be stored indefinitely at −20° or −80 °C.
2.5. Real-time PCR, relative quantification
Real-time quantitative PCR was performed using standard protocols on an Applied Biosystems 7900HT Sequence Detection System equipped with a 384-well reaction plate. Briefly, 2 µl of a 1/100 dilution of cDNA in water was added to 5 µl of the 2× SYBR green PCR master mix (Applied Biosystems), 800 nM of each primer and water to 10 µl. For profiling (Section 5) we typically use 5 µl reactions. The reactions were amplified for 15 s at 95 °C and 1 min at 60 °C for 40 cycles. The thermal denaturation protocol was run at the end of the PCR to determine the number of products that were present in the reaction. Reactions are typically run in duplicate. The cycle number at which the reaction crossed an arbitrarily-placed threshold (CT) was determined for each gene and the relative amount of each miRNA to 18 S rRNA was described using the equation 2−ΔCT where ΔCT = (CTmiRNA − CT18S rRNA) [26].
2.6. Real-time PCR, absolute quantification
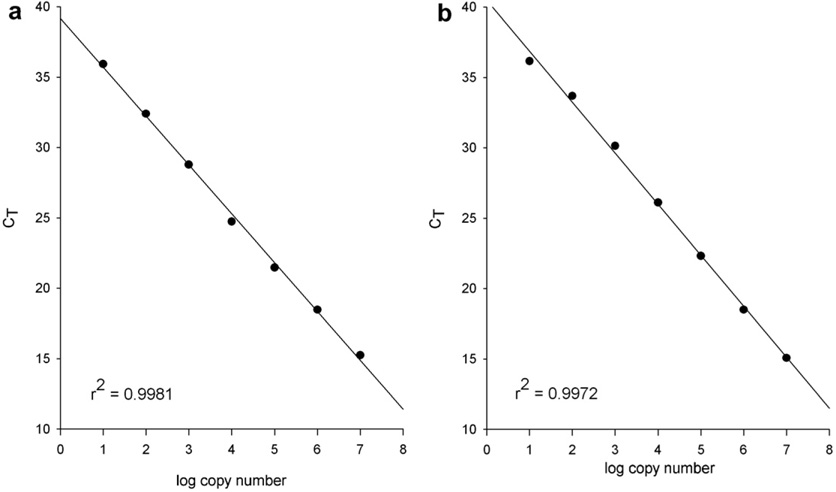
Absolute copy number of miR-155 precursor was determined by constructing a standard curve of pre-miR-155. Pre-miRNA RNA was synthesized using in vitro transcription using primers that annealed to ~50 bp upstream and downstream of the miR-155 hairpin. The T7 promoter sequence was added to 5′ end of the forward primer. Amplification of the pri-miRNA gene was performed by amplifying genomic DNA (Roche) using standard procedures. The PCR template was desalted using MicroSpin™ G-25 Column (Amersham Biosciences) and served as template for in vitro transcription using AmpliScribe™ T7 Transcription kit (Epicentre). The transcription product was gel-purified and the concentration was measured using a Nanodrop spectrophotometer. The copy number was calculated by oligo concentration and molecular weight of the transcript. The RT reaction was performed as described above. An example of the standard curve for pre-miR-155 is shown in Fig. 3a. We also generated a standard curve for mature miR-155 using the technology described in Section 3 (Fig. 3b). For mature miR-155, synthesized oligo was gel purified and quantified as described above.
Fig. 3. Determination of precursor and mature miRNA copy number.
Standard curves were constructed for miR-155 precursor (a) and mature miR-155 (b) using the real-time PCR assays described in the text. Tenfold dilutions of pre-miR-155 (a) or mature miR-155 (b) RNA oligos was quantified by real-time PCR. Both assays produced a 6-log dynamic range, lower limit of detection of 10 copies and an R2 > 0.99.
3. Description of TaqMan™ microRNA Assays (mature microRNA)
3.1. How TaqMan™ MicroRNA Assays work
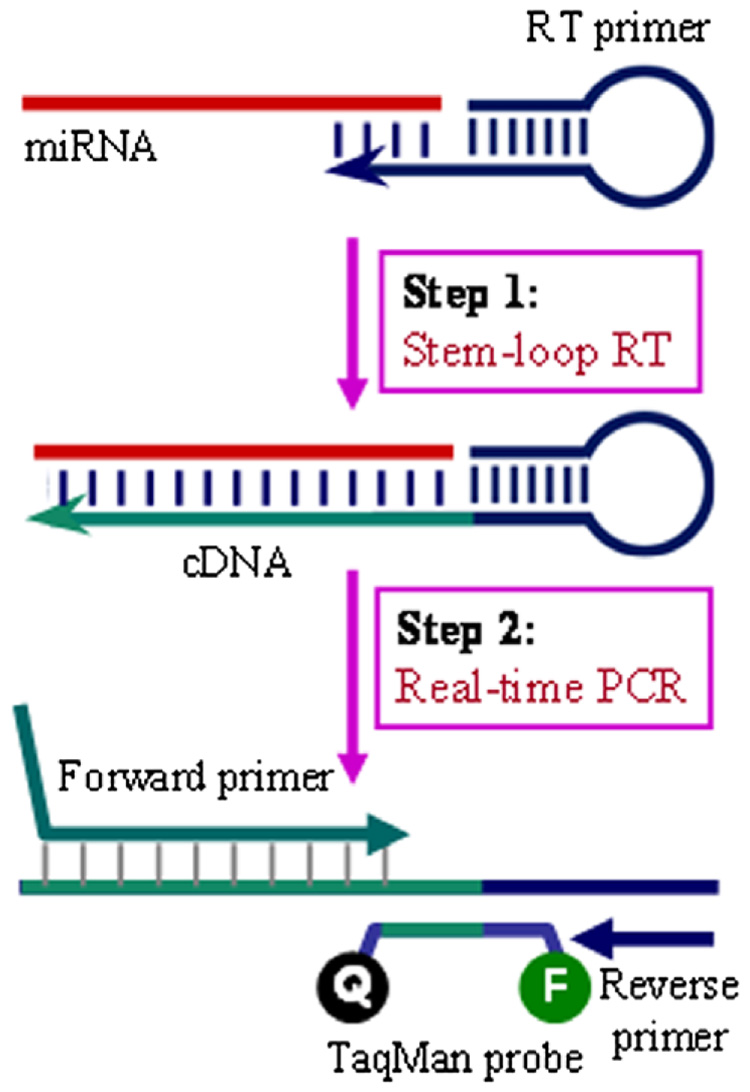
The TaqMan™ microRNA Assays are quantitative RT-PCR assays and are designed to detect and accurately quantify mature miRNAs. The principle of the TaqMan™ microRNA Assays is similar to conventional TaqMan™ RT-PCR ones. A major difference is the use of a stem-loop primer during the RT reaction (Fig. 4). There are several advantages to using stem-loop RT primers. First, by annealing a short RT priming sequence to the 3′ portion of the miRNA, it has better specificity for discriminating similar miRNAs. Second, its double-stranded stem structure inhibits hybridization of the RT primer to miRNA precursors and other long RNAs. Third, the base stacking of the stem enhances the stability of miRNA and DNA hetero-duplexes, improving the RT efficiency for relatively short RT primers (the portion bound to the 3′ end of miRNAs). Finally, the stem-loop structure, when unfolded, adds sequence downstream of the miRNA after reverse transcription (Fig. 4). The resulting longer RT product presents a template more amenable to real-time TaqMan™ assay design. The high sensitivity and specificity is largely contributed by the specific forward PCR primer and TaqMan™ probe.
Fig. 4. Schematic description of TaqMan™ MicroRNA Assays.
The structure and design of the miRNA stem-loop RT primer is shown as it first binds to the specific miRNA target, and is extended during the RT reaction (step 1). In step 2, the stem-loop opens up during annealing and extension in the follow-up TaqMan™ PCR reaction.
3.2. How to perform TaqMan™ MicroRNA Assays
TaqMan MicroRNA™ Assays include RT and real-time PCR two steps only. The RT reactions are performed using a single miRNA-specific stem-loop RT primer (Fig. 3). Prior to RT, the RNA should be extracted using the mir-Vana™ kit (Ambion, Austin, TX) or another PCR compatible method. Then, 15 (1–150) ng of total RNA is combined in the 15 µl (total reaction volume) RT reaction with: 1.5 µl 10× RT-PCR buffer, 1 µl of 50U/µl Multi-Scribe RT enzyme, 0.15 µl 100× dNTP mix, 0.19 l 20U/µl RNase-inhibitor, and 3 µl 5× specific RT-primer (the remainder of the reaction is made up of RNA and nuclease- free water). All components (except RNA and RT primer) can be found in the TaqMan™ MicroRNA Reverse Transcription Kit (P/N 4366596 or 4366597, Applied Bio-systems, Foster City, CA). The RT reactions were incubated on a GeneAmp® PCR System 9700 (Applied Biosystems or other compatible) thermocycler: 16 °C/ 30 m, 42 °C/30 m, 85 °C/5 m, 4 °C/hold. Abundant miR-NAs can be detected and accurately quantitated with reduced total RNA input.
Each individual RT reaction has a unique set of PCR primers and TaqMan™ probe designed for it. Once the RT reactions are complete, the PCR reactions can be assembled. For a 10 µl reaction (recommended if using 384-well plates), combine 5 µl 2× Universal MasterMix without UNG (P/N: 4324018, Applied Biosystems), 0.66 µl of the RT product, 0.5 µl 20× TaqMan™ Assay, and 3.84 µl nuclease-free water. If using 96-well plates, the recommended reaction size is 20 µl, so each component should be doubled in volume. PCR reactions are incubated in a 384-well plate at 95 °C for 10 min, followed by 40 cycles of 95 °C for 15 s and 60 °C for 1 min. It is recommended to run the real-time PCR reactions in triplicate or quadruplicate and use the averages, discarding any outlier (>2 standard deviations), to perform subsequent analyses.
4. Simultaneous detection of precursor and mature miRNA
To demonstrate our ability to simultaneously measure pre-and mature miRNA and to show how the levels of precursor and mature change over time, a system was selected in which the expression of a particular miRNAs was induced with stimuli. We used the induction of miR-155 in human monocytes following stimuli with lipopolysac-charide (LPS). Pure CD14-positive human monocytes were collected from the fresh human blood of normal donors. LPS (LPS Westphal preparation, Escherichia coli0127:B8; Difco, Detroit, MI) was added to the freshly isolated monocytes at a concentration of 1 mg/ml. All of our media and reagents have been documented to have subpicogram amounts of endotoxin contamination. In all experiments, monocytes were incubated at a concentration of 1 × 10⁶ cells/ml in complete RPMI 1640 (with FBS) at 37 °C in 5% CO2. Monocytes were cultured as a suspension in 5-ml polystyrene tubes (No. 14959-10A; Fisher Scientific, Hampton, NH) to prevent sticking and activation of the cells. Cells were harvested at 0.5, 1, 2, 3, 6, 12, and 24 h of incubation and total RNA was isolated using the Trizol reagent.
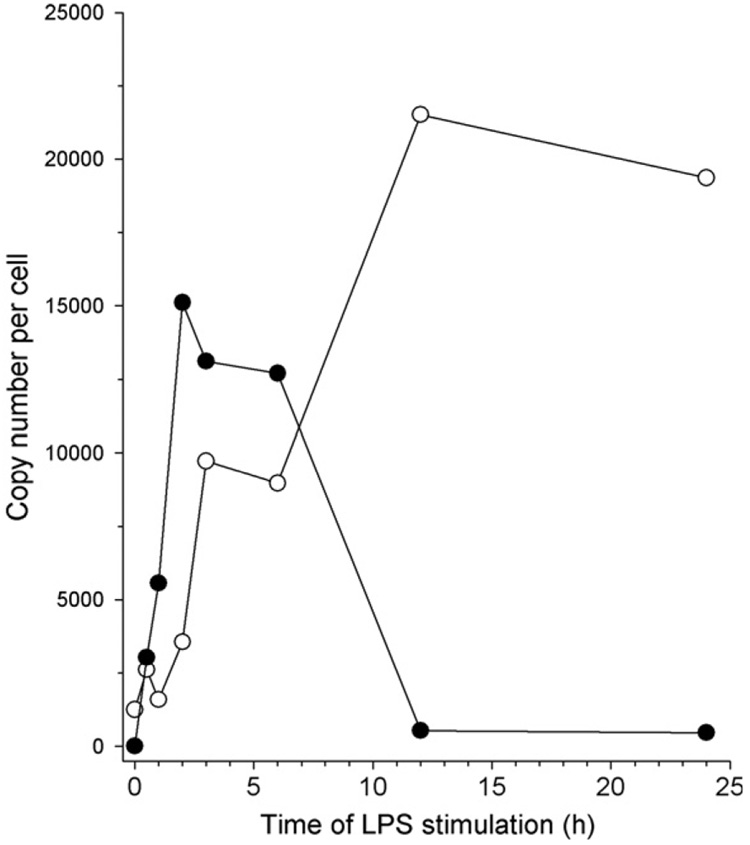
The expression of both the pre- and mature miRNA was determined using the methods described above. The raw CT data were converted to copy number per cell using the standard curves for both the pre- and mature miR-155 (Fig. 3). The expression of the pre-miR-155 peaked at 2 h following LPS exposure (Fig. 5). Expression of the mature miRNA lagged that of the pre-miRNA and peaked at the 12 h time point in the experiment (Fig. 5). Interestingly, as the levels of the pre-miR-155 decline beginning at about 3–6 h, the mature miRNA peaked. As demonstrated in numerous, published Northern blots, density of the mature miRNA is almost always greater than that of the pre-miRNA. This observation suggests that pre-miRNA turnover through processing and perhaps degradation occurs faster than the degradation of the mature miRNA. Using real-time PCR assays to quantify both the preand mature miRNA, we have demonstrated the kinetics of this stage of miRNA biogenesis in an inducible system (Fig. 5).
Fig. 5. Time course of miR-155 expression following stimulation with LPS.
Freshly isolated human monocytes were exposed to 1 mg/ml of LPS over 24 h. Cells were sampled at various time points during the exposure to LPS and the amount of pre-miR-155 (●) or mature miR-155 (○) was determined using the real-time PCR assays described in the text.
5. High throughput real-time PCR quantification of precursor and mature miRNA
miRNA profiling has become the standard discovery tool to identify miRNAs implicated in diseases or other cellular processes [12,19,27,28]. cDNA microarrays are an increasingly popular technology to profile miRNAs [12,29,36]. A clear advantage of cDNA arrays include unparalleled throughput. Disadvantages include, batch-to-batch variability in chip manufacturing and reduced sensitivity and specificity. Since the current number of miRNA genes is relatively small (533 human and 442 mouse miRNAs) [25] it is practical to profile miRNA expression using real-time PCR in 384-well reaction plates. Gene expression profiling using real-time PCR has the advantage of increased sensitivity, which translates into smaller sample size. A disadvantage of real-time PCR profiling of gene expression include difficulties in transferring small volumes of liquid into 384-well plates. Profiling of both precursor [17–19] and mature miRNA [30–33] have been successfully used in this format. In fact, real-time PCR was used to profile 220 human miRNAs from a single embryonic stem cell [34]. Pipetting may be achieved using liquid handling robots or multichannel pipettes. Protocols for both methods are discussed here.
5.1. Robotics protocol
A robotics protocol for TaqMan™ miRNA assays was established to increase the throughput. Beckman Coulter BioMek Fx with a 96-channel head was used to dilute the RT primers and TaqMan™ assays, stamp out oligos for reaction plates, and set up the PCR. Perkin-Elmer Multiprobe II HT was used to dispense RT/Sample mix for RT reactions.
For RT reaction set up, stamp out 7.5 µl of 2× RT primers into 96-well plates. Prepare a large mixture of 2× RT/Sample mix (which contains 2× RT buffer, 0.5 mM dNTPs, 6.7 U/µl Reverse Transcriptase, 0.5 U/µl RNAse Inhibitor, and 2 ng/µl total RNA sample). Aliquot 1 ml RT/Sample mix into a 1.5 ml microcentrifuge tube. Allow the robot to distribute 7.5 µl RT/Sample mix into the plate containing 7.5 µl 2× RT primers. Cover the plate with a removable seal. Invert plate to mix the reactions. After a brief spin, incubate the plate on ice for 5 min. Perform RT reaction in an Applied Biosystem’s 9700 instrument with the following condition: 16 °C for 30 min, 42 °C for 30 min, 85 °C for 5 min, and 4 °C on hold.
For PCR set up, stamp out 10 µl 5× TaqMan™ assays into 96-well plates. Using the Biomek FX, add 11 µl water, 25 µl 2× TM Universal Master Mix, and 4 µl RT product. Mix on the robot by pipetting up and down. Transfer PCR from 96-well plate to four new wells in 384-well plate. Cover the 384-well plate with Applied Biosystems clear optical seal. Spin plate briefly. Perform PCR in Applied Biosystems 7900 instrument as described previously.
5.2. Manual Pipetting
If liquid handling robots are not available to the user, it is possible to prepare miRNA in 384-well reaction plates using manually-operated multichannel repeating pipets. The following protocol is for assaying 192 precursor miRNAs in duplicate per 384-well plate. Alternatively, ~380 different miRNAs (plus internal control genes) may be profiled per 384-well plate. A master mix containing everything for the PCR except the primers is prepared. Prepare enough master mix for 5 µl reactions (384-well plus 10% extra). The master mix contains 2.5 µl of the 2× SYBR green master mix and 0.5 µl of diluted cDNA (dilute cDNA 1:50 in molecular biology grade water). Add 105 µl of the master mix to each well of a 12-well strip tube. Using a 12-well repeating multichannel pipette (Rainin Model E 12–20) transfer 3 µl of the master mix from the strip tube to each well of the 384-well plate. In separate 12-well strip tubes or 96-well plates have the primer pairs diluted to 2 µM. Using a 12-well repeating multichannel pipette (Rainin Model E 12–20) add 2 µl of the 2 µM primers to each well of the 384-well plate. Add the optical adhesive cover and seal. Perform a quick spin (up to 1500 RPM) on a centrifuge equipped with a 96-well plate adapter. Perform PCR using the real-time instrument per the manufacturers’ protocol. Typically 40 cycles of 15 s 95 °C and 1 min 60 °C. It is advisable to have a template of the plate’s configuration programmed on the instrument’s computer to assist in the data analysis.
5.3. Example: TPA induced differentiation of HL-60 cells
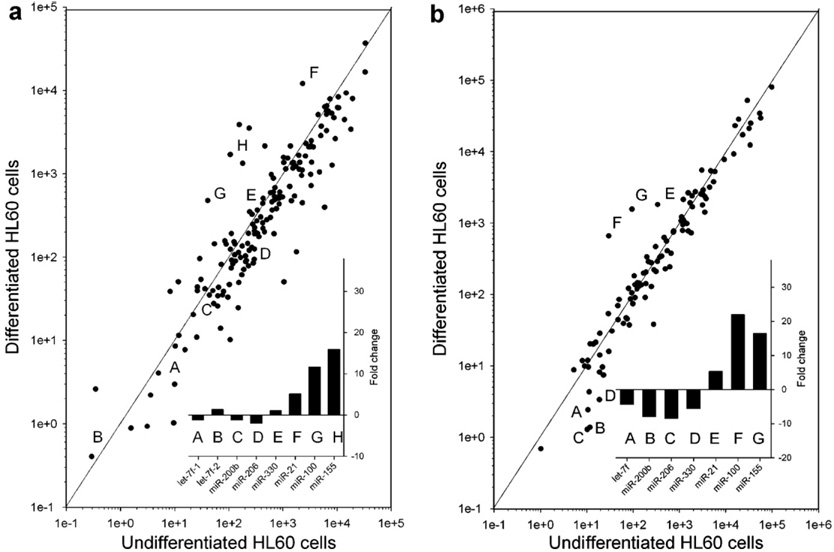
To apply real-time PCR profiling of miRNA and to determine if we can identify miRNAs that are regulated by processing, we performed an experiment similar to that preformed by Kasashima et al. [35]. This is to use 12-O-tet-radecanoylphorbol-13-acetate (TPA) to induce the differentiation of the promyelocytic HL60 cells to monocyte/ macrophage-like cells. HL60 cells were exposed to 16 nM TPA for 72 h. Differentiation was verified by cell morphology (not shown); undifferentiated HL60 cells grow in suspension while the differentiated cells become adherent. Total RNA was isolated from the undifferentiated HL60 cells and from the adherent, differentiated cells. Both the precursor and mature miRNA was quantified by the real-time PCR assays using the manual pipetting protocol described above. The expression of several miRNAs (e.g. miR-21, miR-100, and miR-155) was dramatically increased by as much as 15-fold during differentiation (Fig. 6). The expression of both the precursor and mature miRNA was increased, suggesting that the change in expression of these miRNA during differentiation was regulated at the level of transcription. Interestingly, other miRNAs were unchanged at the level of precursor, however the level of mature miRNA was reduced by 4- to 8-fold during differentiation. These include let-7f, miR-200b, miR-206, and miR-330 (Fig. 6). These data demonstrate that some miRNAs are regulated at the level of processing, nuclear transport or perhaps through enhanced degradation during differentiation. This example also demonstrates the power of simultaneously assaying both precursor and mature miRNA to elucidate mechanism of miRNA biogenesis.
Fig. 6. Expression profiling of precursor and mature miRNA following TPA-induced differentiation of HL60 cells.
Undifferentiated promyelocytic HL60 cells were differentiated to myelocytic cells following exposure to 16 nM of TPA for 72 h. Total RNA was isolated from the cells and the precursor (a) and mature (b) miRNA was assayed by the real-time PCR assays described in the text. Examples of individual miRNAs are indicated with a letter. The fold change in the expression of these miRNAs during differentiation is shown (inset).
6. Summary
Quantification of miRNA by real-time PCR is a powerful tool to be included in the toolbox of techniques to study miRNA. Real-time PCR may be used to validate the expression of miRNAs discovered during high throughput arrays, as a discovery tool when configured as a low density PCR array, to study the expression of individual miRNAs and as demonstrated here, to identify miRNAs whose expression may be regulated at the level of miRNA processing.
References
- 1.Kim VN, Nam JW. Trends Genet. 2006;22:165–173. doi: 10.1016/j.tig.2006.01.003. [DOI] [PubMed] [Google Scholar]
- 2.Lee Y, Kim M, Han J, Yeom KH, Lee S, Baek SH, Kim VN. EMBO J. 2004;23:4051–4060. doi: 10.1038/sj.emboj.7600385. [DOI] [PMC free article] [PubMed] [Google Scholar]
- 3.Lee Y, Ahn C, Han J, Choi H, Kim J, Yim J, Lee J, Provost P, Radmark O, Kim S, Kim VN. Nature. 2003;425:415–419. doi: 10.1038/nature01957. [DOI] [PubMed] [Google Scholar]
- 4.Yi R, Qin Y, Macara IG, Cullen BR. Genes Dev. 2003;17:3011–3016. doi: 10.1101/gad.1158803. [DOI] [PMC free article] [PubMed] [Google Scholar]
- 5.Lund E, Guttinger S, Calado A, Dahlberg JE, Kutay U. Science. 2004;303:95–98. doi: 10.1126/science.1090599. [DOI] [PubMed] [Google Scholar]
- 6.Wightman B, Ha I, Ruvkun G. Cell. 1993;75:855–862. doi: 10.1016/0092-8674(93)90530-4. [DOI] [PubMed] [Google Scholar]
- 7.Lee RC, Feinbaum RL, Ambros V. Cell. 1993;75:843–854. doi: 10.1016/0092-8674(93)90529-y. [DOI] [PubMed] [Google Scholar]
- 8.Lagos-Quintana M, Rauhut R, Lendeckel W, Tuschl T. Science. 2001;294:853–858. doi: 10.1126/science.1064921. [DOI] [PubMed] [Google Scholar]
- 9.Lau NC, Lim LP, Weinstein EG, Bartel DP. Science. 2001;294:858–862. doi: 10.1126/science.1065062. [DOI] [PubMed] [Google Scholar]
- 10.Lee RC, Ambros V. Science. 2001;294:862–864. doi: 10.1126/science.1065329. [DOI] [PubMed] [Google Scholar]
- 11.Krichevsky AM, King KS, Donahue CP, Khrapko K, Kosik KS. RNA. 2003;9:1274–1281. doi: 10.1261/rna.5980303. [DOI] [PMC free article] [PubMed] [Google Scholar]
- 12.Liu CG, Calin GA, Meloon B, Gamliel N, Sevignani C, Ferracin M, Dumitru CD, Shimizu M, Zupo S, Dono M, Alder H, Bullrich F, Negrini M, Croce CM. Proc. Natl. Acad. Sci. USA. 2004;101:9740–9744. doi: 10.1073/pnas.0403293101. [DOI] [PMC free article] [PubMed] [Google Scholar]
- 13.Schmittgen TD, Jiang J, Liu Q, Yang L. Nucleic Acids Res. 2004;32:E43. doi: 10.1093/nar/gnh040. [DOI] [PMC free article] [PubMed] [Google Scholar]
- 14.Chen C, Ridzon DA, Broomer AJ, Zhou Z, Lee DH, Nguyen JT, Barbisin M, Xu NL, Mahuvakar VR, Andersen MR, Lao KQ, Livak KJ, Guegler KJ. Nucleic Acids Res. 2005;33:e179. doi: 10.1093/nar/gni178. [DOI] [PMC free article] [PubMed] [Google Scholar]
- 15.Shi R, Chiang VL. Biotechniques. 2005;39:519–525. doi: 10.2144/000112010. [DOI] [PubMed] [Google Scholar]
- 16.Raymond CK, Roberts BS, Garrett-Engele P, Lim LP, Johnson JM. RNA. 2005;11:1737–1744. doi: 10.1261/rna.2148705. [DOI] [PMC free article] [PubMed] [Google Scholar]
- 17.Jiang J, Lee EJ, Gusev Y, Schmittgen TD. Nucleic Acids Res. 2005;33:5394–5403. doi: 10.1093/nar/gki863. [DOI] [PMC free article] [PubMed] [Google Scholar]
- 18.Jiang J, Lee EJ, Schmittgen TD. Genes Chromosomes Cancer. 2006;45:103–106. doi: 10.1002/gcc.20264. [DOI] [PubMed] [Google Scholar]
- 19.Lee EJ, Gusev Y, Jiang J, Nuovo GJ, Lerner MR, Frankel WL, Morgan DL, Postier RG, Brackett DJ, Schmittgen TD. Int. J. Cancer. 2007;120:1046–1054. doi: 10.1002/ijc.22394. [DOI] [PMC free article] [PubMed] [Google Scholar]
- 20.Meng F, Henson R, Lang M, Wehbe H, Maheshwari S, Mendell JT, Jiang J, Schmittgen TD, Patel T. Gastroenterology. 2006;130:2113–2129. doi: 10.1053/j.gastro.2006.02.057. [DOI] [PubMed] [Google Scholar]
- 21.Yanaihara N, Caplen N, Bowman E, Seike M, Kumamoto K, Yi M, Stephens RM, Okamoto A, Yokota J, Tanaka T, Calin GA, Liu CG, Croce CM, Harris CC. Cancer Cell. 2006;9:189–198. doi: 10.1016/j.ccr.2006.01.025. [DOI] [PubMed] [Google Scholar]
- 22.Ambros V, Lee RC, Lavanway A, Williams PT, Jewell D. Curr. Biol. 2003;13:807–818. doi: 10.1016/s0960-9822(03)00287-2. [DOI] [PubMed] [Google Scholar]
- 23.Michael MZ, SM OC, van Holst Pellekaan NG, Young GP, James RJ. Mol. Cancer Res. 2003;1:882–891. [PubMed] [Google Scholar]
- 24.Wulczyn FG, Smirnova L, Rybak A, Brandt C, Kwidzinski E, Ninnemann O, Strehle M, Seiler A, Schumacher S, Nitsch R. FASEB J. 2007;21:415–426. doi: 10.1096/fj.06-6130com. [DOI] [PubMed] [Google Scholar]
- 25.Griffiths-Jones S. Nucleic Acids Res. 2004;32:D109–D111. doi: 10.1093/nar/gkh023. [DOI] [PMC free article] [PubMed] [Google Scholar]
- 26.Livak KJ, Schmittgen TD. Methods. 2001;25:402–408. doi: 10.1006/meth.2001.1262. [DOI] [PubMed] [Google Scholar]
- 27.Volinia S, Calin GA, Liu CG, Ambs S, Cimmino A, Petrocca F, Visone R, Iorio M, Roldo C, Ferracin M, Prueitt RL, Yanaihara N, Lanza G, Scarpa A, Vecchione A, Negrini M, Harris CC, Croce CM. Proc. Natl. Acad. Sci. USA. 2006;103:2257–2261. doi: 10.1073/pnas.0510565103. [DOI] [PMC free article] [PubMed] [Google Scholar]
- 28.Lu J, Getz G, Miska EA, Alvarez-Saavedra E, Lamb J, Peck D, Sweet-Cordero A, Ebert BL, Mak RH, Ferrando AA, Downing JR, Jacks T, Horvitz HR, Golub TR. Nature. 2005;435:834–838. doi: 10.1038/nature03702. [DOI] [PubMed] [Google Scholar]
- 29.Wang H, Ach RA, Curry B. RNA. 2007;13:151–159. doi: 10.1261/rna.234507. [DOI] [PMC free article] [PubMed] [Google Scholar]
- 30.Bandres E, Cubedo E, Agirre X, Malumbres R, Zarate R, Ramirez N, Abajo A, Navarro A, Moreno I, Monzo M, Garcia-Foncillas J. Mol. Cancer. 2006;5:29. doi: 10.1186/1476-4598-5-29. [DOI] [PMC free article] [PubMed] [Google Scholar]
- 31.Lao K, Xu NL, Sun YA, Livak KJ, Straus NA. J. Biotechnol. 2007;2:33–35. doi: 10.1002/biot.200600119. [DOI] [PubMed] [Google Scholar]
- 32.Lao K, Xu NL, Yeung V, Chen C, Livak KJ, Straus NA. Biochem. Biophys. Res. Commun. 2006;343:85–89. doi: 10.1016/j.bbrc.2006.02.106. [DOI] [PubMed] [Google Scholar]
- 33.Gaur A, Jewell DA, Liang Y, Ridzon D, Moore JH, Chen C, Ambros VR, Israel MA. Cancer Res. 2007;67:2456–2468. doi: 10.1158/0008-5472.CAN-06-2698. [DOI] [PubMed] [Google Scholar]
- 34.Tang F, Hajkova P, Barton SC, Lao K, Surani MA. Nucleic Acids Res. 2006;34:e9. doi: 10.1093/nar/gnj009. [DOI] [PMC free article] [PubMed] [Google Scholar]
- 35.Kasashima K, Nakamura Y, Kozu T. Biochem. Biophys. Res. Commun. 2004;322:403–410. doi: 10.1016/j.bbrc.2004.07.130. [DOI] [PubMed] [Google Scholar]
- 36.Liu C-G, Spizzo R, Calin GA, Croce CM. Methods. 2008;44:22–30. doi: 10.1016/j.ymeth.2007.10.010. [DOI] [PMC free article] [PubMed] [Google Scholar]


