

Abstract
Because we can perceive the pitch, timbre, and spatial location of a sound source independently, it seems natural to suppose that cortical processing of sounds might separate out spatial from nonspatial attributes. Indeed, recent studies support the existence of anatomically segregated “what” and “where” cortical processing streams. However, few attempts have been made to measure the responses of individual neurons in different cortical fields to sounds that vary simultaneously across spatial and nonspatial dimensions. We recorded responses to artificial vowels presented in virtual acoustic space to investigate the representations of pitch, timbre, and sound source azimuth in both core and belt areas of ferret auditory cortex. A variance decomposition technique was used to quantify the way in which altering each parameter changed neural responses. Most units were sensitive to two or more of these stimulus attributes. Although indicating that neural encoding of pitch, location, and timbre cues is distributed across auditory cortex, significant differences in average neuronal sensitivity were observed across cortical areas and depths, which could form the basis for the segregation of spatial and nonspatial cues at higher cortical levels. Some units exhibited significant nonlinear interactions between particular combinations of pitch, timbre, and azimuth. These interactions were most pronounced for pitch and timbre and were less commonly observed between spatial and nonspatial attributes. Such nonlinearities were most prevalent in primary auditory cortex, although they tended to be small compared with stimulus main effects.
Keywords: auditory cortex, tuning, sound, spike trains, vocalization, localization, parallel, hearing
Introduction
One of the most important functions of the auditory system is to identify and discriminate vocal calls, such as speech sounds. This task requires the listener to process several complex perceptual properties of a single auditory object, and so is likely to engage a number of functionally distinct cortical areas in parallel. To identify a spoken vowel, for example, the auditory system must determine the positions of formant peaks in the spectral envelope of the vowel sound (Peterson and Barney, 1952). Vowel discrimination is therefore a timbre discrimination task. Meanwhile, in addition to its timbre, the pitch of a spoken vowel can convey information about the speaker's identity (Gelfer and Mikos, 2005) and emotional state (Fuller and Lloyd, 1992; Reissland et al., 2003), and so the periodicity of the vowel must also be analyzed. Finally, localization of the speaker requires processing binaural disparity cues and monaural spectral cues that are independent of the timbre and pitch of the vowel. Because many other species generate vocalizations in an entirely analogous manner, processing the pitch, timbre, and location of vowel-like sounds is an important task for the mammalian auditory system in general.
Building on earlier studies in the visual system (Mishkin and Ungerleider, 1982; Goodale and Milner, 1992), it is widely thought that a separation of function exists within higher-order auditory processing streams, such that more posterior, or dorsal, cortical areas mediate sound localization, whereas more anterior, or ventral, areas are responsible for object identification (Rauschecker et al., 1997; Romanski et al., 1999; Kaas and Hackett, 2000; Alain et al., 2001; Maeder et al., 2001; Tian et al., 2001; Warren and Griffiths, 2003; Barrett and Hall, 2006; Lomber and Malhotra, 2008). Consequently, we might expect the pitch and the timbre of a complex auditory stimulus to be represented in a separate region from its spatial location. However, it is not uncommon for listeners to find themselves in cluttered acoustic environments, where the pitch, timbre, and spatial location of several sound sources may have to be tracked simultaneously. Separating the neural processing of different perceptual attributes could make this task harder, by creating a sort of “binding problem.”
Previous work has focused almost exclusively on differences across cortical areas in the representation of just one parameter, such as sound-source location (Recanzone, 2000; Stecker et al., 2005; Harrington et al., 2008) or pitch (Bendor and Wang, 2005). The extent to which these attributes are encoded independently has not previously been investigated. Here we used “artificial vowel” sounds to investigate how pitch (as determined by the pulse rate), timbre (as determined by formant filter frequencies), and location are encoded within and across five identified areas of the auditory cortex of the ferret. Our aim was to determine the degree to which these perceptual attributes are represented in a mutually independent manner in both primary and secondary cortical fields, and to look for evidence for feature specialization across these fields.
Materials and Methods
Animal preparation.
All animal procedures were approved by the local ethical review committee and performed under license from the UK Home Office in accordance with the Animal (Scientific Procedures) Act 1986. Five adult, female, pigmented ferrets (Mustela putorius) were used in this study. All animals received regular otoscopic examinations before the experiment, to ensure that both ears were clean and disease free.
Anesthesia was induced by a single dose of a mixture of medetomidine (Domitor; 0.022 mg/kg/h; Pfizer) and ketamine (Ketaset; 5 mg/kg/h; Fort Dodge Animal Health). The left radial vein was cannulated and a continuous infusion (5 ml/h) of a mixture of medetomidine and ketamine in physiological saline containing 5% glucose was provided throughout the experiment. The ferrets also received a single, subcutaneous, dose of 0.06 mg/kg/h atropine sulfate (C-Vet Veterinary Products) and, every 12 h, subcutaneous doses of 0.5 mg/kg dexamethasone (Dexadreson; Intervet UK) to reduce bronchial secretions and cerebral edema, respectively. The ferret was intubated, placed on a ventilator (7025 respirator; Ugo Basile) and supplemented with oxygen. Body temperature, end-tidal CO2, and the electrocardiogram (ECG) were monitored throughout the experiment. Experiments typically lasted between 36 and 60 h.
The animal was placed in a stereotaxic frame and the temporal muscles on both sides were retracted to expose the dorsal and lateral parts of the skull. A metal bar was cemented and screwed into the right side of the skull, holding the head without further need of a stereotaxic frame. On the left side, the temporal muscle was largely removed, and the suprasylvian and pseudosylvian sulci were exposed by a craniotomy, exposing auditory cortex (Fig. 1) (Kelly et al., 1986). The dura was removed and the cortex covered with silicon oil. The animal was then transferred to a small table in an anechoic chamber (IAC).
Figure 1.

Stimuli and example responses. A, Frequency spectra for 16 of the artificial vowel stimuli used in this experiment. The four timbres used (corresponding to the vowels /a/, /ε/, /u/, and /i/) are shown in different columns, with the four pitches (F0 of 200, 336, 565, and 951 Hz) shown in different rows. Each of these stimuli was also presented at one of four different virtual sound directions (−45°, −15°, 15°, and 45° azimuth). B, C, Spike raster plots from two different cortical neurons in response to all 64 stimulus combinations. In each case, the same data are replotted three times, organized either according to stimulus azimuth (Az), pitch (F0), or timbre (vowel, vID). Both of these units produced responses that were clearly dependent on at least two of the three stimulus dimensions.
Stimuli.
Sounds were generated using TDT system 3 hardware (Tucker-Davis Technologies) and MATLAB (MathWorks), and presented through customized Panasonic RPHV297 headphone drivers. Closed-field calibrations were performed using a one-eighth inch condenser microphone (Brüel and Kjær), placed at the end of a model ferret ear canal, to create an inverse filter that ensured the driver produced a flat (<±5 dB) output.
Pure tone stimuli were used to obtain frequency response areas (FRAs), both to characterize individual units and to determine tonotopic gradients, so as to confirm the cortical field in which any given recording was made. The tones used ranged, in 1/3-octave steps, from 200 Hz to 24 kHz, and were 100 ms in duration (5 ms cosine ramped). Intensities ranged from 10 to 80 dB SPL in 10 dB increments. Each frequency-level combination was presented pseudorandomly at least 3 times, at a rate of one per second. Artificial vowel stimuli were created in MATLAB, using an algorithm adapted from Malcolm Slaney's Auditory Toolbox (http://cobweb.ecn.purdue.edu/∼malcolm/interval/1998-010/). Click trains with a duration of 150 ms and a repetition rate corresponding to the desired fundamental frequency were passed through a cascade of four bandpass filters to impart spectral peaks at the desired formant frequencies. The vowel sounds were normalized to have equal root-mean-square amplitudes, and calibrations were performed using a one-eighth inch condenser microphone (Brüel and Kjær) to ensure that changes in pitch or timbre did not influence the overall sound pressure level. Virtual acoustic space (VAS) techniques were then used to add sound-source direction cues to the artificial vowel sounds. A series of measurements including head size, sex, body weight, and pinna size, were taken from each ferret to select the best match from our extensive library of ferret head-related transfer function recordings. We have shown previously that ferret spectral localization cue values scale with the size of the head and external ears (Schnupp et al., 2003). Sound-source direction cues were generated by convolving the artificial vowel sounds with minimum phase filters that imparted the appropriate interaural level differences and spectral cues corresponding to a particular direction in the horizontal plane, and which at the same time equalized out any differences in the headphone transfer functions that had been revealed during headphone calibration. Small delays were then introduced in the sound waveforms to generate appropriate interaural time differences.
We presented sounds from four virtual sound-source directions (−45°, −15°, 15°, and 45° azimuth, at 0° elevation) and used four sound pitches with F0 equal to 200, 336, 565, and 951 Hz. Four timbres were chosen: /a/with formant frequencies F1–F4 at 936, 1551, 2815, and 4290 Hz; /ε/ with formant frequencies at 730, 2058, 2979, and 4294 Hz; /u/ with formant frequencies at 460, 1105, 2735, and 4115 Hz; and /i/ with formant frequencies at 437, 2761, 3372, and 4352 Hz. The permutation of these 4 pitches by 4 timbres by 4 source directions gave us a stimulus set of 64 sounds.
Data acquisition.
Recordings were made with silicon probe electrodes (Neuronexus Technologies). In two animals, we used electrodes with an 8 × 4 configuration (8 active sites on 4 parallel probes, with a vertical spacing of 150 μm). In a small number of recordings in one of these animals, and in another animal, we used electrodes with a 16 × 2 configuration (16 active sites spaced at 100 μm intervals on each of two probes). In the final two animals, electrodes with 4 × 4 and 16 × 1 configurations were used (100–150 μm spacing of active sites on each probe). The electrodes were positioned so that they entered the cortex approximately orthogonal to the surface of the ectosylvian gyrus. A photographic record was made of each electrode penetration to allow later reconstruction of the location of each recording site relative to anatomical landmarks (surface blood vessels, sulcal patterns), to allow us to construct functional maps of the auditory cortex.
The neuronal recordings were bandpass filtered (500 Hz to 5 kHz), amplified (up to 20,000 times), and digitized at 25 kHz. Data acquisition and stimulus generation were performed using BrainWare (Tucker-Davis Technologies).
Data analysis.
Spike sorting was performed off-line. Single units were isolated from the digitized signal either by manually clustering data according to spike features such as amplitude, width, and area, or by using an automated k-means clustering algorithm, in which the voltage potential at 7 points across the duration of the spike window served as variables. We also inspected auto-correlation histograms, and only cases in which the interspike-interval histograms revealed a clear refractory period were classed as single units.
Composite map generation.
Analysis of responses to vowel stimuli was performed blind to animal number or the position of the electrode penetration relative to anatomical landmarks. Before examining how the responses to vowel stimuli varied as a result of their cortical location, each penetration was first assigned to a cortical field on the basis of the responses of units to simple stimuli. This was done by measuring pure-tone FRAs at all recording sites, and comparing these to previously documented physiological criteria for each of the fields that have been characterized in ferret auditory cortex (Bizley et al., 2005). Penetrations were assigned to a given cortical field according to the characteristic frequency (CF) and tuning properties derived from the FRA and the latency and duration of the response, together with photographs recording the location of the electrode penetrations on the cortical surface and the overall frequency organization obtained for each animal.
Having established the recording locations within each individual animal and noted that there were consistent trends in the responses to vowel sounds between cortical fields across animals, we established a “composite” auditory cortex map. Field boundaries were determined on the basis of the responses to pure tones and noise bursts, but blind to the responses to vowel sounds. This approach has previously been used to investigate the representation of multisensory responses in ferret auditory cortex (Bizley and King, 2008). To create the composite map, the penetration locations and cortical field boundaries for each individual animal were projected onto a single animal frequency map derived using optical imaging of intrinsic signals. This map was a representative example taken from Nelken et al. (2004). This procedure was performed separately for each animal. Morphing each animal's cortical map onto a single example in this way allowed the data from each animal to be superimposed in a bias-free manner.
Results
Responses to stimulus pitch, timbre, and location
We used a set of 64 artificial vowel sounds, comprising all possible combinations of four spatial locations, four pitches, and four timbres. The parameter values were chosen to be quite widely spaced along each of the three dimensions. VAS stimuli were presented at −45°, −15°, 15°, and 45° azimuth at 0° elevation, with negative azimuths denoting locations to the animal's right, contralateral to the recording sites. Fundamental frequencies of 200, 336, 565, and 951 Hz were used, and the four timbres corresponded to the vowels: /a/, /ε/, /u/, and /i/. These parameter ranges were chosen to make the stimuli easily discriminable along each perceptual dimension, both for human listeners, and, as far as we know from available psychoacoustical data, also for our animal model species, the ferret. The azimuth spacing of 30° corresponds approximately to two to three ferret behavioral just noticeable difference (JND) limens (Parsons et al., 1999). The perceptual distance of the pitch steps used here (0.75 octaves) is similarly approximately twice as wide as the ferrets' JNDs (Walker et al., 2009). The ferrets' ability to discriminate the spectral envelopes associated with the four different vowels has not yet been formally investigated, but preliminary experiments have demonstrated that ferrets rapidly learn to discriminate the identity of these vowel sounds and do so across at least a two octave range of pitches (J. K. Bizley, K. M Walker, A. J. King, and J. W. H. Schnupp, unpublished observations).
Each artificial vowel stimulus was 150 ms long. Figure 1 A shows the frequency spectra for the 16 possible combinations of pitch and timbre. This illustrates that both timbre and pitch changes affect the spectral envelope of the sounds, and presenting these sounds from different virtual directions can introduce further changes in the spectral envelope. Yet although changes in location, pitch, and timbre all affect the sound spectrum, the perceptual consequences of these changes are quite distinct. If the perceptual distinction between pitch, timbre, and location is reflected at the level of neuronal discharges in auditory cortex, then this stimulus set ought to reveal this separation according to perceptual categories.
Extracellular recordings were performed using multisite silicon electrodes in anesthetized ferrets. We sampled >900 acoustically sensitive recording sites. At 615 of these, we were able to obtain stable recordings of neural responses to 30–40 presentations of each of the 64 artificial vowel stimuli, which were presented in a randomly interleaved order. Three hundred twenty-four recordings were from single units and 292 were small clusters of units. Because we were unable to find any systematic difference in the response properties of single units and small unit clusters, the term “unit” will be used to refer to both groups.
We observed a rich variety of response types across units, and responses were frequently clearly modulated by more than one, and often all three, stimulus dimensions. Figure 1, B and C, shows the responses from two different units. In each case, the three panels show the same data plotted three times, with the 64 stimuli ordered into groups of 16 with a common azimuth, pitch, or timbre (first, second, and third panels, respectively). These examples illustrate a common finding: tuning to stimulus pitch, timbre, or azimuth alone did not adequately describe the responses of these units and their responses could not be captured satisfactorily as a single spike count value. Rather, neurons often showed a degree of sensitivity to each parameter (e.g., Fig. 1 B), and/or to particular combinations of parameters (Fig. 1 C) in a time-dependent manner. Further examples are illustrated in supplemental Figure 1, available at www.jneurosci.org as supplemental material.
To examine these stimulus effects, we constructed post stimulus time histogram (PSTH) matrices, in which data were sorted according to two of the three stimulus parameters and pooled across the third. Figure 2, A and C, show such PSTH matrices for the unit illustrated in Figure 1 B. The 16 panels to the top left of Figure 2 A show the data arranged according to all 16 timbre × pitch combinations. The first four columns show the PSTH for the responses to timbres corresponding to /i/, /u/, /ε/, and /a/, whereas the top four rows show the data for pitches at 200, 336, 565, and 951 Hz, respectively. The rightmost column in Figure 2 A shows the mean response for each pitch, averaged across all timbres and azimuths, whereas the bottom row shows the mean response for each timbre, and the bottom right PSTH illustrates the grand average response across all stimuli.
Figure 2.

Main effects and interactions of pitch, timbre, and azimuth. A–D, PSTH matrices illustrating the main effects and 2-way interactions of timbre, pitch, and azimuth on the responses of two cortical neurons. Data are sorted according to two of the three stimulus dimensions, as indicated on the left and top margins of each panel, and averaged across the third. Each PSTH shows the mean firing rate post stimulus onset in Hz. The effects of stimulus pitch and timbre (vowel identity) are plotted in A and B and the effects of stimulus azimuth and pitch are shown in C and D. A, C, Data from the neuron whose responses are shown in Figure 1 B. B, D, Data from the neuron shown in Figure 1 C. The first four rows and columns of each PSTH matrix represent the responses to combinations of the two stimulus parameters indicated. The cells at the end of each row and column show the average response to the stimulus parameter indicated by the corresponding row and column headers. For example, the cell at the end of the first row in A and B shows the mean response to a pitch of 200 Hz, regardless of timbre or location. The bottom right-hand PSTH in each matrix shows the overall grand average PSTH, constructed across all 64 stimulus conditions. The color scale underlay in each PSTH highlights the difference between it and the grand average PSTH, with blue indicating a decrease in firing relative to the average and red showing an increase. The color scales for the first four rows and columns in each of the four panels saturate at ±33 spikes/s in A, ±32 in B, ±11 in C, and ±8 in D. The color scales in the panels in the last row and bottom column saturate at ±60 spikes/s in A and C, and ±32 in B and D.
Displaying the data in this manner makes it easier to appreciate the effect of varying either stimulus pitch or timbre. To describe these effects, we shall adopt the terminology used in ANOVA-type linear statistical models, with mean spike rate during some small time interval as our “response variable,” whereas pitch, timbre, location, and poststimulus time serve as “explanatory variables.” We treat these as categorical variates, as we cannot assume the relationship between stimulus parameter value and spike rate to be linear or even monotonic. Within that conceptual framework, comparing the top four panels of the rightmost column with the bottom right panel therefore reveals the “main effect” of varying pitch on the discharge pattern on this unit. To make it easier to visualize the main effects of each stimulus parameter, we plot the individual PSTHs in the rightmost column and bottom row on top of a color scale that shows how each particular PSTH differs from the grand average at each time bin. Red means the neural firing rate is, at that time point, larger than average, blue indicates that it is below average, and the saturation of the color encodes the size of the difference.
The grand average PSTH in the bottom right panel in Figure 2 A shows that the unit responded to artificial vowel sounds with an initial increase in firing rate, which peaked at a rate of ∼50 Hz at ∼50 ms post stimulus onset, followed by a smaller second peak at ∼180 ms. The main effect of presenting a relatively low pitch (200 Hz, top panel of the last column) was to decrease the size of the first peak in the PSTH and to increase that of the second. Conversely, the main effect of high pitches (951 Hz, fourth panel in the last column) was to increase the size of the first response peak and to decrease the second. Similarly, the main effect of varying timbre can be appreciated by comparing the panels in the bottom row of the PSTH matrix in Figure 2 A. A timbre corresponding to the vowel /u/ strongly enhanced the initial response peak (bottom row, second panel), whereas the timbre for /i/ suppressed it (bottom row, first panel), but timbre changes did not affect the later part of the response. This unit was therefore sensitive to both pitch and timbre, and the effects of changing pitch or timbre were manifest at different latencies after stimulus onset.
In the conceptual framework of an ANOVA-style analysis, the simplest assumption for responses to a particular pitch/timbre combination would be that the main effects of pitch and timbre might be additive. To look for nonlinear interactions between the stimulus dimensions, we compare the PSTHs in the main body of the matrix against the values that would be predicted from the linear sum of the main effects, which are shown by the color scales in the rightmost column and bottom row of Figure 2 A–D. The color scales in the main body (first four rows and columns) of the PSTH matrix show these “two-way interactions.” Therefore any deviation from white shows that the response observed was nonlinear, with red colors indicating a supra-additive response, and blue colors indicating a subadditive one. For example, in the unit shown in Figure 2 A, the combination of /i/ and a 200 Hz F0 elicited a supralinear response, whereas the combination of /i/ and 951 Hz F0 resulted in a response that was smaller than the linear prediction. However, examination of the absolute values for the interactions and main effects shows that the size of the two-stimulus interactions were small relative to the “main effects” of any one stimulus parameter; the interaction coefficients did not exceed ± 33 spikes/s compared with ± 86 spikes/s for the largest main effect.
Figure 2 C shows the azimuth-by-pitch main effects and interactions for the same unit, whereas Figure 2, B and D, shows the pitch-by-timbre and pitch-by-azimuth main effects and interactions, respectively, for a second sample unit (the same as that illustrated in Fig. 1 C). Although this second sample unit exhibited rather different temporal discharge patterns, like the first, it was clearly influenced by more than one stimulus dimension. As we shall see further below, the data shown in Figure 2 were fairly typical of many of the units recorded throughout all cortical areas characterized. Thus, most units were sensitive to more than one stimulus dimension, their firing patterns could change at various times post-stimulus onset, and nonadditive interactions between stimuli were not uncommon.
To quantify the strength and significance of these main effects and interactions, we performed a 4-way ANOVA on the spike counts, averaged across the 30–40 repeat presentations for each of the 16 stimuli, in each 20 ms bin for the first 300 ms after stimulus onset. In this manner, each response was represented as a vector of 15 sequential spike counts. Our choice of 20 ms bin widths was based on previous studies of ferret auditory cortex, which indicate that this is likely to be a suitable temporal resolution for decoding neural responses (Schnupp et al., 2006; Walker et al., 2008). In this ANOVA, the 3 stimulus parameters (azimuth, pitch, and timbre) plus the time bin served as factors. To quantify the relative strength with which one of the three stimulus dimensions influenced the firing of a particular unit, we calculated the proportion of variance explained by each of azimuth, pitch, and timbre, Varstim, as:
 |
where “stim” refers to the stimulus parameter of interest (pitch, timbre, or azimuth), SSstim · bin is the sum of squares for the interaction of the stimulus parameter and time bin, SSerror is the sum of squares of the error term, dfstim · bin refers to the degrees of freedom for the stimulus × time bin interaction, SStotal is the total sum of squares, and SSbin is the sum of squares for the time bin factor. A significant SSbin reflects the fact that the response rate was not flat over the duration of the 300 ms response window. This is in itself unsurprising, but by examining the stimulus-by-time-bin interactions, we were able to test the statistical significance of the influence a given stimulus parameter had, not just on the overall spike rate, but also on the temporal discharge pattern of the response. Stimulus-by-time-bin interactions were common, and revealed how a particular stimulus parameter influenced the shape of the PSTH. Subtracting the SSerror · dfstim · bin from the SSstim · bin term allows us to calculate the proportion of response variance attributable to each of the stimuli, taking into account the additional variance explained simply by adding extra parameters to the model. For the responses shown in Figure 2, A and C, the percentage of variance explained by the stimulus main effects was 5% for azimuth, 17% for pitch and 56% for timbre, whereas for the unit shown in Figure 2, B and D, the main effects of azimuth, pitch, and timbre accounted for 3%, 19%, and 7%, respectively, of the variance in the neural discharge patterns. Thus, although both units were significantly influenced by all 3 stimulus dimensions, one might justifiably describe the first as being “predominantly” sensitive to timbre and the second to pitch. Only 23% of units were significantly (p < 0.001) modulated by azimuth, pitch, or timbre alone. In contrast, 36% of neural responses were dependent on two of the three stimulus dimensions and 29% of units were influenced by all three. The responses of the remaining 12% of units were not significantly modulated by any of the stimuli.
As mentioned above, we combined data from single units and from small multiunit clusters for most analyses. To verify that any joint sensitivity was not a result of recording from more than one neuron, we determined the proportion of units sensitive to combinations of two parameters for single units alone. Sensitivity to both pitch and timbre was observed in 56% of all recording sites and in 52% (169 of 324) of the single units. Thirty percent of all recordings and 33% of all single units were sensitive to both pitch and azimuth, whereas 34% of all recordings and 36% of single units were sensitive to timbre and azimuth. Thus, we were equally likely to observe combination sensitivity in both multiunits and well separated single units.
Spike count measures do not fully capture response complexity
To examine the importance of the temporal discharge pattern in the neural response, we also performed an ANOVA that was restricted to the overall spike counts calculated over the first 75 ms after stimulus onset. This ANOVA was performed again using pitch, azimuth, and timbre as independent variables, but this time excluded poststimulus time. It resulted in far fewer units exhibiting significant response modulation as a function of these stimulus attributes. For example, using a single spike count measure, only 11% of all units exhibited significant (p < 0.05) sensitivity to sound azimuth, although 36% of units had shown a significant (p < 0.001) time-bin × azimuth interaction. The same comparison for pitch and timbre yielded values of 18% compared with 66% for pitch, and 29% compared with 73% for timbre. Over this single time window of 75 ms, the discharge rates of 60% of units no longer exhibited any significant stimulus main effects, and only 13% of units were modulated by more than one parameter. Analyzed in this manner, the unit shown in Figure 2 A, for example, was found to be sensitive only to timbre, whereas that depicted in Figure 2 B was no longer sensitive to any of the three stimulus dimensions.
When we performed the analysis using a longer response window (300 ms, data not shown) there were even fewer neurons whose responses were significantly modulated by these stimuli, and neither unit shown in Figure 1 was found to be sensitive to pitch, azimuth, or timbre. Figure 2 A shows that, for one of these units, the early and the late part of the response varied in opposite ways with stimulus pitch. The resulting “cancellation” of stimulus effects is the likely to be the main reason why using an inappropriately wide analysis window failed to give a significant result despite clear stimulus dependence. These results clearly demonstrate that highly significant but transient stimulus effects can easily be missed in an analysis that is temporally too coarse-grained. We therefore adopted the response variance explained statistics described in Equation 1 as our preferred measure of neural stimulus sensitivity for the further analyses described below.
Cortical distribution of sensitivity to pitch, timbre, and azimuth
To examine the distribution of stimulus sensitivity across auditory cortex, recordings were made in 5 of the 7 previously identified acoustically responsive areas in the ferret ectosylvian gyrus: the primary and anterior auditory fields (A1 and AAF), the tonotopically organized posterior pseudosylvian and posterior suprasylvian fields (PPF and PSF), which are located on the posterior bank of the ectosylvian gyrus, and the nontonotopic anterior dorsal field (ADF) on the anterior bank (Fig. 3 A, Table 1) (Kowalski et al., 1995; Nelken et al., 2004; Bizley et al., 2005). These five areas make up the auditory “core” (A1 and AAF), and “belt” (PPF, PSF, ADF) areas in this species. We have previously reported that ∼60% of neurons in the anterior ventral field (AVF) are visually sensitive (Bizley et al., 2007). AVF and the ventroposterior (VP) area are likely to be “parabelt” areas and were not included in the present study. In four of five animals, recordings were made in all five cortical fields and, in the remaining animal, responses were recorded in three fields.
Figure 3.
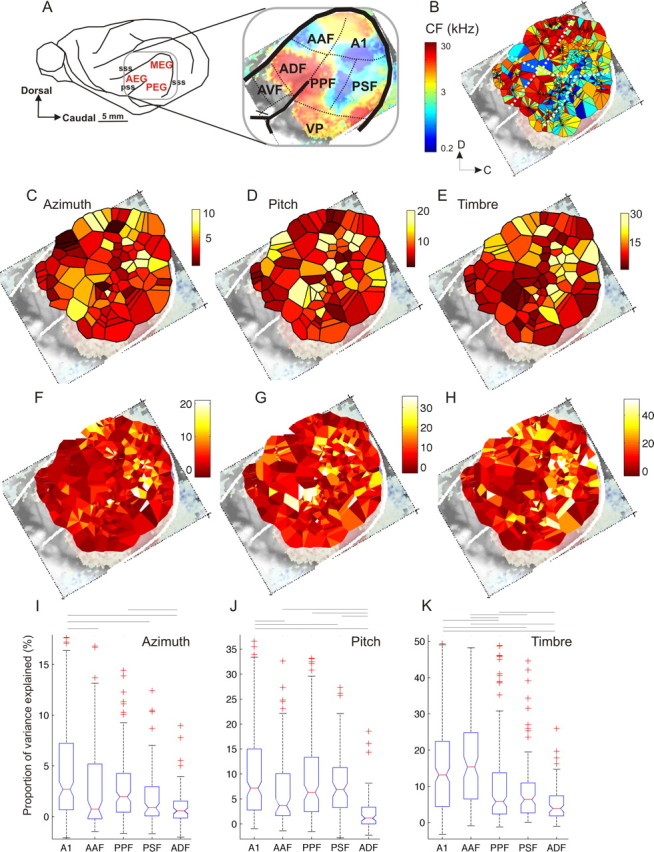
Distribution of relative sensitivity to location, pitch, and timbre across the auditory cortex. A, Location of ferret auditory cortex on the middle, anterior, and posterior ectosylvian gyri (MEG, AEG, and PEG, respectively). The inset shows the location of seven auditory cortical fields. The color scale shows the tonotopic organization as visualized using optical imaging of intrinsic signals (from Nelken et al., 2004). B, Voronoi tessellation map showing the characteristic frequencies (CFs) of all unit recordings made (n = 811). These data were collected from a total of five animals and have been compiled onto one auditory cortex map. Each tile of the tessellation shows the CF obtained from each recording site, using the same color scale as in A. C–E, Voronoi tessellation maps plotting the proportion of variance explained by each of the stimulus dimensions: azimuth (C), pitch (D), and timbre (E). Each tile represents the average value obtained at that penetration. All units included in the variance decomposition are shown (n = 619). F–H, as C–E, but here each individual unit is plotted, with tiles representing units from a single penetration arranged counterclockwise by depth around the penetration site. I–K, Box-plots showing the proportion of variance explained by azimuth (I), pitch (J), and timbre (K) for each of the five cortical areas examined. The boxes show the upper and lower quartile values, and the horizontal lines at their “waist” indicate the median. In all cases, there was a significant effect of cortical field on the distribution of variance values (Kruskal–Wallis test, p < 0.001), and significant pairwise differences are indicated by the horizontal lines above the plots (Tukey–Kramer post hoc test, p < 0.05).
Table 1.
Total number of recordings (probe placements and units) in each cortical field for the 5 ferrets used in this study
| A1 | AAF | PPF | PSF | ADF | |
|---|---|---|---|---|---|
| Probe placements (n) | 10 | 7 | 11 | 7 | 5 |
| Units (n) | 189 | 101 | 152 | 96 | 77 |
The locations of each field were determined for individual animals as described in the Materials and Methods. Because we used multisite electrode arrays and commonly recorded several units at different depths, the range of CFs obtained in these cases was visualized by plotting one Voronoi tile for each unit recorded, arranged in a circular manner around the penetration site, with the most deeply recorded unit shown rightmost and proceeding clockwise from deep to superficial. The composite frequency map obtained in this manner is shown in Figure 3 B. The low frequency regions that mark the boundaries of fields AAF and ADF and of A1, PPF, and PSF are readily apparent.
To investigate the anatomical distribution of sensitivity to pitch, timbre, and location, we generated composite feature sensitivity maps using methods described further below. Figure 3 C–E maps the proportion of variance explained (Eq. 1) by the main effects of azimuth, pitch, and timbre, respectively, for every penetration made, onto the surface of the auditory cortex. Each “tile” in the Voronoi tesselation shows the average value obtained for all units recorded at that site. The color scale indicates the proportion of variance explained with darker, red colors indicating low, and brighter, yellow colors indicating high values. These plots suggest that there are areas in which clusters of units have a higher sensitivity to each stimulus parameter. Highly azimuth sensitive units were particularly common in A1, as well as in an area encircling the tip of the pseudosylvian sulcus. Highly pitch sensitive units were most commonly found in the middle of auditory cortex, around the point at which the low frequency edges of the tonotopic core and belt areas converge, as shown in Figure 3 B. Timbre sensitivity was highest in the primary fields and along the low frequency ridge that separates the two posterior fields, PPF and PSF. To illustrate the range of percentage variance explained in any one electrode penetration, Figure 3 F–H plots the values for every unit recorded, with each tile representing a single recorded unit, and multiple units from a single penetration arranged in a circular manner, as in Figure 3 B, around the site of the penetration. Overall, Figure 3 suggests that there are “clusters” of recording sites that are relatively more sensitive to stimulus azimuth, pitch, or timbre, but these are not obviously restricted to a particular subset of the five tonotopic cortical fields investigated here, and, in each field, we observed considerable unit-to-unit variability in the sensitivity to pitch, timbre, and location.
The distribution of parameter sensitivity for each cortical area was visualized in box-plot format (Fig. 3 I–K). Despite the very wide unit to unit variation, some degree of specialization is nevertheless apparent, as, for all three stimulus dimensions, there were significant differences in the proportion of variance explained by cortical field (Kruskal–Wallis test, χ2 = 27, 68, and 77 respectively, p < 0.0001). Tukey–Kramer post hoc comparisons (p < 0.05) revealed that azimuth sensitivity was, on average, significantly higher in A1 and PPF than in AAF, PSF, and ADF, pitch sensitivity tended to be more pronounced in A1 and the posterior fields PSF and PPF than in AAF and ADF, whereas AAF showed the highest average level of timbre sensitivity. These trends were seen consistently in each of the animals, and not just in the pooled data, and a jack-knife test was used to establish that no one animal contributed disproportionately to the small but significant differences reported here. The same statistical tests (i.e., Kruskal–Wallis and Tukey–Kramer post hoc tests) were implemented 5 times, excluding each of the five animals in turn. In all cases, the same significant trends across cortical areas were preserved.
Linear and nonlinear interactions in the cortical sensitivity to pitch, timbre, and azimuth
Our analysis method quantified the linear contribution of each of the three stimulus dimensions to the units' responses, as well as the nonlinear effects of presenting particular stimulus combinations. This nonlinear effect is quantified in our ANOVA by the three-way interaction of the time bin factor with two different stimulus parameters, and can be thought of as a measure of combination sensitivity. The interaction coefficients measure nonadditive (“multiplicative”) interactions between categorical variates, and are analogous to a logical AND operation (by how much does the response differ from the purely linear, additive expectation for specific parameter combinations e.g., when timbre = /i/ AND azimuth = 45°?). Over two-thirds of units tested were sensitive to more than one stimulus dimension and 41% of all units showed significant (p < 0.001) nonlinear interactions for at least one combination of pitch × timbre, azimuth × pitch, or azimuth × timbre. We also investigated whether it would be possible to describe the nature of these nonlinear interactions either as “predominantly expansive” or facilitatory, or as “predominantly compressive” or saturating. Expansive nonlinearity would make the response of a neuron more selective for a particular stimulus parameter combination, whereas saturating nonlinearities would have the opposite effect. Expansive nonlinearities are supra-additive, and would result in positive interaction coefficients which grow systematically as main effect coefficients grow larger. Compressive, subadditive nonlinearities, would, in contrast, result in large, positive main effect coefficients being associated with negative interaction coefficients. We therefore compared the sums of main effect coefficients (the “predicted additive response”) with their corresponding interaction coefficients, but we found no significant systematic trends or relationships. The interaction effects thus appear to be too variable to allow them to be characterized generally as overall predominantly expansive or compressive.
The distribution across the cortical surface of sensitivity to combinations of stimulus parameters is shown in Figure 4 A–C. Nonlinear interactions were most commonly observed in A1 and AAF, where 54% and 56% of units exhibited significant interactions between two or more stimuli, respectively. The most common interactions were between pitch and timbre, although azimuth × timbre sensitivity and azimuth × pitch sensitivity were also observed (Fig. 4 D). The proportion of units exhibiting significant interactions fell to 36%, 30%, and 15% in fields PPF, PSF, and ADF, respectively. Although the number of units showing interactions varied between cortical fields, the overall magnitude of the interaction term did not vary between cortical areas for either the azimuth × pitch or azimuth × timbre conditions. This is shown in Figure 4 E by plotting the proportion of variance explained by the sum of the spatial and nonspatial interaction terms (azimuth × pitch and azimuth × timbre) for each of the five cortical areas (Kruskal–Wallis test, χ2 = 5.5, p = 0.24). In contrast, the proportion of response variance explained by the pitch × timbre interaction term did show a significant variation across cortical fields (Fig. 4 F, Kruskal–Wallis test, χ2 = 48.2, p < 0.001), with combination sensitivity for nonspatial parameters accounting for more of the variance in the primary areas A1 and AAF than in the posterior fields PSF and PPF, which in turn, had higher values than ADF. This distribution is very similar to that observed for the timbre main effects.
Figure 4.

Nonlinear sensitivity to stimulus combinations. A–C, Maps showing the distributions of neural sensitivity attributable to (proportion of response variance explained by) timbre × azimuth (A), pitch × azimuth (B), or timbre × pitch (C) nonlinear two-way interactions. D, Histogram showing the number of units in each field in which there were significant two-stimulus interactions for each of these stimulus parameter combinations. The total number of units recorded in each cortical field are listed above. E, F, Box-plots summarizing the statistical distributions of the summed azimuth × timbre and azimuth × pitch interactions (E), and the pitch × timbre interactions (F). There was no significant difference in the distribution between fields for the interactions between spatial and nonspatial parameters shown in E (p = 0.24). In contrast, the magnitude of the pitch × timbre interactions did vary with cortical field (p < 0.001). Horizontal lines above the box-plots show which distributions had pairwise significantly different means (Tukey–Kramer post hoc test, p < 0.05).
Both the number and magnitude of the pitch × timbre interactions were greater than for either the timbre × azimuth or pitch × azimuth interaction terms, supporting a separation of spatial and nonspatial attributes throughout auditory cortex. However, this separation is far from complete: of the 254 units in which there was a significant interaction, 225 were sensitive to pitch–timbre combinations and 60 of these (i.e., 26%) were also sensitive to pitch–azimuth or timbre–azimuth combinations. In summary, whereas interactions in the “what” domain were more common, a substantial minority of units were sensitive to combinations of both spatial and nonspatial stimulus features.
Stimulus sensitivity differs with cortical depth
Our multisite recording electrodes allowed us to make simultaneous recordings at 8–16 different depths throughout the cortex. We grouped recordings coarsely into “superficial” or “deep” simply based on whether or not the recording site was within or >800 μm below the cortical surface. These divisions coarsely divide units into supragranular and infragranular cortical layers. The distribution of proportion of variance explained values are plotted in Figure 5. Azimuth sensitivity was found to be greatest in the deeper cortical layers (2-sampled t test, p = 0.01), whereas pitch and timbre sensitivity were greater in the superficial layers (p = 0.004 and p < 0.001, respectively). Pitch–timbre interactions were also more common in the superficial layers (p = 0.002) whereas pitch–azimuth (p = 0.33) and timbre–azimuth (p = 0.35) interactions were found to be equally distributed in depth. Data were pooled across all cortical areas for these analyses, but similar trends were observed in each of the five cortical fields individually.
Figure 5.

Parameter sensitivity in superficial and deep cortical layers. A–C, Distribution of parameter sensitivity (response variance attributable) to azimuth (A), pitch (B), and timbre (C) for responses recorded at superficial (<800 μm) or deep (>800 μm) cortical locations. Higher sensitivities to pitch and timbre were relatively more common in the superficial layers.
Azimuth, pitch, and timbre sensitivities do not depend on unit characteristic frequency
In Figure 3 E we showed that clusters of units with high timbre sensitivity were commonly found in the low CF border region between A1, PPF, and PSF. This raises the question of whether sensitivity to timbre, or indeed to other stimulus parameters, varies systematically with unit CF. However, scatter plots of unit CF against the proportion of variance explained (supplemental Fig. 2A–C, available at www.jneurosci.org as supplemental material) showed no systematic relationship between unit CF and azimuth, pitch, or timbre sensitivity. Furthermore, pitch, timbre, or azimuth sensitivity was just as common among units that were unresponsive or untuned to pure tones as in units with clearly defined CFs (supplemental Fig. 2D–F, available at www.jneurosci.org as supplemental material), and there were no CFs at which it was particularly easy or difficult to obtain vowel responses (supplemental Fig. 1G, available at www.jneurosci.org as supplemental material). We also found no significant correlations between CF and best pitch (defined as the pitch that elicited the most spikes per presentation) for pitch-sensitive units with a CF <1 kHz.
Discussion
It has been proposed that a division of labor exists across auditory cortical areas whereby the ability of humans and animals to recognize or localize auditory objects can be attributed to anatomically separate processing streams. This concept is inspired by earlier studies that postulated distinct hierarchies for processing different visual features, such as color or motion, in extrastriate visual cortex (Ungerleider and Haxby, 1994). Parallel processing in the auditory system is supported by behavioral-deactivation (Lomber and Malhotra, 2008), functional imaging (Alain et al., 2001; Maeder et al., 2001; Warren and Griffiths, 2003; Barrett and Hall, 2006), and electrophysiological studies (Recanzone, 2000; Tian et al., 2001; Cohen et al., 2004), as well as by anatomical evidence showing differences in the connectivity of these regions (Hackett et al., 1999; Romanski et al., 2000; Bizley et al., 2007). Most of the physiological studies compared the sensitivity of different auditory cortical areas to only one stimulus parameter, such as spatial location or pitch. Here we adopted a different approach, based around a stimulus set in which several stimulus dimensions were systematically varied, to explore the relative sensitivity of neurons in different cortical fields to azimuth, pitch, and timbre.
Choice of stimulus parameter values
Because we examined neural responses to three stimulus attributes, the range of values selected in each case was necessarily limited, but nonetheless covered behaviorally pertinent and broadly comparable ranges. Ferrets can accurately localize low-frequency narrowband noise bursts (Kacelnik et al., 2006) and lateralize the same synthetic vowels that were used in the present experiment. Although the range of azimuths used covered only the frontal quadrant of auditory space, behavioral and electrophysiological studies have shown particularly high sensitivities within this region to changes in sound-source direction (Mrsic-Flogel et al., 2005; Nodal et al., 2008). The separation of our stimuli in both azimuth (Parsons et al., 1999) and pitch (Walker et al., 2009) was large compared with psychoacoustic difference limens. There have been few studies of timbre discrimination in animals, but chinchillas can discriminate the vowels /i/ and /a/ across a range of speakers and pitches (Burdick and Miller, 1975), and our own data demonstrate that ferrets can accurately discriminate the vowel timbres used in this study (Bizley, Walker, King, and Schnupp, unpublished observations).
Distribution of azimuth, pitch, and timbre sensitivity
The bulk of behavioral and neurophysiological studies of auditory cortex have been performed in cats. A1 is well conserved across species, and AAF appears to be equivalent in cat and ferret (Kowalski et al., 1995; Imaizumi et al., 2004; Bizley et al., 2005). The posterior fields, PPF and PSF, in the ferret share certain similarities with the posterior auditory field (PAF) in the cat, both being tonotopically organized and containing neurons with different temporal response properties from those in the primary fields (Phillips and Orman, 1984; Stecker et al., 2003; Bizley et al., 2005). Like the cat's secondary auditory field (Schreiner and Cynader, 1984), ferret ADF lacks tonotopic organization and contains neurons with broad frequency response areas (Bizley et al., 2005). Although strict homologies have yet to be established, auditory cortex appears to be organized in a similar manner in these species.
We found that, as in cats (Harrington et al., 2008), sensitivity to changes in sound azimuth varies across auditory cortex, but is nonetheless a property of all areas examined. This contrasts with recent behavioral data in cats (Lomber et al., 2007), which suggest that certain cortical fields, such as A1 and PAF, are required for normal sound localization, whereas others, such as AAF, are not. However, complex behaviors, like remembering to approach a sound source for a reward, are bound to require cognitive control from high-order cortical areas, most likely in frontal cortex. The profound differences observed in response to cooling different cortical fields may therefore have less to do with the physiological properties of neurons in those areas than with their projections to higher-order brain regions (Hackett et al., 1998; Romanski et al., 1999).
Our findings are also in broad agreement with many previous studies of cortical pitch sensitivity. Our “pitch sensitivity” test was less stringent than that used by Bendor and Wang (2005), who reported a pitch-selective area in marmoset auditory cortex. However, in agreement with their observations, we found pitch-sensitive neurons to be more common in the superficial cortical layers and to occur frequently (although not exclusively) near the low-frequency border of A1. Nevertheless, overall, we did not find a correlation between unit CF and pitch sensitivity or a tendency for low CF neurons to be more sensitive to pitch. The lack of a single pitch center in ferret auditory cortex is supported by the results of imaging studies in ferrets (Nelken et al., 2008) and humans (Hall and Plack, 2008).
The neural basis for timbre processing has been much less widely studied. Previous studies have demonstrated that the response properties of neurons in A1 are well suited to detect spectral envelope cues (Calhoun and Schreiner, 1998; Versnel and Shamma, 1998). Moreover, the spectral integration properties of A1 neurons have been reported to be topographically organized in A1 in a manner that might support vowel discrimination based on the frequency relationship of the first and second formants (Ohl and Scheich, 1997). Consistent with these studies, we found that sensitivity to vowel timbre was greatest in the primary auditory cortical areas of the ferret. Nevertheless, as with azimuth and pitch sensitivity, the responses of neurons recorded in all five cortical fields were modulated by timbre. Lesions of the dorsal/rostral auditory association cortex, but not A1, in rats impaired performance on a multiformant vowel discrimination task (Kudoh et al., 2006). Using fMRI, timbre sensitivity has been demonstrated in both posterior Heschl's gyrus and the superior temporal sulcus in humans (Menon et al., 2002; Kumar et al., 2007).
Previous studies have reported systematic differences in neural tuning properties along isofrequency laminae in A1. Changes in the representation of properties such as tone threshold and tuning bandwidth (Schreiner and Mendelson, 1990; Cheung et al., 2001; Read et al., 2001) and binaural response characteristics (Middlebrooks et al., 1980; Rutkowski et al., 2000) have been observed. However, the sampling density of recording sites in individual animals was insufficiently fine to investigate whether this was the case for any of the parameters investigated in the present study.
Interdependent coding of pitch, timbre, and azimuth
Our analysis revealed that the neural encoding of pitch, location, and timbre cues is interwoven and distributed across auditory cortex. These methods were sensitive to changes in neural firing that occurred over time and were able to capture the effects apparent in the raw data in a way that a simple spike-count measure failed to. Previous studies have also shown that the timing of spikes in auditory cortex carries information useful for discriminating natural sounds (Schnupp et al., 2006; Gourévitch and Eggermont, 2007), as well as about a sound's pitch (Steinschneider et al., 1998) and location (Furukawa and Middlebrooks, 2002; Nelken et al., 2005).
Our stimuli spanned three independent perceptual dimensions, but very few neurons in any of the cortical fields examined were sensitive to changes in azimuth, pitch, or timbre only. Nevertheless, small but significant differences in average neuronal sensitivity were observed across cortical areas and depths. These subtle regional differences could provide the basis for the subsequent anatomical segregation of spatial and nonspatial information in higher-order cortical areas. Although it is possible that cortical areas other than those sampled here exhibit greater functional specialization, or that a clearer distinction might be apparent with other stimulus features, such as those that are temporally modulated, it is important to remember that spatial and nonspatial aspects of sounds often have to be considered together. For instance, to operate effectively in the presence of multiple sound sources, it is necessary to be able to track specific pitch, timbre, and sound-source location combinations over time. Spatial sensitivity has been reported within auditory cortical and prefrontal areas thought to be concerned with sound identification (Cohen et al., 2004; Gifford and Cohen, 2005; Lewald et al., 2008). Moreover, a recent study (Recanzone, 2008) documenting sensitivity to monkey calls found that neurons throughout auditory cortex were equally selective in their responses. Interactions between spatial and nonspatial processing streams are known to occur in the visual cortex (Tolias et al., 2005). Such effects are likely to be particularly important in audition, where multiple sounds can be perceived simultaneously at several locations.
We found that cortical neurons often responded nonlinearly to feature combinations. This was particularly the case for pitch and timbre in the primary fields, A1 and AAF. This apparent combination sensitivity could simply reflect intermixing of relatively low level sensitivity to multiple sound features. However, it has been argued that A1 might represent auditory objects by grouping together physical stimulus attributes from a common source, with higher-order cortical areas extracting perceptual features, such as the object's location, from this object-based representation (Nelken and Bar-Yosef, 2008). Grouping stimulus attributes is essential for tracking a sound source through a potentially cluttered acoustic environment (Bregman, 1990), and the nonlinear sensitivity that we observed in A1 may be ideally suited to achieving this. We observed a decrease in nonlinear feature interactions away from A1, suggesting an increasingly independent representation of these perceptual dimensions in higher auditory cortex. Although still sensitive to different sound features, this sensitivity was well described by linear interactions, which help to preserve information for subsequent processing.
Ultimately, the question of interest is how this distributed network of neurons contributes to perception. In humans, selective attention has been shown to modulate putative localization and identification pathways independently (Ahveninen et al., 2006). The true extent to which a division of labor exists within auditory cortex may therefore become apparent only when animals use the activity in these areas to listen to different attributes of sound.
Footnotes
This work was supported by the Biotechnology and Biological Sciences Research Council (Grants BB/D009758/1 to J.W.H.S., A.J.K., and J.K.B.), the Engineering and Physical Sciences Research Council (Grant EP/C010841/1 to J.W.H.S.), a Rothermere Fellowship and Hector Pilling Scholarship to K.M.M.W., and a Wellcome Trust Principal Research Fellowship to A.J.K. We are grateful to Israel Nelken for valuable discussion and comments on this manuscript.
References
- Ahveninen J, Jääskeläinen IP, Raij T, Bonmassar G, Devore S, Hämäläinen M, Levänen S, Lin FH, Sams M, Shinn-Cunningham BG, Witzel T, Belliveau JW. Task-modulated “what” and “where” pathways in human auditory cortex. Proc Natl Acad Sci U S A. 2006;103:14608–14613. doi: 10.1073/pnas.0510480103. [DOI] [PMC free article] [PubMed] [Google Scholar]
- Alain C, Arnott SR, Hevenor S, Graham S, Grady CL. “What” and “where” in the human auditory system. Proc Natl Acad Sci U S A. 2001;98:12301–12306. doi: 10.1073/pnas.211209098. [DOI] [PMC free article] [PubMed] [Google Scholar]
- Barrett DJ, Hall DA. Response preferences for “what” and “where” in human non-primary auditory cortex. Neuroimage. 2006;32:968–977. doi: 10.1016/j.neuroimage.2006.03.050. [DOI] [PubMed] [Google Scholar]
- Bendor D, Wang X. The neuronal representation of pitch in primate auditory cortex. Nature. 2005;436:1161–1165. doi: 10.1038/nature03867. [DOI] [PMC free article] [PubMed] [Google Scholar]
- Bizley JK, King AJ. Visual-auditory spatial processing in auditory cortical neurons. Brain Res. 2008;1242:24–36. doi: 10.1016/j.brainres.2008.02.087. [DOI] [PMC free article] [PubMed] [Google Scholar]
- Bizley JK, Nodal FR, Nelken I, King AJ. Functional organization of ferret auditory cortex. Cereb Cortex. 2005;15:1637–1653. doi: 10.1093/cercor/bhi042. [DOI] [PubMed] [Google Scholar]
- Bizley JK, Nodal FR, Bajo VM, Nelken I, King AJ. Physiological and anatomical evidence for multisensory interactions in auditory cortex. Cereb Cortex. 2007;17:2172–2189. doi: 10.1093/cercor/bhl128. [DOI] [PMC free article] [PubMed] [Google Scholar]
- Bregmen AS. Auditory scene analysis: the perceptual organisation of sound. Cambridge, MA: MIT; 1990. [Google Scholar]
- Burdick CK, Miller JD. Speech perception by the chinchilla: discrimination of sustained /a/ and /i. J Acoust Soc Am. 1975;58:415–427. doi: 10.1121/1.380686. [DOI] [PubMed] [Google Scholar]
- Calhoun BM, Schreiner CE. Spectral envelope coding in cat primary auditory cortex: linear and non-linear effects of stimulus characteristics. Eur J Neurosci. 1998;10:926–940. doi: 10.1046/j.1460-9568.1998.00102.x. [DOI] [PubMed] [Google Scholar]
- Cheung SW, Bedenbaugh PH, Nagarajan SS, Schreiner CE. Functional organization of squirrel monkey primary auditory cortex: responses to pure tones. J Neurophysiol. 2001;85:1732–1749. doi: 10.1152/jn.2001.85.4.1732. [DOI] [PubMed] [Google Scholar]
- Cohen YE, Russ BE, Gifford GW, 3rd, Kiringoda R, MacLean KA. Selectivity for the spatial and nonspatial attributes of auditory stimuli in the ventrolateral prefrontal cortex. J Neurosci. 2004;24:11307–11316. doi: 10.1523/JNEUROSCI.3935-04.2004. [DOI] [PMC free article] [PubMed] [Google Scholar]
- Fuller DR, Lloyd LL. Effects of configuration on the paired-associate learning of blissymbols by preschool children with normal cognitive abilities. J Speech Hear Res. 1992;35:1376–1383. doi: 10.1044/jshr.3506.1376. [DOI] [PubMed] [Google Scholar]
- Furukawa S, Middlebrooks JC. Cortical representation of auditory space: information-bearing features of spike patterns. J Neurophysial. 2002;87:1749–1762. doi: 10.1152/jn.00491.2001. [DOI] [PubMed] [Google Scholar]
- Gelfer MP, Mikos VA. The relative contributions of speaking fundamental frequency and formant frequencies to gender identification based on isolated vowels. J Voice. 2005;19:544–554. doi: 10.1016/j.jvoice.2004.10.006. [DOI] [PubMed] [Google Scholar]
- Gifford GW, 3rd, Cohen YE. Spatial and non-spatial auditory processing in the lateral intraparietal area. Exp Brain Res. 2005;162:509–512. doi: 10.1007/s00221-005-2220-2. [DOI] [PubMed] [Google Scholar]
- Goodale MA, Milner AD. Separate visual pathways for perception and action. Trends Neurosci. 1992;15:20–25. doi: 10.1016/0166-2236(92)90344-8. [DOI] [PubMed] [Google Scholar]
- Gourévitch B, Eggermont JJ. Spatial representation of neural responses to natural and altered conspecific vocalizations in cat auditory cortex. J Neurophysiol. 2007;97:144–158. doi: 10.1152/jn.00807.2006. [DOI] [PubMed] [Google Scholar]
- Hackett TA, Stepniewska I, Kaas JH. Subdivisions of auditory cortex and ipsilateral cortical connections of the parabelt auditory cortex in macaque monkeys. J Comp Neurol. 1998;394:475–495. doi: 10.1002/(sici)1096-9861(19980518)394:4<475::aid-cne6>3.0.co;2-z. [DOI] [PubMed] [Google Scholar]
- Hackett TA, Stepniewska I, Kaas JH. Prefrontal connections of the parabelt auditory cortex in macaque monkeys. Brain Res. 1999;817:45–58. doi: 10.1016/s0006-8993(98)01182-2. [DOI] [PubMed] [Google Scholar]
- Hall DA, Plack CJ. Pitch processing sites in the human auditory brain. Cereb Cortex. 2008. [DOI] [PMC free article] [PubMed]
- Harrington IA, Stecker GC, Macpherson EA, Middlebrooks JC. Spatial sensitivity of neurons in the anterior, posterior, and primary fields of cat auditory cortex. Hear Res. 2008;240:22–41. doi: 10.1016/j.heares.2008.02.004. [DOI] [PMC free article] [PubMed] [Google Scholar]
- Imaizumi K, Priebe NJ, Crum PA, Bedenbaugh PH, Cheung SW, Schreiner CE. Modular functional organization of cat anterior auditory field. J Neurophysiol. 2004;92:444–457. doi: 10.1152/jn.01173.2003. [DOI] [PubMed] [Google Scholar]
- Kaas JH, Hackett TA. Subdivisions of auditory cortex and processing streams in primates. Proc Natl Acad Sci U S A. 2000;97:11793–11799. doi: 10.1073/pnas.97.22.11793. [DOI] [PMC free article] [PubMed] [Google Scholar]
- Kacelnik O, Nodal FR, Parsons CH, King AJ. Training-induced plasticity of auditory localization in adult mammals. PLoS Biol. 2006;4:e71. doi: 10.1371/journal.pbio.0040071. [DOI] [PMC free article] [PubMed] [Google Scholar]
- Kelly JB, Judge PW, Phillips DP. Representation of the cochlea in primary auditory cortex of the ferret (Mustela putorius) Hear Res. 1986;24:111–115. doi: 10.1016/0378-5955(86)90054-7. [DOI] [PubMed] [Google Scholar]
- Kowalski N, Versnel H, Shamma SA. Comparison of responses in the anterior and primary auditory fields of the ferret cortex. J Neurophysiol. 1995;73:1513–1523. doi: 10.1152/jn.1995.73.4.1513. [DOI] [PubMed] [Google Scholar]
- Kudoh M, Nakayama Y, Hishida R, Shibuki K. Requirement of the auditory association cortex for discrimination of vowel-like sounds in rats. Neuroreport. 2006;17:1761–1766. doi: 10.1097/WNR.0b013e32800fef9d. [DOI] [PubMed] [Google Scholar]
- Kumar S, Stephan KE, Warren JD, Friston KJ, Griffiths TD. Hierarchical processing of auditory objects in humans. PLoS Comput Biol. 2007;3:e100. doi: 10.1371/journal.pcbi.0030100. [DOI] [PMC free article] [PubMed] [Google Scholar]
- Lewald J, Riederer KA, Lentz T, Meister IG. Processing of sound location in human cortex. Eur J Neurosci. 2008;27:1261–1270. doi: 10.1111/j.1460-9568.2008.06094.x. [DOI] [PubMed] [Google Scholar]
- Lomber SG, Malhotra S. Double dissociation of ‘what’ and ‘where’ processing in auditory cortex. Nat Neurosci. 2008;11:609–616. doi: 10.1038/nn.2108. [DOI] [PubMed] [Google Scholar]
- Lomber SG, Malhotra S, Hall AJ. Functional specialization in non-primary auditory cortex of the cat: areal and laminar contributions to sound localization. Hear Res. 2007;229:31–45. doi: 10.1016/j.heares.2007.01.013. [DOI] [PubMed] [Google Scholar]
- Maeder PP, Meuli RA, Adriani M, Bellmann A, Fornari E, Thiran JP, Pittet A, Clarke S. Distinct pathways involved in sound recognition and localization: a human fMRI study. Neuroimage. 2001;14:802–816. doi: 10.1006/nimg.2001.0888. [DOI] [PubMed] [Google Scholar]
- Menon V, Levitin DJ, Smith BK, Lembke A, Krasnow BD, Glazer D, Glover GH, McAdams S. Neural correlates of timbre change in harmonic sounds. Neuroimage. 2002;17:1742–1754. doi: 10.1006/nimg.2002.1295. [DOI] [PubMed] [Google Scholar]
- Middlebrooks JC, Dykes RW, Merzenich MM. Binaural response-specific bands in primary auditory cortex (AI) of the cat: topographical organization orthogonal to isofrequency contours. Brain Res. 1980;181:31–48. doi: 10.1016/0006-8993(80)91257-3. [DOI] [PubMed] [Google Scholar]
- Mishkin M, Ungerleider LG. Contribution of striate inputs to the visuospatial functions of parieto-preoccipital cortex in monkeys. Behav Brain Res. 1982;6:57–77. doi: 10.1016/0166-4328(82)90081-x. [DOI] [PubMed] [Google Scholar]
- Mrsic-Flogel TD, King AJ, Schnupp JWH. Encoding of virtual acoustic space stimuli by neurons in ferret primary auditory cortex. J Neurophysiol. 2005;93:3489–3503. doi: 10.1152/jn.00748.2004. [DOI] [PubMed] [Google Scholar]
- Nelken I, Bar-Yosef O. Neurons and objects: the case of auditory cortex. Front Neurosci. 2008;2:107–113. doi: 10.3389/neuro.01.009.2008. [DOI] [PMC free article] [PubMed] [Google Scholar]
- Nelken I, Bizley JK, Nodal FR, Ahmed B, Schnupp JW, King AJ. Large-scale organization of ferret auditory cortex revealed using continuous acquisition of intrinsic optical signals. J Neurophysiol. 2004;92:2574–2588. doi: 10.1152/jn.00276.2004. [DOI] [PubMed] [Google Scholar]
- Nelken I, Chechik G, Mrsic-Flogel TD, King AJ, Schnupp JWH. Encoding stimulus information by spike numbers and mean response time in primary auditory cortex. J Comput Neurosci. 2005;19:199–221. doi: 10.1007/s10827-005-1739-3. [DOI] [PubMed] [Google Scholar]
- Nelken I, Bizley JK, Nodal FR, Ahmed B, King AJ, Schnupp JWH. Responses of auditory cortex to complex stimuli: functional organization revealed using intrinsic optical signals. J Neurophysiol. 2008;99:1928–1941. doi: 10.1152/jn.00469.2007. [DOI] [PMC free article] [PubMed] [Google Scholar]
- Nodal FR, Bajo VM, Parsons CH, Schnupp JW, King AJ. Sound localization behavior in ferrets: comparison of acoustic orientation and approach-to-target responses. Neuroscience. 2008;154:397–408. doi: 10.1016/j.neuroscience.2007.12.022. [DOI] [PMC free article] [PubMed] [Google Scholar]
- Ohl FW, Scheich H. Orderly cortical representation of vowels based on formant interaction. Proc Natl Acad Sci U S A. 1997;94:9440–9444. doi: 10.1073/pnas.94.17.9440. [DOI] [PMC free article] [PubMed] [Google Scholar]
- Parsons CH, Lanyon RG, Schnupp JW, King AJ. Effects of altering spectral cues in infancy on horizontal and vertical sound localization by adult ferrets. J Neurophysiol. 1999;82:2294–2309. doi: 10.1152/jn.1999.82.5.2294. [DOI] [PubMed] [Google Scholar]
- Peterson GE, Barney HL. Control methods used in a study of the vowels. J Acoust Soc Am. 1952;24:175–184. [Google Scholar]
- Phillips DP, Orman SS. Responses of single neurons in posterior field of cat auditory cortex to tonal stimulation. J Neurophysiol. 1984;51:147–163. doi: 10.1152/jn.1984.51.1.147. [DOI] [PubMed] [Google Scholar]
- Rauschecker JP, Tian B, Pons T, Mishkin M. Serial and parallel processing in rhesus monkey auditory cortex. J Comp Neurol. 1997;382:89–103. [PubMed] [Google Scholar]
- Read HL, Winer JA, Schreiner CE. Modular organization of intrinsic connections associated with spectral tuning in cat auditory cortex. Proc Natl Acad Sci U S A. 2001;98:8042–8047. doi: 10.1073/pnas.131591898. [DOI] [PMC free article] [PubMed] [Google Scholar]
- Recanzone GH. Spatial processing in the auditory cortex of the macaque monkey. Proc Natl Acad Sci U S A. 2000;97:11829–11835. doi: 10.1073/pnas.97.22.11829. [DOI] [PMC free article] [PubMed] [Google Scholar]
- Recanzone GH. Representation of con-specific vocalizations in the core and belt areas of the auditory cortex in the alert macaque monkey. J Neurosci. 2008;28:13184–13193. doi: 10.1523/JNEUROSCI.3619-08.2008. [DOI] [PMC free article] [PubMed] [Google Scholar]
- Reissland N, Shepherd J, Herrera E. The pitch of maternal voice: a comparison of mothers suffering from depressed mood and non-depressed mothers reading books to their infants. J Child Psychol Psychiatry. 2003;44:255–261. doi: 10.1111/1469-7610.00118. [DOI] [PubMed] [Google Scholar]
- Romanski LM, Tian B, Fritz J, Mishkin M, Goldman-Rakic PS, Rauschecker JP. Dual streams of auditory afferents target multiple domains in the primate prefrontal cortex. Nat Neurosci. 1999;2:1131–1136. doi: 10.1038/16056. [DOI] [PMC free article] [PubMed] [Google Scholar]
- Romanski LM, Tian B, Fritz JB, Mishkin M, Goldman-Rakic PS, Rauschecker JP. Reply to “What', ‘where’ and ‘how’ in auditory cortex’. Nat Neurosci. 2000;3:966. doi: 10.1038/79892. [DOI] [PubMed] [Google Scholar]
- Rutkowski RG, Wallace MN, Shackleton TM, Palmer AR. Organisation of binaural interactions in the primary and dorsocaudal fields of the guinea pig auditory cortex. Hear Res. 2000;145:177–189. doi: 10.1016/s0378-5955(00)00087-3. [DOI] [PubMed] [Google Scholar]
- Schnupp JW, Booth J, King AJ. Modeling individual differences in ferret external ear transfer functions. J Acoust Soc Am. 2003;113:2021–2030. doi: 10.1121/1.1547460. [DOI] [PubMed] [Google Scholar]
- Schnupp JW, Hall TM, Kokelaar RF, Ahmed B. Plasticity of temporal pattern codes for vocalization stimuli in primary auditory cortex. J Neurosci. 2006;26:4785–4795. doi: 10.1523/JNEUROSCI.4330-05.2006. [DOI] [PMC free article] [PubMed] [Google Scholar]
- Schreiner CE, Cynader MS. Basic functional organization of second auditory cortical field (AII) of the cat. J Neurophysiol. 1984;51:1284–1305. doi: 10.1152/jn.1984.51.6.1284. [DOI] [PubMed] [Google Scholar]
- Schreiner CE, Mendelson JR. Functional topography of cat primary auditory cortex: distribution of integrated excitation. J Neurophysiol. 1990;64:1442–1459. doi: 10.1152/jn.1990.64.5.1442. [DOI] [PubMed] [Google Scholar]
- Stecker GC, Mickey BJ, Macpherson EA, Middlebrooks JC. Spatial sensitivity in field PAF of cat auditory cortex. J Neurophysiol. 2003;89:2889–2903. doi: 10.1152/jn.00980.2002. [DOI] [PubMed] [Google Scholar]
- Stecker GC, Harrington IA, Macpherson EA, Middlebrooks JC. Spatial sensitivity in the dorsal zone (area DZ) of cat auditory cortex. J Neurophysiol. 2005;94:1267–1280. doi: 10.1152/jn.00104.2005. [DOI] [PubMed] [Google Scholar]
- Steinschneider M, Reser DH, Fishman YI, Schroeder CE, Arezzo JC. Click train encoding in primary auditory cortex of the awake monkey: evidence for two mechanisms subserving pitch perception. J Acoust Soc Am. 1998;104:2935–2955. doi: 10.1121/1.423877. [DOI] [PubMed] [Google Scholar]
- Tian B, Reser D, Durham A, Kustov A, Rauschecker JP. Functional specialization in rhesus monkey auditory cortex. Science. 2001;292:290–293. doi: 10.1126/science.1058911. [DOI] [PubMed] [Google Scholar]
- Tolias AS, Keliris GA, Smirnakis SM, Logothetis NK. Neurons in macaque area V4 acquire directional tuning after adaptation to motion stimuli. Nat Neurosci. 2005;8:591–593. doi: 10.1038/nn1446. [DOI] [PubMed] [Google Scholar]
- Ungerleider LG, Haxby JV. ‘What’ and ‘where’ in the human brain. Curr Opin Neurobiol. 1994;4:157–165. doi: 10.1016/0959-4388(94)90066-3. [DOI] [PubMed] [Google Scholar]
- Versnel H, Shamma SA. Spectral-ripple representation of steady-state vowels in primary auditory cortex. J Acoust Soc Am. 1998;103:2502–2514. doi: 10.1121/1.422771. [DOI] [PubMed] [Google Scholar]
- Walker KM, Ahmed B, Schnupp JW. Linking cortical spike pattern codes to auditory perception. J Cogn Neurosci. 2008;20:135–152. doi: 10.1162/jocn.2008.20012. [DOI] [PubMed] [Google Scholar]
- Walker KM, Schnupp JWH, Hart-Schnupp S, King AJ, Bizley JK. Discrimination by ferrets of the direction of pitch changes in simple and complex sounds. J Acoust Soc Am. 2009 doi: 10.1121/1.3179676. in press. [DOI] [PMC free article] [PubMed] [Google Scholar]
- Warren JD, Griffiths TD. Distinct mechanisms for processing spatial sequences and pitch sequences in the human auditory brain. J Neurosci. 2003;23:5799–5804. doi: 10.1523/JNEUROSCI.23-13-05799.2003. [DOI] [PMC free article] [PubMed] [Google Scholar]
- Warren JD, Uppenkamp S, Patterson RD, Griffiths TD. Separating pitch chroma and pitch height in the human brain. Proc Natl Acad Sci U S A. 2003;100:10038–10042. doi: 10.1073/pnas.1730682100. [DOI] [PMC free article] [PubMed] [Google Scholar]