

Abstract
Expression of Musashi1 (Msi1), an evolutionarily conserved RNA‐binding protein, in neural stem cells of the subventricular zone in the postnatal and adult CNS indicates a potential role in the generation of oligodendrocytes. We now show Msi1 expression in a subset of oligodendrocyte progenitor (OP) cells in white matter areas temporally and spatially associated with oligodendrogenesis in the postnatal CNS. Msi1 function was evaluated by infection of OP cells with retroviral transduction of Msi1 or knockdown of endogenous Msi1. Retroviral expression of Msi1 significantly reduced the proportion of mature oligodendrocytes generated from OP cells in vitro and in vivo during myelination. Msi1 transduction also promoted OP survival, particularly under conditions of challenge from oxidative stress, while Msi1 siRNA knockdown resulted in dramatic OP cell death. Furthermore, in experimental demyelination Msi1 expression was increased among cells associated with lesions, including OP cells, indicating a potential role in the generation of remyelinating oligodendrocytes. © 2007 Wiley‐Liss, Inc.
Keywords: oligodendrocyte progenitor, differentiation, glial development, remyelination
INTRODUCTION
Neural stem cells respond to a complex network of signals to generate the appropriate complement of neurons, astrocytes, and oligodendrocytes in the developing brain. The molecular signals are now being identified that direct neural stem cells to become committed as oligodendrocyte progenitor (OP) cells that can differentiate into oligodendrocytes. Transcription factors, such as Olig and Sox family proteins, play a critical role in the generation of myelinating oligodendrocytes from neural stem cells and OP cells (Gokhan et al., 2005; Ligon et al., 2006; Stolt et al., 2002).
Along with transcription factors, several classes of evolutionarily conserved RNA‐binding proteins control neural cell specification and differentiation through post‐transcriptional regulation. The Elav family, which includes the vertebrate Hu proteins, appears to function in the survival and differentiation of neurons (Akamatsu et al., 1999; Okano and Darnell, 1997). The quaking family of RNA‐binding proteins has primarily been identified in glial progenitors and oligodendrocytes; expression of several alternatively spliced isoforms coincides with the development of oligodendrocytes and the onset of myelination (Ebersole et al., 1996; Hardy, 1998; Lu et al., 2003). The Musashi (Msi) family is preferentially expressed in CNS stem cells and appears to maintain these cells in an undifferentiated state (Kaneko et al., 2000; Okano et al., 2005; Sakakibara et al., 1996), although differential expression of Msi1 may regulate cell fate decisions in the postnatal brain. In neonatal mice, multipotent cells in the subventricular zone (SVZ) and cells of the astrocyte lineage express Msi1, but postmitotic neurons and mature oligodendrocytes do not express Msi1 (Sakakibara et al., 1996; Sakakibara and Okano, 1997), suggesting that differentiation along neuronal and oligodendrocyte lineages may require Msi1 downregulation.
Analysis of embryonic development in Msi1 knockout mice provided initial clues that Msi1 may be a key regulator of oligodendrocyte development. Neurospheres from embryonic Msi1−/− mice exhibited normal proliferation and self‐renewal activity (Sakakibara et al., 2002). However, the number of clones containing oligodendrocytes was slightly reduced in Msi1−/− neurospheres compared to wild‐type neurospheres while clones containing neurons and/or astrocytes were significantly increased (Sakakibara et al., 2002). Therefore, Msi1 expression may be important for oligodendrocyte development from neural stem cells in the embryonic CNS.
Since the majority of oligodendrocytes are generated postnatally, we sought to delineate the role of Msi1 in the development of oligodendrocytes from OP cells in the postnatal CNS. Our results show that Msi1 is expressed early in the oligodendrocyte lineage with subsequent downregulation. Retroviral expression of Msi1 promoted OP survival and inhibited differentiation but had no effect on proliferation. Msi1 knockdown resulted in dramatic OP cell death. These results suggest that Msi1 plays a central role in oligodendrocyte development by promoting survival and modulating differentiation of early OP cells. Furthermore, in experimental demyelination we show Msi1 expression in OP cells associated with lesions, indicating a potential role in generation of remyelinating oligodendrocytes.
MATERIALS AND METHODS
Animals
All procedures on postnatal and adult C57Bl/6 mice (Jackson Labs, Bar Harbor, ME) and Sprague‐Dawley rat pups were performed in accordance with guidelines of the National Institutes of Health and the USUHS Institutional Animal Care and Use Committee.
Preparation of Neonatal OP Cultures
Neonatal OP cultures were prepared from postnatal day 2 (P2) rats as previously described (Armstrong, 1998; Simpson and Armstrong, 1999). Briefly, brains were dissociated and plated in tissue culture flasks or 24‐well plates to produce stratified “primary” cultures. After shaking to dislodge microglia, flasks were shaken overnight to yield OP cells, which were plated as “secondary” cultures and grown in defined medium supplemented with 0.5% FBS (Sigma, St. Louis, MO). When indicated, the defined medium was supplemented with human recombinant platelet derived growth factor AA homodimer (PDGF) and fibroblast growth factor 2 (FGF2; both 10 ng/ml; R&D Systems, Minneapolis, MN) to stimulate OP cells to proliferate without differentiating. Secondary cultures were fixed in 4% paraformaldehyde for 10 min at specific intervals after seeding to generate cultures enriched in preprogenitor stage cells (also referred to as “pre‐O‐2A” cells) after 2 hours with PDGF and FGF2, bipolar OP cells (also referred to as “O‐2A” cells) after 1 day with PDGF and FGF2, and mature oligodendrocytes after 3 days without PDGF and FGF2 (see characterization of cell stages in Armstrong, 1998).
Preparation of CNS Tissue Sections from Postnatal Mice
P7 male mice were perfused and tissue was processed as previously described (Murtie et al., 2005a). Coronal brain and transverse spinal cord sections cut on a cryostat (15 μm thick) were used for in situ hybridization and immunostaining.
In Situ Hybridization
In situ hybridization to mRNA transcripts and detection with NBT/BCIP substrate (DAKO, Carpinteria, CA) was performed as previously detailed (Messersmith et al., 2000; Redwine and Armstrong, 1998). The digoxigenin‐labeled riboprobe used to detect Msi1 was prepared from murine Msi1 cDNA template (from Dr. Hideyuki Okano; Keio University School of Medicine, Tokyo, Japan;Sakakibara et al., 1996).
Immunohistochemistry/Immunocytochemistry
Msi1 protein was detected with biotinylated rat 14H1 monoclonal anti‐Msi1 antibody (1:2000; from Dr. Hideyuki Okano; 14H1 does not cross‐react with Msi2, see Kaneko et al., 2000 and Sakakibara et al., 2001) followed by tyramide signal amplification (PerkinElmer Life Sciences, Boston, MA). Primary antibodies for Olig2 (1:10,000; from Dr. John Alberta, Dana Farber Cancer Institute, Boston, MA and Dr. David Rowitch, University of California, San Francisco, CA), Sox10 (1:100; Abcam, Cambridge, MA), NG2 (1:500; from Dr. William Stallcup; La Jolla, CA), PDGFαR (1:1000; R7 polyclonal antibody; from Carl Hendrik‐Heldin; Uppsala, Sweden), and GFAP (1:20; DAKO, Carpinteria, CA) were used to identify oligodendrocyte lineage cells (Olig2, Sox10), OP cells (NG2, PDGFαR), and astrocytes (GFAP). As previously detailed (Murtie et al., 2005a), myelin was immunostained with monoclonal antibody 8‐18C5, which recognizes myelin oligodendrocyte glycoprotein (MOG; hybridoma cells from Dr. Minetta Gardinier; University of Iowa, Iowa City, IA).
In tissue cultures, primary antibodies for nestin (1:200; Chemicon, Temecula, CA), A2B5 (1:500; R&D Systems, Minneapolis, MN), or O1 (1:20; IgM hybridoma supernatant) were utilized to identify neural stem cells, OP cells, and mature oligodendrocytes, respectively. Evolving apoptosis was detected by immunostaining with an antibody against cleaved caspase‐3 (1:100; Cell Signaling Technology, Danvers, MA). The nuclear stain DAPI (1:500; Sigma, St. Louis, MO) was added prior to mounting. Appropriate secondary antibodies (Jackson Immunoresearch, West Grove, PA) to detect each primary antibody were tested for specificity in multilabel immunofluorescence protocols.
Retrovirus Production
The 1.1 kb murine Msi1 wild‐type (MsiWT) and control mutated Msi1 sequences (plasmids from Dr. Hideyuki Okano) were subcloned in pBluescriptII SK (Stratagene, La Jolla, CA) and then into the retroviral vector, pMXs‐IRES‐EGFP (from Dr. Toshio Kitamura; University of Tokyo, Tokyo, Japan; Kitamura et al., 2003). In this pMXs‐IRES‐GFP replication‐incompetent retroviral plasmid, the sequence encoding MsiWT or control sequence was followed by an IRES element and GFP reporter. The control retroviral vector was generated with a mutated Msi1 sequence that coded for a transcript which lacked RNA binding activity (Imai et al., 2001). Viral stocks were prepared and titered as previously reported (Murtie et al., 2005a; Zhou et al., 2006).
Retroviral Transduction of Msi1 in OP Cells: Differentiation Assay
Retroviral infection of OP cells was performed as previously described (Nielsen et al., 2004; Zhou et al., 2006). Enriched cultures of OP cells were plated in 24‐well plates in defined medium supplemented with PDGF and FGF2 to induce proliferation and prevent differentiation since only actively dividing cells will express retroviral genes after infection. In similarly prepared cultures, the OP population immunolabeled with A2B5 represented ˜77% of the cells with the remainder being mainly mature oligodendrocytes and microglia (Armstrong et al., 1995). One day after plating, the cells were infected by incubation for 6 h with either MsiWT or control retrovirus (3,000 colony forming units (CFU)/well). The cells were maintained for 2 days in defined medium with PDGF and FGF2, and then the cultures were refed defined medium without PDGF or FGF2 for 3 days to allow differentiation. The cells were fixed and immunostained with O1 as detailed above. The proportion of infected mature oligodendrocytes was quantified as the number of GFP+ cells that were double labeled for O1.
Retroviral Tansduction of Msi1 in OP Cells: Proliferation Assay
OP cells were infected as detailed earlier. After infection, cells were grown for 4 days in defined medium supplemented with PDGF and FGF2. BrdU (0.2 μM; Sigma, St. Louis, MO) was added during the final 20 h. BrdU incorporation was detected by immunostaining in combination with GFP immunostaining, as detailed previously (Nielsen et al., 2004). Proliferation of the infected OP cells was quantified as the percentage of GFP+ cells that had incorporated BrdU.
Retroviral Transduction of Msi1 in OP Cells: Apoptosis Assay
OP cultures were infected as detailed above. After infection, cells were maintained for 3 days in defined medium with PDGF and FGF2, and then the cultures were refed either defined medium or cystine‐free defined medium (prepared as above using cystine‐free DMEM from Invitrogen, Carlsbad, CA) supplemented with PDGF and FGF2. Cystine‐free medium induces OP cell death by intracellular glutathione depletion (Back et al., 1998). Eighteen hours later, the cells were fixed and immunostained for cleaved caspase‐3, as described above. Evolving apoptosis of the infected OP cells was assessed as the percentage of GFP+ OP cells that were caspase‐3 immunostained.
Retrovirus Injection and Identification of Infected Cell Types
Stereotaxic surgery and retrovirus injection was performed on P7 male C57Bl/6 mice as previously described (Murtie et al., 2005a). MsiWT or control retrovirus (˜100 CFU in 1 μl; see above) was injected into the L5 dorsal funiculus.
At P28, the mice were perfused and tissue sections were immunostained with either CC1 antibody, to identify oligodendrocytes, or NG2 and PDGFαR antibodies, to identify OP cells (Murtie et al., 2005a, b). The proportion of infected cells that became oligodendrocytes was quantified as the number of GFP+ CC1+ cells among the number of GFP+ cells counted. The proportion of infected cells that were OP cells was quantified as the number of GFP+ cells immunolabeled by either NG2 alone or by NG2 and PDGFαR among the number of GFP+ cells counted. All GFP cells were counted, with an average of 42 cells counted/animal.
RNA Interference Knockdown of Msi1 Expression
Short interfering RNA (siRNA) was used to knockdown Msi1 in cultured OP cells. A short hairpin RNA construct containing a 19 nucleotide (nt) sense sequence (5′ TGGTGGAATGCAAGAAAGC 3′) and a 19 nt antisense sequence (5′ GCTTTCTTGCATTCCACCA 3′) joined by a 9 nt hairpin loop was designed to target Msi1. A scrambled 19 nt siRNA sequence was used to generate a control fragment (control siRNA). To construct the siRNA expression vector, complementary 67 bp oligonucleotides (including both the sense and antisense sequences of the corresponding 19 bp siRNA, the hairpin‐forming sequence, and the adapter sequences for cloning) were annealed to form a double‐stranded DNA fragment. The fragment was ligated into pSIREN‐RetroQ‐ZsGreen vector (BD Biosciences, San Jose, CA), a replication‐incompetent retroviral plasmid containing ZsGreen fluorescent reporter sequence. The pSIREN‐RetroQ‐ZsGreen vector contains multiple promoters, which allows Msi1 siRNA and the ZsGreen reporter to be expressed independently. Retrovirus was generated in GP2‐293 packaging cells, as described earlier.
Since astrocytes express Msi1 (Sakakibara and Okano, 1997), the efficacy of siRNA knockdown of gene expression was verified using quantitative RT‐PCR of Msi1 mRNA abundance after infection of the retroviral plasmid into astrocytes. The astrocyte cultures were prepared from brains of P2 rats as previously described (see above; Armstrong, 1998), and then the cultures were infected with Msi1 siRNA or control siRNA. RNA was isolated with the RNAqueous‐4PCR kit (Ambion, Austin, TX) at 24, 48, and 72 h after infection and reverse transcribed using random hexamer primers. Murine Msi1 primer and probe sets were obtained from PE Applied Biosystems (Foster City, CA) for kinetic quantitative PCR using the ABI 7500 Real‐Time PCR System (PE Applied Biosystems; Foster City, CA). The input RNA values and RT reaction efficiency were normalized by measuring endogenous 18S rRNA for each sample in parallel. The results were quantified as Msi1 siRNA infected cells compared to cells infected with control siRNA.
OP cultures were infected with Msi1 siRNA or control siRNA and then maintained with or without PDGF and FGF2 for 24, 48, or 72 h. The cultures were fixed and immunostained for cleaved caspase‐3 as detailed earlier. Evolving apoptosis of the infected OP cells was assessed as the percentage of GFP+ OP cells that were immunolabeled for cleaved caspase‐3.
MHV Model of Spinal Cord Demyelination
Intracranial infection with MHV coronavirus strain A59 in C57Bl/6 mice results in focal areas of demyelination throughout the spinal cord over a 1–3 week period followed by extensive remyelination within 8 weeks after injection (Armstrong et al., 1990). As previously described (Armstrong et al., 2005; Redwine and Armstrong, 1998), 4‐week‐old female C57Bl/6 mice were anesthetized and injected intracranially with MHV strain A59 or PBS vehicle. The mice infected with MHV developed limb paresis and paralysis over subsequent weeks, but at ˜4 weeks post infection (wpi), the mice began to recover motor function with evidence of repopulation of the lesions by early OP cells (Redwine and Armstrong, 1998). For this study, transverse spinal cord sections from mice sacrificed at 2, 4, and 8 wpi were immunostained with Msi1, Olig2, and PDGFαR antibodies as described earlier.
Imaging and Statistical Analysis
Images of immunostaining and in situ hybridization were acquired and prepared as panels as previously detailed (Murtie et al., 2005b). For cell density quantification in postnatal brain, cells were counted in 325 μm wide regions of the corpus callosum (CC) to compare the medial region (centered on the midline) with a more lateral region (centered under the peak of the cingulum). For cell density quantification in transverse spinal cord sections of postnatal spinal cord and MHV infected mice, each dorsal funiculus area was measured and all labeled cells within this region were counted to determine cells per square millimeter. For each condition, at least three mice were analyzed with at least three sections included for each mouse. To distinguish significant differences between groups, unpaired Student's t tests were used for single time point comparisons and one‐way analysis of variance (ANOVA with Tukey's post hoc test) was used to compare control mice and multiple MHV disease time points.
For retroviral OP infections, all in vitro quantification was based on data combined from at least 3 independent preparations of cells from separate litters of animals. At least 100 cells/well were counted with three or more wells counted per experiment and at least 3 experiments assessed with each retrovirus and condition. The quantification for in vivo retroviral infections was based on data obtained from 7 mice injected with MsiWT retrovirus and 5 mice injected with control retrovirus. The χ2 test with the Mantel‐Haenzel subgroup analysis was used to compare percentages of retrovirally labeled cells with a specific phenotype (i.e., immunostained for O1, BrdU, CC1, or NG2/PDGFαR). All values are presented as means with standard error of the mean or proportion. A P‐value <0.05 was considered significant.
RESULTS
Msi1 Expression in OP Cells in Postnatal Brain
Msi1 expression was characterized in developing oligodendrocyte lineage cells during the postnatal period of oligodendrogenesis associated with myelination. In situ hybridization with the Msi1 antisense riboprobe on sections of P7 mouse brain revealed high levels of Msi1 mRNA transcripts in cells of the SVZ (Figs. 1A,B). Neural stem cells of the SVZ actively generate OP cells that migrate into the CC at this time point in development (Kakita and Goldman, 1999; Levison et al., 1993). In addition, the developing CC adjacent to the SVZ contained a high density of cells expressing Msi1 (Fig. 1C).
Figure 1.
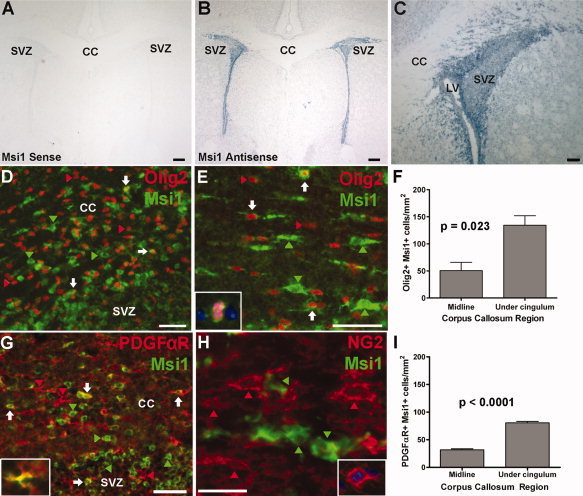
Msi1 expression in oligodendrocyte lineage cells in the postnatal mouse corpus callosum (CC). Msi1 in situ hybridization (panels A–C) and immunohistochemistry (green; panels D, E, G, H) in coronal sections of postnatal day 7 (P7) brain with Olig2 (red; D, E), PDGFαR (red; G), NG2 (red; H) and DAPI (blue; insets E, H). A–C: In situ hybridization with Msi1 sense riboprobe (A), note absence of cell‐specific staining, and antisense riboprobe (B, C), note intense staining in SVZ, with enlargement (C) showing Msi1 mRNA transcripts in individual cells of the SVZ and adjacent CC. D: CC adjacent to SVZ contains double immunolabeled Msi1+ Olig2+ cells (white arrows), Msi1+ cells that do not express Olig2 (green arrowheads), and Olig2+ Msi1‐ cells (red arrowheads). E: Enlargement of CC, showing elongated cell bodies of Msi1+ Olig2+ cells (white arrows). Larger Msi1+ Olig2‐ cells show characteristics of astrocytes (green arrowheads) in contrast to smaller, round Olig2+ Msi1‐ cells (red arrowheads). Inset—Enlargement of pair of Msi1+ Olig2+ cells in CC (see Supplemental Fig. 1). Note small, round cell bodies. F: Quantification of Msi1+ Olig2+ cells in P7 CC. There were significantly more double‐labeled cells in the CC near the SVZ (i.e., under the cingulum) than in the midline region of the CC (P = 0.023) G: SVZ/CC junction contains a subpopulation of Msi1+ PDGFαR+ cells (white arrows) among many Msi1+ PDGFαR‐ cells (green arrowheads) and PDGFαR+ Msi1‐ OP cells (red arrowheads). Inset—Enlargement of PDGFαR+ cell with the soma showing Msi1 expression. H: CC contains many NG2+ Msi1‐ OP cells (red arrowheads) and Msi1+ NG2‐ cells (green arrowheads). NG2 immunolabeling did not detect a significant population of cells double labeled with Msi1, in contrast to PDGFαR immunolabeling. Inset—Enlargement of NG2+ OP cell undergoing mitosis in CC. I: Quantification of Msi1+ PDGFαR+ cells in P7 CC. There were significantly more double‐labeled cells in the CC near the SVZ than in the midline region of the CC (P < 0.0001). CC, corpus callosum; LV, lateral ventricle; SVZ, subventricular zone. Scale bars = 250 μm (A, B), 100 μm (C, D), 50 μm (E, G), 25 μm (H). Values shown are the mean ± standard error derived from counting at least 3 sections from each of 3 mice.
Immunohistochemistry for Msi1 combined with detection of cell type‐specific antigenic markers identified the cell types in the developing CC that expressed Msi1 in P7 mouse brain sections (Figs. 1D–I). Olig2 is present in nuclei at all stages of the oligodendrocyte lineage and in a small subset of progenitor cells in the postnatal SVZ (Ligon et al., 2006; Menn et al., 2006). Immunostaining for Msi1 and Olig2 showed a high density of Msi1+ cells in SVZ, with a subset of Msi1+ cells also immunoreactive for Olig2 (Fig. 1D). Similar populations were observed in the subcallosal zone (SCZ), an extensive paraventricular region located between the hippocampus and CC that gives rise to oligodendrocytes postnatally (Seri et al., 2006)(Supplemental Fig. 1). The CC also contained Msi1+ Olig2+ cells (Figs. 1D–E). The Msi1+ Olig2+ cells in the CC adjacent to the SVZ or SCZ were often small, round cell bodies with rudimentary processes (Fig. 1D), similar to the cells within the SVZ. The Msi1+ Olig2+ double‐labeled cells found elsewhere in the CC usually had elongated cell bodies with processes (Fig. 1E), although some small, round Msi1+ Olig2+ cells were also detected and usually appeared in pairs suggesting recent cell division (Fig. 1E, inset). In addition to these morphological indications that Msi1+ cells reflected an immature cell stage among the Olig2+ population, the preferential localization of Msi1+ Olig2+ cells near germinal zones supported this interpretation. The density of Msi1+ Olig2+ double‐labeled cells was significantly higher in the regions of the CC near the SVZ (lateral CC, under the peaks of the cingulum; 134.30 ± 17.64 cells/mm2) than CC regions away from the SVZ (medial CC; 50.57 ± 15.27 cells/mm2, P = 0.023; Fig. 1F). There were no significant differences between CC regions in the density of single‐labeled Msi1‐expressing cells (Msi1+ Olig2‐ cells, 658.60 ± 66.39 cells/mm2 under peaks of cingulum compared to 543.70 ± 120.10 cells/mm2 in midline, P = 0.4495) or Olig2‐expressing cells (Msi1‐Olig2+ cells, 1032.00 ± 11.34 cells/mm2 under peaks of cingulum compared to 956.30 ± 178.90 cells/mm2 in midline, P = 0.6930).
Msi1 can be expressed in immature and differentiated astrocytes and Olig2 may be important in SVZ cell generation of astrocytes as well as oligodendrocytes (Marshall et al., 2005; Sakakibara and Okano, 1997). Therefore, identification of Msi1+ cells with Olig2 may not definitively identify cells committed to the oligodendrocyte lineage. However, the Olig2+ cells that were double labeled for Msi1 in P7 brain sections did not express detectableglial fibrillary acidic protein (GFAP), a marker of astrocytes (Supplemental Fig. 2). Furthermore, immunostaining for Sox10, a transcription factor restricted to oligodendrocytes within the CNS (Stolt et al., 2002), was seen in a subset of Msi1+ cells in the postnatal CC adjacent to the SVZ (Supplemental Fig. 3), providing further support of Msi1 expression associated with oligodendrocyte development.
To more specifically assess Msi1 expression in OP cells, coimmunostaining was performed for platelet‐derived growth factor alpha receptor (PDGFαR; Menn et al., 2006; Nishiyama et al., 1996). A subset of Msi1+ cells in the P7 CC coexpressed PDGFαR (Fig. 1G). Similar to the findings with Olig2, the density of Msi1+ PDGFαR + cells was significantly higher in the lateral CC near the SVZ (80.57 ± 2.40 cells/mm2 under the peaks of the cingulum) than in the medial CC (31.70 ± 1.96 cells/mm2, P < 0.0001; Fig. 1I). As above, there was no significant difference in the density of single‐labeled Msi1 expressing cells (i.e. Msi1+ PDGFαR‐) between the two CC regions (473.90 ± 36.46 cells/mm2 under peaks of cingulum compared to 413.10 ± 18.13 cells/mm2 in midline, P = 0.21). As expected in correlation with oligodendrogenesis from cells of the SVZ, the lateral CC region adjacent to the SVZ contained significantly more PDGFαR‐expressing cells (1129.00 ± 10.60 cells/mm2 under the peaks of the cingulum) than the medial CC (993.10 ± 45.69 cells/mm2, P = 0.0444). Among the overall OP population, the Msi1+ PDGFαR+ cells appear to be a subpopulation preferentially localized in the white matter near the SVZ. The current focus on early transitional cells of the oligodendrocyte lineage may explain our findings relative to a previous study that did not observe colocalization of Msi in PDGFαR+ OP cells (Sakakibara and Okano, 1997). The correlation of Msi1 with a very early stage of the lineage is also supported by a lack of Msi1 colocalization in NG2+ OP cells in both the previous study (Sakakibara and Okano, 1997) and current work in P7 mouse CC (Fig. 1H).
Msi1 Expression in OP Cells in Postnatal Spinal Cord
The above analysis of CC facilitated the correlation of Msi1 expression in OP cells relative to the SVZ, a well characterized germinal zone of the postnatal CNS. We next examined postnatal spinal cord to extend the analysis to a distinct CNS region and temporally correlate Msi1 expression with a well characterized time course of active myelination. At P7 within the lumbar dorsal funiculus, myelination of the fasciculus cuneatus is nearing completion while myelination of the more medial fasciculus gracilis is ongoing and the corticospinal tract is not yet myelinated (Fig. 2A; Murtie et al., 2005a). Similar to the results in the developing CC, a subset of Msi1+ cells in the dorsal funiculus was immunolabeled for Olig2 (Fig. 2B) or PDGFαR (Fig. 2C). The density of Msi1+ PDGFαR+ cells was even higher in the dorsal funiculus (216.30 ± 31.13 cells/mm2) than in the CC (see above). The density of Msi1+ PDGFαR+ cells did not differ significantly between myelinated and unmyelinated regions of the dorsal funiculus (211.20 ± 37.89 cells/mm2 in myelinated region compared to 244.40 ± 17.30 cells/mm2 in unmyelinated region, P = 0.47). These findings are consistent with Msi1 expression at an early stage of the lineage during oligodendrogenesis in the spinal cord.
Figure 2.
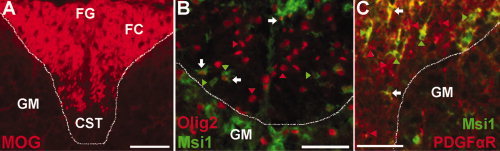
Msi1 expression in the mouse spinal cord during active myelination. Transverse sections through the dorsal funiculus white matter of lumbar spinal cords from P7 mice. A dashed line demarcates the white matter of the dorsal funiculus from the adjacent gray matter (GM) of the dorsal horns. A: MOG immunolabeling illustrates ongoing myelination within the tracts of the dorsal funiculus. The fasciculus cuneatus (FC) has relatively extensive MOG immunolabeling while the area of the fasciculus gracilis (FG) is incompletely immunolabeled and most of the ventral area corresponding with the corticospinal tract (CST) has not yet acquired myelin immunolabeling. B: Immunohistochemistry for Msi1 expression (green) with Olig2 (red), as a marker of oligodendrocyte lineage cells, reveals double labeled Msi1+ Olig2+ cells (B, white arrows) among many Msi1+ Olig2‐ cells (green arrowheads) and Msi1‐ Olig2+ cells (red arrowheads). C: Immunohistochemistry for Msi1 expression (green) and PDGFαR (red), as a marker of OP cells, demonstrates a subset of Msi1+ PDGFαR+ cells (C, white arrows) among many Msi1+ PDGFαR‐ cells (green arrowheads) and Msi1‐ PDGFαR+ cells (red arrowheads). Scale bars = 50 μm.
Msi1 Expression in Oligodendrocyte Lineage Cells In Vitro
Msi1 expression was examined in cultured oligodendrocyte lineage cells to extend our in vivo results by taking advantage of well characterized antigenic markers and morphological characteristics for each cell stage in vitro and to facilitate subsequent functional analysis. OP cell cultures were fixed and stained at various time points after plating to examine progressive stages of differentiation within the oligodendrocyte lineage (see Experimental procedures section). Early stage, nestin+ pre‐OP cells showed strong Msi1 expression (Fig. 3A). Msi1 expression continued as the cells differentiated into A2B5+ OP cells (Fig. 3B). Msi1 expression was dramatically attenuated as OP cells differentiated into mature oligodendrocytes (identified by O1 immunoreactivity; Fig. 3C).
Figure 3.
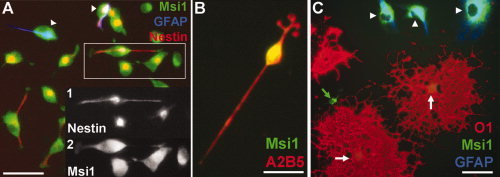
Msi1 expression in cultured oligodendrocyte lineage cells. Immunocytochemistry performed on secondary enriched OP cell cultures prepared from brains of neonatal rat pups. A: Cells fixed 2 h after plating, immunostained for nestin (red), Msi1 (green), and GFAP (blue). Neural stem cells or pre‐OP cells (nestin+ Msi1+ GFAP‐; overlap of red and green appears yellow) are beginning to extend processes. White arrowheads indicate astrocytes (Msi1+ GFAP+). Inset—Black and white images of boxed area showing nestin (inset 1) and Msi1 (inset 2). B: Bipolar OP in culture maintained in defined medium with PDGF and FGF2 for 3 days, immunostained for A2B5 (red) and Msi1 (green; overlap appears yellow). C: Cells in culture maintained in defined medium without mitogens for 3 days, immunostained for O1 (red), Msi1 (green), and GFAP (blue). Mature oligodendrocytes (O1+; white arrows) have well‐developed processes. Green arrow shows Msi1+ O1‐ GFAP‐ cell. White arrowheads indicate a group of contaminating astrocytes (Msi1+ GFAP+) in this field which was selected to show relative differences in Msi1 immunoreactivity among these cell types. Scale bars = 50 μm (A, B), 25 μm (C).
Msi1 Transduction Inhibits OP Differentiation In Vitro
In neural stem cells, regulation of differentiation appears to be a critical role of Msi1. To test the function of Msi1 in OP cells, we first assessed a role in differentiation within the oligodendrocyte lineage. OP cell cultures were infected with replication‐incompetent retrovirus expressing Msi1 followed by an internal ribosome entry site (IRES) and green fluorescent protein (GFP) as a reporter (Fig. 4A,B). Retroviral transduction of the wild‐type virus (MsiWT) significantly reduced the proportion of GFP+ cells that differentiated into oligodendrocytes (16.87% ± 0.72%) compared to infection with the control retrovirus, which contained a mutant Msi1 sequence that lacked RNA binding activity (27.42% ± 1.58%; P value <0.0001; Fig. 4C). The percentage of mature oligodendrocytes seen in OP cultures infected with the control retrovirus was similar to that seen in infection of OP cultures with the empty pMX retroviral vector (Zhou et al., 2006), demonstrating that infection with the retroviral vector itself or the control retrovirus containing mutated Msi1 does not alter differentiation. These results show that Msi1 transduction inhibits OP differentiation into mature oligodendrocytes in vitro.
Figure 4.
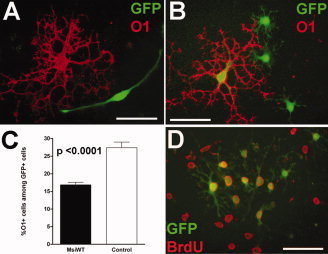
Msi1 transduction inhibits differentiation of cultured OP cells. OP cells were infected with a replication‐incompetent retroviral vector containing the Msi1 sequence (MsiWT) followed by an IRES element and GFP as a reporter. The IRES element allows Msi1 and GFP to be transcribed as a single transcript that is then translated as two separate proteins. The control retrovirus contained a mutant Msi1 sequence that lacked RNA binding capacity. Cultures were analyzed for differentiation, based on O1 immunolabeling (A–C), or proliferation, estimated from BrdU incorporation (D). A: Bipolar OP infected with MsiWT virus (GFP+, green) and noninfected mature oligodendrocyte (O1+, red). B: MsiWT infection of three OP cells (GFP+) and one mature oligodendrocyte (O1+ GFP+). C: Quantification of the percentage of O1+ oligodendrocytes among GFP+ cells in cultures infected with MsiWT (black bar) or control (white bar) retrovirus. Infection with MsiWT significantly reduced the proportion of cells that differentiated into mature oligodendrocytes compared to infection with the control virus (P value <0.0001; values shown are the mean ± standard error derived from 3 independent experiments with at least 300 cells counted for each retrovirus during each experiment). D: Cells infected with the control retrovirus, showing multiple GFP+ (green) OP cells that are actively proliferating (BrdU+, red). Scale bars = 100 μm.
Msi1 Transduction Inhibits OP Differentiation In Vivo
To determine if Msi1 can regulate OP differentiation in the context of physiologically appropriate developmental signals, MsiWT and control retroviruses were each injected into the lumbar dorsal funiculus of P7 mouse pups to target actively proliferating OP cells in the developing white matter. The mice were sacrificed at P28, which is after the period of active myelination. Spinal cord from the first mouse injected with each retrovirus was longitudinally sectioned on a vibratome to ensure successful infection of oligodendrocyte lineage cells and expression of GFP (Figs. 5A,B). For subsequent mice, alternate longitudinal spinal cord sections were immunostained with either CC1 antibody, to identify mature oligodendrocytes (Fuss et al., 2000) (Figs. 5A′,B′), or NG2 antibody to identify OP cells (Nishiyama et al., 1996) (Figs. 5A″,B″). Animals injected with MsiWT retrovirus had a significant reduction in the proportion of GFP+ cells that differentiated into mature oligodendrocytes (39.14% ± 3.80%) compared to animals injected with control retrovirus (67.49% ± 1.69%, P = 0.0026; Fig. 5C). Conversely, mice injected with MsiWT retrovirus had a significantly higher proportion of GFP+ cells that were OP cells, identified as GFP+ NG2+ cells, in the dorsal funiculus (63.75% ± 1.58%) compared to animals injected with the control virus (30.18% ± 1.54%, P < 0.0001; Fig. 5D). To further analyze the OP population, sections were double immunostained with NG2 and PDGFαR antibodies. The MsiWT‐injected animals had a significantly larger proportion of GFP+ cells that were OP cells with immunoreactivity for both NG2 and PDGFαR (21.94% ± 3.30%) compared to the control‐injected animals (12.06% ± 1.11%, P = 0.0002; images not shown). Taken together, these results show that MsiWT transduction can function in the context of a myelinating white matter tract to inhibit OP differentiation. In addition, these in vivo results indicate that Msi1 shifts the proportion of OP cells that differentiate into oligodendrocytes but does not induce an alternate OP fate; although NG2 and CC1 cells were calculated from separately immunostained sections, the combined proportions of NG2 and CC1 cells account for ˜100% of the GFP+ cells (102.89% ± 5.38% for MsiWT virus and 97.67% ± 3.23% for control virus infections).
Figure 5.
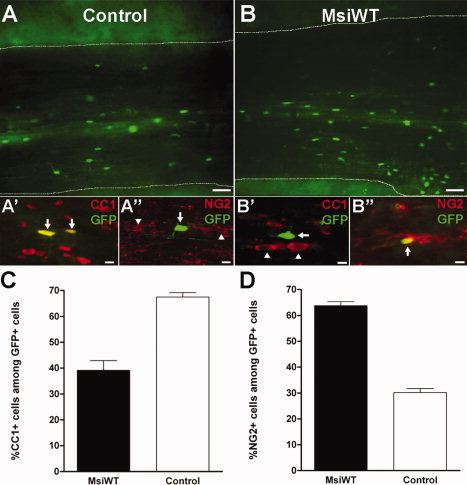
Msi1 transduction inhibits OP differentiation in vivo. The MsiWT and control retroviruses (see Fig. 4) were injected into the dorsal funiculus of P7 mice at the L5 spinal cord level to assess the effect of Msi1 transduction on OP differentiation in the environment of a myelinating fiber tract. A, B: Vibratome sections (100 μm thick) illustrating infection of oligodendrocyte lineage cells and expression of GFP with control (A, A′, A″) and MsiWT (B, B′, B″) retroviruses. The dashed white lines outline the margins of the dorsal funiculus. Adjacent cryostat sections (15 μm thick) were immunostained with either CC1 to identify mature oligodendrocytes (red, A′, B″) or NG2 to identify OP cells (red, A″, B″) among retrovirally labeled cells expressing GFP (green; note that overlap of green and red appears yellow). A′, A″: Examples of mature oligodendrocytes infected with control virus (GFP+) and immunostained for CC1+ (A′, arrows) but not for NG2 (A″, arrow), in contrast to examples of NG2+ OP cells (A″, arrowheads). B′, B″: Examples of OP cells infected with MsiWT virus (GFP+) immunostained for NG2 (B″, arrow) but not for CC1 (B′, arrow), in contrast to several noninfected oligodendrocytes (B′ arrowheads). C: Quantification of the percentage of CC1+ oligodendrocytes among GFP+ cells in the dorsal funiculi of animals infected with MsiWT (black bar) or control (white bar) retrovirus. Infection with MsiWT retrovirus significantly reduced the proportion of cells that differentiated into mature oligodendrocytes compared to infection with the control virus (P = 0.0026). D: Quantification of the percentage of NG2+ OP cells among GFP+ cells in the dorsal funiculi of animals infected with MsiWT (black bar) or control (white bar). Infection with MsiWT significantly increased the proportion of immature cells compared to infection with control retrovirus (P < 0.0001). Values shown are the mean ± standard error of the proportion as derived from 7 mice injected with MsiWT and 5 mice injected with control retrovirus. Scale bars = 50 μm (A, B), 10 μm (A′, A″, B′, B″).
Msi1 Transduction Does Not Alter OP Proliferation In Vitro
To test whether Msi1 transduction modulated OP proliferation, OP cells were infected with MsiWT or control retroviruses and then maintained in defined medium with PDGF and FGF2. These conditions prevented OP differentiation into postmitotic oligodendrocytes and stimulated sufficient OP proliferation to detect positive or negative modulation by Msi1WT transduction. Bromodeoxyuridine (BrdU) was added during the final 20 h of culture to label cells actively synthesizing DNA, indicative of cell proliferation, and BrdU incorporation was detected by immunostaining (GFP+ BrdU+ cells in Fig. 4D). In the cultures infected with MsiWT virus, 36.31% ± 1.06% of the GFP+ cells were BrdU+. A similar result was obtained with the control retrovirus (35.33% ± 1.22% of the GFP+ cells were BrdU+; P‐value = 0.52). These findings indicate that Msi1 transduction does not impact OP proliferation.
Msi1 Transduction Protects Against OP Cell Death In Vitro
To test for an effect of retroviral Msi1 transduction on OP survival, OP cells were infected with MsiWT and control retroviruses, grown for 3 days, and then immunostained for cleaved caspase‐3 as an indicator of evolving apoptosis (see Fig. 6). MsiWT transduction significantly reduced the proportion of GFP+ cells that were cleaved caspase‐3+ (5.44% ± 0.13%) compared to transduction of the control retrovirus (9.90% ± 1.23%; P‐value <0.0001; Fig. 6C). Cells expressing cleaved caspase‐3 often showed initial signs of nuclear condensation with DAPI staining (data not shown). To further challenge the protective effects of Msi1 transduction, OP cultures were transferred to cystine‐free medium, which leads to glutathione depletion and induces cell death of immature oligodendrocyte lineage cells (Back et al., 1998). In cultures maintained in cystine‐free medium (Fig. 6C, Cys‐), transduction with MsiWT significantly reduced the proportion of GFP+ cells that were cleaved caspase‐3+ (5.81% ± 0.18%) compared to the control retrovirus (17.38% ± 1.65%; P value <0.0001). These results show that Msi1 is protective against OP cell death in vitro in the presence of oxidative stress. Caspase‐3 independent cell death pathways were not evaluated, so the significant effect of Msi1 in OP cell survival may actually be underestimated by these results.
Figure 6.
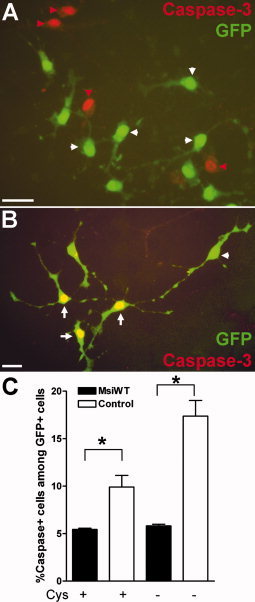
Msi1 transduction promotes OP survival in vitro. OP cells were infected with MsiWT or control retrovirus (see Fig. 4) and grown in defined medium with or without cystine for the final 18 h. Cystine‐free medium induces OP cell death detected by cleaved caspase‐3 immunolabeling (red in A, B). A: Examples of OP cells grown in cystine‐free medium following infection with MsiWT retrovirus (GFP+ green cells, white arrowheads) with evolving apoptosis detected by immunoreactivity for activated caspase‐3 among noninfected cells (A, red arrowheads). B: Examples of OP cells grown in cystine‐free medium followed by infection with control retrovirus (GFP+ green cells) and showing immunoreactivity for activated caspase‐3 (arrows; overlap of green and red appears yellow). White arrowhead indicates an example of an infected OP cell that is not immunolabeled for caspase‐3. C: Quantification of the percentage of activated caspase‐3+ cells among GFP+ cells in cultures infected with MsiWT (black bar) or control (white bar) retrovirus, maintained in cystine‐containing (Cys+) or cystine‐free (Cys‐) medium. Infection with MsiWT significantly reduced the proportion of cells that were immunolabeled for cleaved caspase‐3 compared to infection with the control virus in both conditions (*P value <0.0001; values shown are the mean ± standard error derived from three independent experiments with at least 300 cells counted for each retrovirus during each experiment). Scale bars = 25 μm.
Msi1 Expression is Critical for OP Survival In Vitro
To further test the function of Msi1 in oligodendrocyte lineage cells, we used RNA interference to knockdown endogenous Msi1 expression in OP cells. The Msi1 construct for RNA interference was expressed from a replication‐incompetent retroviral plasmid with a distinct promoter driving expression of the ZsGreen reporter. A control siRNA retrovirus containing a scrambled nucleotide sequence was also generated. The efficacy of siRNA knockdown was first verified using quantitative RT‐PCR of Msi1 mRNA levels after infection of the retroviral plasmid into astrocytes, which are known to maintain expression of Msi1 upon differentiation (Sakakibara and Okano, 1997) in contrast to oligodendrocyte lineage cells (see above). Quantitative RT‐PCR analysis of Msi1 mRNA transcript abundance across a time course of infections resulted in knockdown of 25% at 24 h, 52% at 48 h, and 87% at 72 h.
Once the efficacy of siRNA knockdown was verified, OP cultures were infected with Msi1 siRNA and control siRNA retroviruses. Initial infections with Msi1 siRNA resulted in dramatic OP cell death, precluding analysis of differentiation and proliferation. A significantly larger percentage of infected cells (ZsGreen+) exhibited cleaved caspase‐3 immunoreactivity at 24 and 48 h after infection with Msi1 siRNA compared to cultures infected with the scrambled control siRNA segment (see Fig. 7). This result was not altered significantly by the presence of PDGF and FGF2. Seventy‐two hours postinfection, few ZsGreen+ cells were present in the cultures infected with Msi1 siRNA, indicating that most OP cells infected with Msi1 siRNA had undergone apoptosis. This degree of cell death was not seen in OP cultures infected with the control siRNA construct in the same retroviral vector, in OP cultures infected with other siRNA constructs that resulted in similar extents of knockdown of different mRNA targets (Zhou et al., 2006), nor in Msi1 siRNA infections of astrocytes (data not shown). These results suggest that Msi1 expression is critical for OP survival in vitro.
Figure 7.
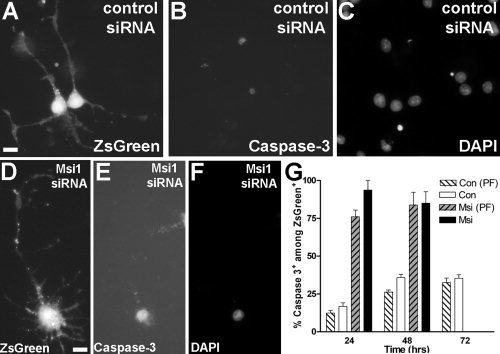
Msi1 expression is critical for OP survival in vitro. To knockdown Msi1, OP cell cultures were infected with a replication‐incompetent retroviral vector containing a siRNA fragment targeting Msi1 and the ZsGreen reporter. A scrambled nucleotide sequence in the same siRNA cassette was used to generate control retrovirus. A–C: Cultured OP cells infected with control siRNA, fixed and immunostained for cleaved caspase‐3 (panel B) and DAPI (panel C) 48 h after infection. The two infected OP cells (ZsGreen+; panel A) are not immunolabeled with caspase‐3. D–F: Cultured OP cell infected with Msi1 siRNA (ZsGreen+, panel D), fixed and immunostained for caspase‐3 (panel E) and DAPI (panel F) 48 h after infection. In addition to cleaved caspase‐3 immunoreactivity (E), this cell has a swollen soma (D) and condensed chromatin (F) indicative of ongoing cell death. G: Quantification of cleaved caspase‐3 detection among retrovirally labeled ZsGreen cells in OP cultures. Cells were infected with Msi1 siRNA (gray bars) or scrambled control siRNA sequence (white bars) and maintained in the presence (hatched bars) or absence (solid bars) of PDGF and FGF2. In OP cultures infected with Msi1 siRNA, a significantly larger percentage of infected cells (ZsGreen+) exhibited caspase‐3 immunoreactivity at 24 and 48 h after infection compared to cultures infected with the control siRNA retrovirus. Seventy‐two hours postinfection, few ZsGreen+ cells remained in the cultures infected with Msi1 siRNA. All GFP+ cells per well were counted and values shown are the mean ± standard error of the proportion as derived from at least 3 wells/experiment and with 3 experiments assessed for each retrovirus. Scale bars = 10 μm.
Msi1 Expression During Remyelination of the Spinal Cord After MHV‐Induced Demyelination
To determine whether Msi1 expression in OP cells may be relevant to repair phases in demyelinating disease, Msi1 expression was characterized in focal areas of spinal cord demyelination induced by intracranial infection with murine hepatitis virus (MHV) in C57Bl/6 mice. This MHV infection model results in demyelination and loss of motor function over ˜2–3 weeks post infection (wpi) followed by a phase of spontaneous remyelination beginning around 4 wpi (Redwine and Armstrong, 1998). Immunostaining for Msi1 and Olig2 in lesioned spinal cord (Figs. 8A–D) showed a significantly higher density of Msi1+ Olig2+ cells in the dorsal funiculus at 4 wpi (179.80 ± 24.21 cells/mm2; Fig. 8E) compared to age‐matched adult PBS‐injected control mice (29.80 ± 1.29 cells/mm2; P < 0.001). Some of the Msi1+ cells also coexpressed PDGFαR (Figs. 8F–F″), consistent with Msi1 expression in early OP cells of the adult CNS during the early remyelination response.
Figure 8.
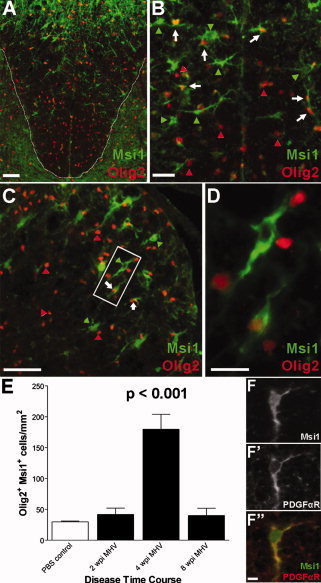
Msi1 expression during remyelination of the spinal cord after MHV‐induced demyelination. MHV infection in C57Bl/6 mice results in focal areas of demyelination throughout the spinal cord followed by a phase of spontaneous remyelination. Mice injected with MHV or PBS vehicle were perfused at 2 weeks post infection (wpi; active demyelination), at 4 wpi (early remyelination), and at 8 wpi (advanced remyelination). Immunohistochemistry for Msi1 (green) and Olig2 (red) at 4 wpi showed upregulation of Msi1 expression in lesioned white matter (panels A–D). A: Low power image showing the dorsal funiculus (outlined by dashed white line). B: Higher power image of the dorsal funiculus containing the lesion border demonstrates the presence of a subpopulation of Msi1+ Olig2+ cells (white arrows) among the many Olig2+ Msi‐ cells (red arrowheads) and Msi1+ Olig2‐ cells (green arrowheads). C: Similar populations of cells as in B are noted in an example of a lesion area in the lateral funiculus. D: Enlargement of boxed area in C, showing an Olig2+ cell (white arrow) that also expresses Msi1. E: Quantification of the density of Olig2+ Msi1+ cells in the dorsal funiculi throughout MHV disease progression compared to PBS‐injected controls. The density of Olig2+ Msi1+ cells was significantly higher at 4 wpi than at all other time points evaluated (P < 0.001 for comparisons between 4 wpi and all other time points). Values shown are the mean ± standard error as derived from three mice for each condition with three sections counted per mouse. F: A subset of Msi1+ cells in the lesion areas coexpressed PDGFαR, a marker of OP cells. A representative double immunolabeled cell showing Msi1 (F) and PDGFαR (F'), with the merged image (F″; Msi1 in green and PDGFαR in red; overlap appears yellow). Scale bars = 100 μm (A), 50 μm (C), 25 μm (B, D), 10 μm (F–F″).
DISCUSSION
The current study demonstrates that Msi1 RNA‐ bindingprotein is an effective regulator of early OP responses associated with the generation of oligodendrocytes. Msi1 siRNA knockdown resulted in dramatic OP cell death while Msi1 transduction promoted OP survival, revealing that Msi1 expression is critical for early oligodendrocyte lineage cell survival. Msi1 transduction inhibited OP differentiation into oligodendrocytes in vitro and in the context of a myelinating white matter tract. These effects of Msi1 on survival and differentiation of early stage oligodendrocyte lineage cells may contribute to the regulation of oligodendrogenesis during development. Furthermore, our demonstration of Msi1 expression in oligodendrocyte lineage cells during early remyelination indicates a potential role for Msi1 in the generation of oligodendrocytes for repair of the adult CNS.
As an RNA‐binding protein, Msi1 is predicted to act by post‐transcriptional modulation of target mRNA transcripts. Although specific genes regulated by Msi1 are not yet known, the current findings focus the context for Msi1 function in the generation of oligodendrocytes in the postnatal CNS. In the postnatal rodent SVZ, neural stem cells give rise to early stage oligodendrocyte lineage cells that migrate to developing white matter and proliferate to generate a large pool of OP cells. Msi1 expression may act in concert with signals that maintain early oligodendrocyte lineage cells in a relatively undifferentiated state. Msi1 expression may be especially critical during early OP cell migration from the neural stem cell niche prior to interaction with oligodendrocyte survival factors in white matter tracts. Indeed, the current findings directly test a previous correlation of Msi1 expression with cell survival (Kempermann et al., 2006) and extend the potential range of Msi1 from neurogenesis to oligodendrogenesis. Furthermore, the results of the Msi1 in vivo transduction experiments showed that Msi1 expression does not block acquisition of NG2 immunoreactivity but does modulate differentiation of OP cells into mature oligodendrocytes.
Potential targets of Msi1 regulation have been characterized in other cellular contexts that may also apply to early oligodendrocyte lineage cells. In neural stem cells, Msi1 repression of m‐numb translation promotes Notch1 signaling (Hitoshi et al., 2002; Imai et al., 2001). In oligodendrocyte lineage cells, m‐numb expression inversely correlates with Notch1 expression and activation of Notch1 signaling inhibits oligodendrocyte differentiation (Givogri et al., 2003; Wang et al., 1998). The Msi1 siRNA knockdown results (see Fig. 7) are consistent with results seen in Notch1 knockout and haploinsufficiency mice (Genoud et al., 2002; Givogri et al., 2002). These mice exhibited accelerated OP differentiation and myelination during postnatal development, identifying Notch1 as a critical regulator of oligodendrocyte maturation. In addition, in the Notch1 knockout mice, precocious OP differentiation was associated with increased apoptosis (Genoud et al., 2002). Activation of the Notch1 signaling pathway by Msi1‐mediated repression of m‐numb translation in early oligodendrocyte lineage cells may inhibit differentiation until OP cells have reached their appropriate location in developing white matter.
Another characterized target of Msi1 binding is p21WAF‐1 (Battelli et al., 2005), a cyclin‐dependent kinase inhibitor involved in cell cycle regulation. By inhibiting translation of p21WAF‐1, Msi1 is able to regulate stem cell maintenance (Battelli et al., 2005). Msi1 binding to p21WAF‐1 may contribute to survival of early oligodendrocyte lineage cells by temporarily inhibiting cell cycle progression. However, later in oligodendrocyte development, Msi1 binding to p21WAF‐1 is unlikely to be the mechanism by which Msi1 inhibits oligodendrocyte differentiation since Msi1 overexpression would be expected to enhance proliferation and promote OP differentiation if Msi1 exerted its effect by binding to p21WAF‐1.
Cells that express Msi1 persist into adulthood and may contribute to repair of damaged CNS tissues (Okano et al., 2005). After a demyelinating episode in the CNS, OP cells proliferate to repopulate the lesioned area and then differentiate to form myelinating oligodendrocytes (Dubois‐Dalcq et al., 2005). OP cells that proliferate in response to demyelination can be identified by expression of PDGFαR (Redwine and Armstrong, 1998). This study shows coexpression of Msi1 with both Olig2 and PDGFαR after MHV‐induced demyelination in the spinal cord (see Fig. 8). Importantly, the density of Msi1+ Olig2+ cells was significantly higher at the time point when lesions are being repopulated by proliferating OP cells (Redwine and Armstrong, 1998). Furthermore, recent work in our lab showed Msi1+ cells associated with lesions that were double immunolabeled for myelin transcription factor 1 (Myt1) (Vana et al., 2007). Myt1 is expressed in oligodendrocyte lineage cells in normal and demyelinated mouse spinal cord tissues, but is not expressed in astrocytes. These findings demonstrate that a population of Msi1+ cells is distinct from reactive astrocytes and is identified with markers (i.e., PDGFαR, Olig2, or Myt1) indicative of early oligodendrocyte lineage cells responding to demyelination. Therefore, Msi1 may have a role in the generation of remyelinating oligodendrocytes in the adult CNS which may contribute to recovery from diseases with a demyelinating component, such as multiple sclerosis and spinal cord injury.
This work highlights the role of Msi1 in the oligodendrocyte lineage. Our findings complement previous studies of Msi1 in the embryonic nervous system (Sakakibara et al., 2002). Embryonic development in Msi1−/− mice provided initial clues that Msi1 may function to regulate oligodendrocyte development. The absence of Msi1 had no effect on neurosphere number or self‐renewal activity yet fewer clones contained oligodendrocytes. This result suggests that Msi1 expression influences the generation and/or survival of oligodendrocytes in the embryonic CNS. This effect of Msi1 did not require cooperative interaction with Musashi2 (Msi2) nor did Msi2 appear to compensate for this Msi1−/− reduced neurosphere multipotency (Sakakibara et al., 2002). Further research is needed to identify targets of Msi1 RNA‐binding targets and to understand the mechanisms by which Msi1 affects OP differentiation and survival. Additional study of Msi1 expression in the OP response to demyelinating diseases may elucidate potential targets for therapeutic interventions to promote the generation of remyelinating oligodendrocytes.
Supporting information
This article contains supplementary material available via the Internet at http://www.interscience.wiley.com/jpages/0894-1491/suppmat .
Supplemental Figure 1:Immunohistochemistry for Msi1 (green), Olig2 (red), and DAPI (blue) in coronal section through the subcallosal zone in postnatal day 7 mouse brain. White arrows illustrate Msi1+ Olig2+ cells in CC and SCZ. Large white arrow shows a pair of Msi1+ Olig2+ cells with small, round cell bodies (see Figure 1 E inset for enlargement). DAPI nuclear stain highlights the dense cellularity of the hippocampus with absence of Msi1+ cells in this region. CC = corpus callosum, HC = hippocampus, SCZ = subcallosal zone. Scale bar = 50 μm.
Supplemental Figure 2:Immunohistochemistry for Msi1 (green), Olig2 (red), and GFAP (blue) in the corpus callosum of coronal sections from postnatal day 7 mouse brain. Several Msi1+ Olig2+ cells (white arrows) are seen as well as Msi1+ GFAP+ astrocytes (blue arrowheads), Olig2+ Msi1‐ GFAP‐ cells (red arrowheads), and Msi1+ Olig2‐ GFAP‐ cells (green arrows). Co‐expression of GFAP and Olig2 was not observed. Scale bar = 50 μm.
Supplemental Figure 3:Immunohistochemistry for Msi1 (green), Sox10 (red), and DAPI (blue) in the corpus callosum adjacent to the SVZ, in coronal sections from postnatal day 7 mouse brain. An example of a Msi1+ Sox10+ cell (white arrow) among a majority of Sox10+ Msi1‐ cells (red arrowheads) and Msi1+ Sox10‐ cells (green arrowheads). Scale bar = 25 μm.
Acknowledgements
The authors thank the investigators who generously contributed reagents, as noted, and Tuan Le for technical assistance. The views expressed are those of the authors and do not reflect the official policy of the Department of Army, Department of Defense, or US Government.
REFERENCES
- Akamatsu W,Okano HJ,Osumi N,Inoue T,Nakamura S,Sakakibara S,Miura M,Matsuo N,Darnell RB,Okano H. 1999. Mammalian ELAV‐like neuronal RNA‐binding proteins HuB and HuC promote neuronal development in both the central and the peripheral nervous systems. Proc Natl Acad Sci USA 96: 9885–9890. [DOI] [PMC free article] [PubMed] [Google Scholar]
- Armstrong R,Friedrich VL Jr,Holmes KV,Dubois‐Dalcq M. 1990. In vitro analysis of the oligodendrocyte lineage in mice during demyelination and remyelination. J Cell Biol 111: 1183–1195. [DOI] [PMC free article] [PubMed] [Google Scholar]
- Armstrong RC. 1998. Isolation and characterization of immature oligodendrocyte lineage cells. Methods 16: 282–292. [DOI] [PubMed] [Google Scholar]
- Armstrong RC,Kim JG,Hudson LD. 1995. Expression of myelin transcription factor I (MyTI), a “zinc‐finger” DNA‐binding protein, in developing oligodendrocytes. Glia 14: 303–321. [DOI] [PubMed] [Google Scholar]
- Armstrong RC,Redwine JM,Messersmith DJ. 2005. Coronavirus‐induced demyelination and spontaneous remyelination: Growth factor expression and function. In: Lavi E,Constantinescu CS, editors. Experimental models of multiple sclerosis. Norwell, MA: Springer Science. pp. 793–803. [Google Scholar]
- Back SA,Gan X,Li Y,Rosenberg PA,Volpe JJ. 1998. Maturation‐dependent vulnerability of oligodendrocytes to oxidative stress‐induced death caused by glutathione depletion. J Neurosci 18: 6241–6253. [DOI] [PMC free article] [PubMed] [Google Scholar]
- Battelli C,Nikopoulos GN,Mitchell JG,Verdi JM. 2005. The RNA‐binding protein Musashi‐1 regulates neural development through the translational repression of p21WAF‐1. Mol Cell Neurosci 31: 85–96. [DOI] [PubMed] [Google Scholar]
- Dubois‐Dalcq M,Ffrench‐Constant C,Franklin RJ. 2005. Enhancing central nervous system remyelination in multiple sclerosis. Neuron 48: 9–12. [DOI] [PubMed] [Google Scholar]
- Ebersole TA,Chen Q,Justice MJ,Artzt K. 1996. The quaking gene product necessary in embryogenesis and myelination combines features of RNA binding and signal transduction proteins. Nat Genet 12: 260–265. [DOI] [PubMed] [Google Scholar]
- Fuss B,Mallon B,Phan T,Ohlemeyer C,Kirchhoff F,Nishiyama A,Macklin WB. 2000. Purification and analysis of in vivo‐differentiated oligodendrocytes expressing the green fluorescent protein. Dev Biol 218: 259–274. [DOI] [PubMed] [Google Scholar]
- Genoud S,Lappe‐Siefke C,Goebbels S,Radtke F,Aguet M,Scherer SS,Suter U,Nave KA,Mantei N. 2002. Notch1 control of oligodendrocyte differentiation in the spinal cord. J Cell Biol 158: 709–718. [DOI] [PMC free article] [PubMed] [Google Scholar]
- Givogri MI,Costa RM,Schonmann V,Silva AJ,Campagnoni AT,Bongarzone ER. 2002. Central nervous system myelination in mice with deficient expression of Notch1 receptor. J Neurosci Res 67: 309–320. [DOI] [PubMed] [Google Scholar]
- Givogri MI,Schonmann V,Cole R,De Vellis J,Bongarzone ER. 2003. Notch1 and Numb genes are inversely expressed as oligodendrocytes differentiate. Dev Neurosci 25: 50–64. [DOI] [PubMed] [Google Scholar]
- Gokhan S,Marin‐Husstege M,Yung SY,Fontanez D,Casaccia‐Bonnefil P,Mehler MF. 2005. Combinatorial profiles of oligodendrocyte‐selective classes of transcriptional regulators differentially modulate myelin basic protein gene expression. J Neurosci 25: 8311–8321. [DOI] [PMC free article] [PubMed] [Google Scholar]
- Hardy RJ. 1998. QKI expression is regulated during neuron‐glial cell fate decisions. J Neurosci Res 54: 46–57. [DOI] [PubMed] [Google Scholar]
- Hitoshi S,Alexson T,Tropepe V,Donoviel D,Elia AJ,Nye JS,Conlon RA,Mak TW,Bernstein A,van der Kooy D. 2002. Notch pathway molecules are essential for the maintenance, but not the generation, of mammalian neural stem cells. Genes Dev 16: 846–858. [DOI] [PMC free article] [PubMed] [Google Scholar]
- Imai T,Tokunaga A,Yoshida T,Hashimoto M,Mikoshiba K,Weinmaster G,Nakafuku M,Okano H. 2001. The neural RNA‐binding protein Musashi1 translationally regulates mammalian numb gene expression by interacting with its mRNA. Mol Cell Biol 21: 3888–3900. [DOI] [PMC free article] [PubMed] [Google Scholar]
- Kakita A,Goldman JE. 1999. Patterns and dynamics of SVZ cell migration in the postnatal forebrain: Monitoring living progenitors in slice preparations. Neuron 23: 461–472. [DOI] [PubMed] [Google Scholar]
- Kaneko Y,Sakakibara S,Imai T,Suzuki A,Nakamura Y,Sawamoto K,Ogawa Y,Toyama Y,Miyata T,Okano H. 2000. Musashi1: An evolutionally conserved marker for CNS progenitor cells including neural stem cells. Dev Neurosci 22: 139–153. [DOI] [PubMed] [Google Scholar]
- Kempermann G,Chesler E,Lu L,Williams R,Gage F. 2006. Natural variation and genetic covariance in adult hippocampal neurogenesis. Proc Natl Acad Sci USA 103: 780–785. [DOI] [PMC free article] [PubMed] [Google Scholar]
- Kitamura T,Koshino Y,Shibata F,Oki T,Nakajima H,Nosaka T,Kumagai H. 2003. Retrovirus‐mediated gene transfer and expression cloning: Powerful tools in functional genomics. Exp Hematol 31: 1007–1014. [PubMed] [Google Scholar]
- Levison SW,Chuang C,Abramson BJ,Goldman JE. 1993. The migrational patterns and developmental fates of glial precursors in the rat subventricular zone are temporally regulated. Development 119: 611–622. [DOI] [PubMed] [Google Scholar]
- Ligon KL,Fancy SP,Franklin RJ,Rowitch DH. 2006. Olig gene function in CNS development and disease. Glia 54: 1–10. [DOI] [PubMed] [Google Scholar]
- Lu Z,Zhang Y,Ku L,Wang H,Ahmadian A,Feng Y. 2003. The quakingviable mutation affects qkI mRNA expression specifically in myelin‐producing cells of the nervous system. Nucleic Acids Res 31: 4616–4624. [DOI] [PMC free article] [PubMed] [Google Scholar]
- Marshall CA,Novitch BG,Goldman JE. 2005. Olig2 directs astrocyte and oligodendrocyte formation in postnatal subventricular zone cells. J Neurosci 25: 7289–7298. [DOI] [PMC free article] [PubMed] [Google Scholar]
- Menn B,Garcia‐Verdugo JM,Yaschine C,Gonzalez‐Perez O,Rowitch D,Alvarez‐Buylla A. 2006. Origin of oligodendrocytes in the subventricular zone of the adult brain. J Neurosci 26: 7907–7918. [DOI] [PMC free article] [PubMed] [Google Scholar]
- Messersmith DJ,Murtie JC,Le TQ,Frost EE,Armstrong RC. 2000. Fibroblast growth factor 2 (FGF2) and FGF receptor expression in an experimental demyelinating disease with extensive remyelination. J Neurosci Res 62: 241–256. [DOI] [PMC free article] [PubMed] [Google Scholar]
- Murtie JC,Zhou YX,Le TQ,Armstrong RC. 2005a. In vivo analysis of oligodendrocyte lineage development in postnatal FGF2 null mice. Glia 49: 542–554. [DOI] [PubMed] [Google Scholar]
- Murtie JC,Zhou YX,Le TQ,Vana AC,Armstrong RC. 2005b. PDGF and FGF2 pathways regulate distinct oligodendrocyte lineage responses in experimental demyelination with spontaneous remyelination. Neurobiol Dis 19: 171–182. [DOI] [PubMed] [Google Scholar]
- Nielsen JA,Berndt JA,Hudson LD,Armstrong RC. 2004. Myelin transcription factor 1 (Myt1) modulates the proliferation and differentiation of oligodendrocyte lineage cells. Mol Cell Neurosci 25: 111–123. [DOI] [PubMed] [Google Scholar]
- Nishiyama A,Lin XH,Giese N,Heldin CH,Stallcup WB. 1996. Co‐localization of NG2 proteoglycan and PDGF α‐receptor on O2A progenitor cells in the developing rat brain. J Neurosci Res 43: 299–314. [DOI] [PubMed] [Google Scholar]
- Okano H,Kawahara H,Toriya M,Nakao K,Shibata S,Imai T. 2005. Function of RNA‐binding protein Musashi‐1 in stem cells. Exp Cell Res 306: 349–356. [DOI] [PubMed] [Google Scholar]
- Okano HJ,Darnell RB. 1997. A hierarchy of Hu RNA binding proteins in developing and adult neurons. J Neurosci 17: 3024–3037. [DOI] [PMC free article] [PubMed] [Google Scholar]
- Redwine JM,Armstrong RC. 1998. In vivo proliferation of oligodendrocyte progenitors expressing PDGFαR during early remyelination. J Neurobiol 37: 413–428. [DOI] [PubMed] [Google Scholar]
- Sakakibara S,Imai T,Hamaguchi K,Okabe M,Aruga J,Nakajima K,Yasutomi D,Nagata T,Kurihara Y,Uesugi S,Miyata T,Ogawa M,Mikoshiba K,Okano H. 1996. Mouse‐Musashi‐1, a neural RNA‐binding protein highly enriched in the mammalian CNS stem cell. Dev Biol 176: 230–242. [DOI] [PubMed] [Google Scholar]
- Sakakibara S,Nakamura Y,Satoh H,Okano H. 2001. Rna‐binding protein Musashi2: Developmentally regulated expression in neural precursor cells and subpopulations of neurons in mammalian CNS. J Neurosci 21: 8091–8107. [DOI] [PMC free article] [PubMed] [Google Scholar]
- Sakakibara S,Nakamura Y,Yoshida T,Shibata S,Koike M,Takano H,Ueda S,Uchiyama Y,Noda T,Okano H. 2002. RNA‐binding protein Musashi family: Roles for CNS stem cells and a subpopulation of ependymal cells revealed by targeted disruption and antisense ablation. Proc Natl Acad Sci USA 99: 15194–15199. [DOI] [PMC free article] [PubMed] [Google Scholar]
- Sakakibara S,Okano H. 1997. Expression of neural RNA‐binding proteins in the postnatal CNS: Implications of their roles in neuronal and glial cell development. J Neurosci 17: 8300–8312. [DOI] [PMC free article] [PubMed] [Google Scholar]
- Seri B,Herrera DG,Gritti A,Ferron S,Collado L,Vescovi A,Garcia‐Verdugo JM,Alvarez‐Buylla A. 2006. Composition and organization of the SCZ: A large germinal layer containing neural stem cells in the adult mammalian brain. Cereb Cortex 16 ( Suppl 1): i103–i111. [DOI] [PubMed] [Google Scholar]
- Simpson PB,Armstrong RC. 1999. Intracellular signals and cytoskeletal elements involved in oligodendrocyte progenitor migration. Glia 26: 22–35. [PubMed] [Google Scholar]
- Stolt CC,Rehberg S,Ader M,Lommes P,Riethmacher D,Schachner M,Bartsch U,Wegner M. 2002. Terminal differentiation of myelin‐forming oligodendrocytes depends on the transcription factor Sox10. Genes Dev 16: 165–170. [DOI] [PMC free article] [PubMed] [Google Scholar]
- Vana AC,Lucchinetti CF,Le TQ,Armstrong RC. 2007. Myelin transcription factor 1 (Myt1) expression in demyelinated lesions of rodent and human CNS. Glia 55: 687–697. [DOI] [PMC free article] [PubMed] [Google Scholar]
- Wang S,Sdrulla AD,diSibio G,Bush G,Nofziger D,Hicks C,Weinmaster G,Barres BA. 1998. Notch receptor activation inhibits oligodendrocyte differentiation. Neuron 21: 63–75. [DOI] [PubMed] [Google Scholar]
- Zhou YX,Flint NC,Murtie JC,Le TQ,Armstrong RC. 2006. Retroviral lineage analysis of fibroblast growth factor receptor signaling in FGF2 inhibition of oligodendrocyte progenitor differentiation. Glia 54: 578–590. [DOI] [PMC free article] [PubMed] [Google Scholar]
Associated Data
This section collects any data citations, data availability statements, or supplementary materials included in this article.
Supplementary Materials
This article contains supplementary material available via the Internet at http://www.interscience.wiley.com/jpages/0894-1491/suppmat .
Supplemental Figure 1:Immunohistochemistry for Msi1 (green), Olig2 (red), and DAPI (blue) in coronal section through the subcallosal zone in postnatal day 7 mouse brain. White arrows illustrate Msi1+ Olig2+ cells in CC and SCZ. Large white arrow shows a pair of Msi1+ Olig2+ cells with small, round cell bodies (see Figure 1 E inset for enlargement). DAPI nuclear stain highlights the dense cellularity of the hippocampus with absence of Msi1+ cells in this region. CC = corpus callosum, HC = hippocampus, SCZ = subcallosal zone. Scale bar = 50 μm.
Supplemental Figure 2:Immunohistochemistry for Msi1 (green), Olig2 (red), and GFAP (blue) in the corpus callosum of coronal sections from postnatal day 7 mouse brain. Several Msi1+ Olig2+ cells (white arrows) are seen as well as Msi1+ GFAP+ astrocytes (blue arrowheads), Olig2+ Msi1‐ GFAP‐ cells (red arrowheads), and Msi1+ Olig2‐ GFAP‐ cells (green arrows). Co‐expression of GFAP and Olig2 was not observed. Scale bar = 50 μm.
Supplemental Figure 3:Immunohistochemistry for Msi1 (green), Sox10 (red), and DAPI (blue) in the corpus callosum adjacent to the SVZ, in coronal sections from postnatal day 7 mouse brain. An example of a Msi1+ Sox10+ cell (white arrow) among a majority of Sox10+ Msi1‐ cells (red arrowheads) and Msi1+ Sox10‐ cells (green arrowheads). Scale bar = 25 μm.