

Abstract
Background
Macrophages (Mø) participate centrally in atherosclerosis and Mø markers (e.g. CD68, MAC-3) correlate well with lesion severity and therapeutic modulation. Based on the avidity of lesional Mø for polysaccharide containing supramolecular structures such as nanoparticles, we have developed a new positron emission tomography (PET) agent with optimized pharmacokinetics to allow in vivo imaging at tracer concentrations.
Methods and Results
A dextranated and DTPA-modified magnetofluorescent 20nm nanoparticle was labeled with the PET tracer 64Cu (1 mCi/0.1mg NP) to yield a PET, MR and optically detectable imaging agent. Peak PET activity 24 hours after i.v. injection into mice deficient in apolipoprotein E (apoE-/-) with experimental atherosclerosis mapped to areas of high plaque load identified by CT, such as the aortic root and arch, and correlated with magnetic resonance and optical imaging. Accumulated dose in apoE-/- aortas determined by gammacounting was 260% and in carotids 392% of respective wild type organs (p<0.05 both). Autoradiography of aortas demonstrated uptake of the agent into Mø-rich atheromata identified by Oil red O staining of lipid deposits. The novel nanoagent accumulated predominantly in Mø as determined by fluorescence microscopy and flow cytometry of cells dissociated from aortas.
Conclusion
This report establishes the capability of a novel tri-modality nanoparticle to directly detect Mø in atherosclerotic plaques. Advantages include improved sensitivity, direct correlation of PET signal with an established biomarker (CD68), ability to readily quantify the PET signal, perform whole body vascular surveys, the ability to spatially localize and follow the tri-reporter by microscopy, and the clinical translatability of the agent given similarities to MRI probes in clinical trials.
Keywords: atherosclerosis, molecular imaging, inflammation, nanoparticle, PET-CT
Introduction
Inflammation drives atherosclerotic plaque evolution and increases cardiovascular risk. Monocytes/macrophages (Mø) enter nascent atherosclerotic lesions, ingest modified lipoprotein particles, and give rise to foam cells, a hallmark of atheromata1. Mø amplify local inflammation through secretion of cytokines and reactive oxygen species and can weaken the plaque’s fibrous cap by secretion of proteases1. Therefore, Mø act as protagonist cells that can destabilize inflammatory atherosclerotic plaques and favor plaque disruption, a frequent cause of myocardial infarction and stroke1.
A variety of carbohydrate and polyol-coated nanoparticles (NP) have emerged as powerful affinity labels for Mø based on their active internalization and intracellular trapping into phagocytic cells. For example, MRI studies have used NP to report areas of inflamed lesions in animals2-6, and in carotid artery plaques in patients7, 8. Although MRI provides unparalleled versatility and soft tissue contrast9, direct visualization of abnormalities often requires relatively large amounts of NP (2-20 mg Fe/Kg). Nuclear techniques such as positron emission tomography (PET) potentially provide detection sensitivities an order of magnitude higher, enabling use of NP at lower concentrations than MRI permits. Furthermore, the combination of the high sensitivity of PET with the anatomical detail provided by CT in hybrid imaging has the potential to map signal to atherosclerotic vascular territories10. However, imaging in small vessels such as coronary arteries may still prove challenging with today’s resolutions of PET imaging systems.
To date, most clinical PET-CT studies have used 18F-fluoro-2-deoxyglucose (18FDG) to image atherosclerosis11-15. Targeting areas of high metabolic rate with tagged glucose is an attractive concept, but the rapid radioactive decay of 18FDG has limited careful histological and molecular studies necessary to correlate the imaging signal with plaque components. Uptake of 18FDG in the region of atherosclerotic arteries may thus not report solely on inflammatory cells16.
Here we report the development of a novel class of Mø-targeted PET agents based on long-circulating, dextran coated nanoparticles. The magnetic nanoparticle base material17 has been derivatized with DTPA for the nuclear tracer 64Cu and a near infrared fluorochrome, yielding a tri-modality reporter for PET, MRI and fluorescence imaging (tri-reporter nanoparticle, 64Cu-TNP). We hypothesized that 64Cu-TNP accumulation correlates with Mø burden, and that the derived in vivo PET signal correlates with inflammatory plaque components identified by MRI, fluorescence imaging and flow cytometry. Furthermore, we compare the in vivo distribution of 64Cu-TNP to 18FDG in atherosclerotic mice.
Materials and Methods
Synthesis of 64Cu-TNP
The well characterized nanoparticle MION - previously used for MR imaging17 - served as starting material. The dextran coating of the NP was crosslinked with epichlorin hydrin, aminated and labeled with near infrared fluorochrome Vivotag-680 (VT680, VisEn Medical, Woburn, MA). The ratio of VT680 per nanoparticle was approximately 5 dye moieties/NP. The stable and purified NP was subsequently incubated with excess dianhydride DTPA (Sigma, St. Louis, MO) for 2 hours in 0.1M borate buffer, pH 9.3 at room temperature. After purification with a PD-10 column, the NP was dissolved in phosphate buffer (pH 7.4) for the preparation of 64Cu-DTPA-NP (short “64Cu-TNP”, Fig. 1). One hundred μg DTPA-NP were used for the labeling with 64CuCl2 (IsoTrace, Toronto, Canada) equivalent to about 185 MBq 64Cu, in ammonium acetate buffer (180 μL, 0.5 M, pH 5.5). After 25 min of incubation at 95°C, the solution was centrifuged and washed three times. Pure 64Cu-TNP was re-dissolved in 400 μL PBS. We used stable, non-radioactive copper salts for labeling TNP used in MRI experiments to reduce exposure to radiation. Figure 1 shows a schematic of the agent. Aliquots were routinely analyzed by HPLC (eluents: A= 0.1% TFA in water and B= acetonitrile; gradient: 0-20 min, 95%-40% A; 20-24 min, 95% B; 24-28 min, 95% B; 30 min, 95% A), using a Varian 210 HPLC (Salt Lake City, UT) with a C18 column, multi-wavelength detector and a flow-through gamma-detector. The specific activity of 64Cu-TNP was 1 mCi per 0.1 mg Fe of NP (corresponding to approximately 300 μCi/mouse or 1.5 mg Fe/kg bodyweight). The average diameter of the NP was 20 nm as determined by laser light scattering. The R1 and R2 values were approximately 29 and 60 mMsec-1 (0.47T, 39°C).
Figure 1. 64Cu-TNP.
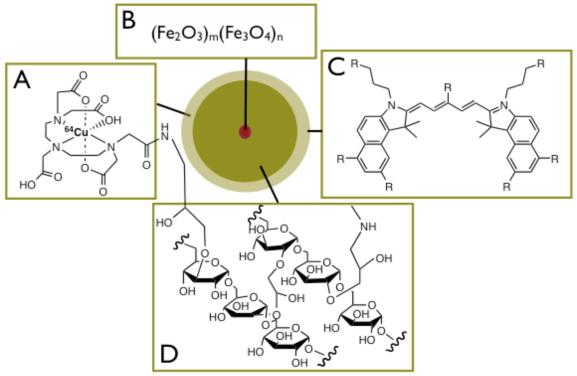
Schematic view of tri-modality reporter 64Cu-TNP.
1A: Derivatization with chelator DTPA allows attachment of radiotracer 64Cu.
1B: Iron oxide core provides contrast in magnetic resonance imaging (T2, T2* or SSFP sequences).
1C: Fluorochrome VT680 for fluorescence imaging including fluorescence microscopy, flow cytometry, and fluorescence mediated tomography.
1D: Crosslinked aminated polysaccharide coating provides biocompatibility, determines blood half-life and provides linker for attachment of tracers, and potentially affinity ligands.
Atherosclerotic mice
Nine apoE-/- mice (Jackson Labs, Bar Harbor, ME) were used for the PET imaging study, 5 mice for MRI, 3 mice for flow cytometry, and 4 mice for histology. The remaining 9 mice were used for additional biodistribution experiments (n=4), in intial dose finding studies and to implement the study design for serial PET imaging (18FDG followed by 64Cu-TNP imaging). Five wild type (Jackson Labs) mice were imaged using PET, and the remaining mice were used for biodistribution studies. ApoE-/- mice had an average age of 45 weeks and consumed a high-cholesterol diet (Harlan Teklad, Madison, Wis; 0.2% total cholesterol) for 20 weeks. Mice were anesthetized for all procedures and imaged under inhalation anesthesia (isoflurane 2-3% v/v + 2 L/min O2) (Forane, Baxter, Deerfield, IL). 18FDG PET studies used ketamine/xylazine anesthesia to suppress myocardial tracer uptake (ip. injections of ketamine,100mg/kg, and xylazine, 5mg/kg). The institutional subcommittee on research animal care approved all animal studies.
Phantom studies
An agar phantom was used to compare the sensitivity of nanoparticle detection with the different imaging modalities. Nanoparticles were diluted in 2 % low melting agarose to concentrations ranging from .0025 to 10 g Fe /mL and added to wells in a precast gel. PET-CT imaging of 2 gels was followed by MRI using a 7 Tesla Pharmascan magnet (Bruker, Billerica, MA) and employing a T2* weighted gradient echo sequence (TE 140 ms, matrix 128×128, FOV 60×40 mm, slice thickness 0.8 mm).
PET-CT imaging
Nine apoE-/- mice were imaged with PET-CT one hour after injection of 259±52μCi of 18FDG. On the following day, the same apoE-/- and 5 C57BL6 mice were injected iv. with 303±39 μCi of 64Cu-TNP (1.5 mg NP /kg bodyweight) and imaged at 24 hours post injection. This dosage provides activity within the dynamic range of the PET system 24 hours after injection. Furthermore, this concentration was about one order of magnitude lower than previously used for MRI (10-30 mg Fe/Kg)2, 6. The PET-CT used a FLEX™ X-PET™/X-O™ micro PET-CT (Gamma Medica Ideas, Inc, Northridge, CA). To achieve appropriate intravascular contrast, iopamidol 61% (Bracco Diagnostics, Princeton, NJ) was continuously infused via tail vein at a rate of 65 μL/min for the time of CT acquisition, which was approximately 2 minutes. The CT system was calibrated to acquire 512 projections at 75 kVp, with a 64 mm detector center of rotation. After the CT scan was complete, the mouse bed was translated axially and centered within the PET detector ring. Depending on the count rate, the PET scan was acquired for 30-45min. Spatial resolution was 72μm isotropic for CT, and 2 mm for PET imaging. The PET and CT images were fused using a software module in Amira (version 4.1) specifically written by Mercury Computer systems for the X-PET™ PET-CT system (Mercury Computer Systems, Carlsbad, CA). Since the mouse remains in the same position on the bed for both PET and CT acquisitions, and the relative positions of the field of views of the PET and CT are known, the software module can use the positional information to fuse and co-register the PET and CT data. Fused images were converted into DICOM format and analyzed using OsiriX shareware (Geneva, Switzerland, www.osirix-viewer.com) by placing volumes of interest in the aortic root, a region of consistent location of atheromata in apoE-/- mice, and in skeletal muscle for calculation of target to background ratios. Standard uptake values (SUV) were calculated as (tissue activity/volume of tissue)/(body activity/body weight).
Magnetic resonance imaging
In vivo MRI studies were performed using a 7 Tesla horizontal bore scanner (Bruker Pharmascan, Billerica, MA) as previously described2. Five apoE-/- mice were imaged before and 48 hours after i.v. injection with 30 mg Fe/kg of a cold version of TNP. Bright-blood cine images were obtained with ECG and respiratory gating (SA Instruments, Stony Brook, NY) using a gradient echo FLASH-sequence and a dedicated mouse cardiac volume coil (Rapid Biomedical, Wuerzburg, Germany). Imaging parameters were as follows: echo time (TE), 2.7 ms; 16 frames per RR interval (TR 7.0-8.0 ms); in-plane resolution 200×200 μm; slice thickness 1 mm; NEX 8. Images were analyzed using OsiriX. Signal intensities were measured by tracing a manual region-of-interest in the blood and around the wall of the aortic root. The contrast-to-noise ratio (CNR) between the blood pool and the adjacent plaque was calculated as follows: CNR = (blood signal - plaque signal) / (standard deviation of the noise).
Ex vivo fluorescence reflectance imaging (FRI)
After MRI, mice were sacrificed and the aortas were excised using a dissecting microscope and microdissection tools. Imaging was performed using a fluorescence microscope (OV-100 Olympus, Tokyo, Japan) at magnification 2x and a wavelength of 700nm. The plaque target-to-background ratio (TBR) was calculated as: TBR=(plaque signal) / (adjacent aortic background signal).
Biodistribution studies
To determine the blood half-life of 64Cu-TNP, repetitive retro-orbital bleeds were performed at 30 minutes, 1, 2, 6, and 24 hours after intravenous injection of 150 μCi of 64Cu-TNP in 6 wild type mice. Immediately after injection and again before dissection at 24 hours, all mice were placed in a well counter (CRC-127R, Capintec, Inc., Ramsey, NJ) to measure total corporeal radioactivity. Aortas and carotid arteries were harvested from wild type and apoE-/- mice using magnification glasses and microdissection tools, and activity was recorded with a gamma counter (1480 Wizard 3”, PerkinElmer, Boston, MA). In addition, a full biodistribution of other organs was performed. Aortas of apoE-/- mice were then opened to expose the inside surface, and pinned onto a black silicone elastomer. The opened aorta was fixed for 20 minutes with 10% buffered formalin, washed with PBS, incubated with propylene glycol for 5 min, and stained with 0.5% Oil red O for 2 hours at 22°C. Aortas were washed repeatedly with 85% propylene glycol, followed by PBS. After collection of digital images, pins were removed, and the tissue was exposed for autoradiography on the PhosophorImager (SI, Molecular Dynamics, Sunnyvale, CA) for 24 hours.
Flow cytometry
After sacrifice, 3 aortas from probe-injected apoE-/- mice were excised and minced with fine scissors. Thereafter, the tissue was placed into a cocktail of collagenase I, collagenase XI, DNase I and hyaluronidase (Sigma-Aldrich, St. Louis, MO) and shaken at 37°C for 1 h18. The tissue was then triturated through nylon mesh and centrifuged (15 min, 500 × g, 4°C). The resulting cell suspensions were washed with HBSS supplemented with 0.2% (w/v) BSA and 1% (w/v) FCS. To visualize Mø, neutrophils, smooth muscle cells and endothelial cells, the suspension was incubated with a mixture of monoclonal antibodies19. The following antibodies were used: anti-CD90-PE, 53-2.1 (BD Biosciences, San Jose, CA), anti-B220-PE, RA3-6B2 (BD Biosciences), anti-CD49b-PE, DX5 (BD Biosciences), anti-NK1.1-PE, PK136 (BD Biosciences), anti-Ly-6G-PE, 1A8 (BD Biosciences), CD11b-APC-Cy7, M1/70 (BD Biosciences), anti-CD31-FITC, 390 (BD Biosciences), anti-alpha-smooth muscle actin-FITC, 1A4 (Abcam, Cambridge, MA). Monocytes/macrophages were identified as CD11bhi (CD90/B220/CD49b/NK1.1/Ly-6G)lo. Neutrophils were identified as CD11bhi (CD90/B220/CD49b/NK1.1/Ly-6G)hi. Endothelial cells were identified as CD31+ CD11b-. Smooth muscle cells were identified as alpha-actin+CD11b-. For intracellular staining of alpha-smooth muscle actin, cells were permeabilized and fixed with a Cytofix/Cytoperm Kit (BD Biosciences). Data were acquired on an LSRII (BD Biosciences) with 670/LP and 695/40 filter configuration to detect 64Cu-TNP. Relative contribution of signal was calculated by multiplying proportion of cells in living gate by mean fluorescent intensity.
Histopathology
The aortic root was embedded in OCT (Sakura Finetek USA, Torrance, Ca). Serial cryostat sections of 6 μm thickness were obtained starting at the aortic valve. Sections were stained with H&E or for immunofluorescence with the following antibodies: primary anti-mouse Mac-3, CD 31 (Mø and endothelial cells, BD Biosciences), α-actin (smooth muscle cells, Lab Vision, Fremont, CA). Secondary antibodies were as follows: biotinylated goat anti rabbit, biotinylated goat anti rat, or secondaries attached to Texas Red for immunofluorescence (Vector Laboratories, Burlingame, CA). Finally, sections were stained with DAPI to visualize cell nuclei.
Fluorescence Microscopy
Triple fluorescently-labeled cells were imaged using an upright epifluorescence microscope (Eclipse 80i, Nikon, Melville, NY) with a cooled CCD camera (Cascade, Photometrics, Tucson, Ariz) interfaced to a Macintosh computer. Fluorescence images were obtained in three spectrally-resolved channels: ultraviolet (for DAPI nuclear staining), Texas Red (for immunofluorescent cell-specific antibodies), and far red (for 64Cu-TNP). Exposure time was 10 msec in the UV channel, and 300 msec in the other channels. Fluorescence images were acquired digital 16-bit images.
Statistics
Results are expressed as mean±SD. The data sets were tested for normality using the Kolmogorov-Smirnov test with the Dallal-Wilkinson-Lilliefors correction, and for equality of variances using the F test. If normality and equality of variances could not be rejected at 0.05 significance level, the group means were compared using parametric tests. Unpaired data were compared using the unpaired two-sided t test, and for paired data using the paired two-sided t-test. If either normality or equality of variances were rejected, the nonparameric Mann-Whitney test was used. The significance level in all tests was 0.05. We used Graphpad Prism 4.0c for Macintosh (GraphPad Software, Inc., San Diego, CA) for statistical analysis.
RESULTS
64Cu-TNP is detectable by MRI and PET-CT
The detection threshold of the nanoparticle in the imaging phantom was approximately 5 μg Fe/mL using T2 weighted MRI, and 0.1 μg Fe/mL for PET-CT imaging (Fig. 2).
Figure 2. Detection threshold for 64Cu-TNP by MRI and PET.

Two agar phantoms with increasing concentration of 64Cu-TNP were first imaged by PET-CT (A, B) followed by T2* weighted gradient echo MRI at 7 Tesla (TE 140ms, C, D). The concentration of NP in wells is given in E and F, respectively. In the current experimental set-up the lowest concentration detected by MRI was 5μg Fe/ml agar, and for PET 0.1μg Fe/ml, 50x lower than MRI.
Biodistribution and half-life of 64Cu-TNP
The mean blood half-life of 64Cu-TNP in B6 mice was 259±39 min assuming a one-compartment model (constant, 0.282; fit, R2=0.90). Twenty-four hours after injection, 81.3±3.3% of decay corrected activity remained in the animal. Biodistribution analysis of wild type mice at this time point revealed the following profile (percent injected dose per gram tissue, %IDGT): liver, 33.6±7.3; small intestine, 15.8±2.8; kidney, 13.8±1.8; lung, 11.0±2.5; spleen, 9.4±3.6; heart, 6.0±0.9; aorta, 5.2±0.9; lymph nodes, 4.3±1.1; thymus, 2.4±1.2; and fat 1.1±0.3. On a total organ base, liver (41.7±12.7%), intestine (20.0±2.1%) and carcass (28.3%) contained the majority of NP. In apoE-/- mice, the organ distribution was similar as above but the %ID accumulated in aortas and carotid arteries was 260% and 392% higher respectively than in wild type mice (both p< 0.005, Fig. 4).
Figure 4. Biodistribution analysis corroborates uptake of 64Cu-TNP into atherosclerotic lesions in apoE-/- mice.

4A: Percent injected dose per organ was significantly increased in excised aortas and carotid arteries of apoE-/- when compared to wild type mice (*p<0.05).
4B: Exposure of excised aortas on the phosphor imager corroborated in vivo imaging findings of high activity in the aortic root and arch of apoE-/- mice. The color legend depicts signal intensity on autoradiography, correlating with activity and 64Cu-TNP accumulation in the tissue.
PET-CT shows accumulation of 64Cu-TNP in atherosclerotic arteries of apoE-/- mice and is corroborated by in vivo MRI and ex vivo FRI
All imaged apoE-/- mice showed a robust PET signal in the aortic root and arch, as identified by CT in the fused data sets (Fig. 3). Intravenous application of iodinated CT contrast enhanced the anatomical detail and identification of the Murine vasculature. The target to background ratio for 64Cu-TNP-derived PET signal in the aortic root compared to surrounding tissue was 5.1±0.9. The in-vivo PET-CT findings were corroborated by ex vivo gamma counting and autoradiography, which showed significant differences between accumulated dose in excised aortas and carotids in apoE-/- versus wild type mice (Fig. 4). We compared in vivo PET-CT imaging and autoradiographic uptake to Oil red O staining of opened aortas. The PET signal in the aortic root colocalized with regions of strong enhancement on autoradiography and with Oil red O stained atheroma (Fig. 5A-F). MRI of the aortic root showed significant (p = 0.01) contrast enhancement 48 hours after injection of the nanoparticle (Fig. 5G-I). Plaques in the aortic root, arch and carotid arteries of apoE-/- mice were strongly positive on macroscopic fluorescence imaging of excised aortas (Fig. 5K), further corroborating the PET signal observed in these vascular territories. The plaque target to background ratio measured by fluorescence reflectance imaging was 8.0 ± 1.9.
Figure 3. 64Cu-TNP facilitates PET-CT imaging of inflammatory atherosclerosis in apoE-/- mice.
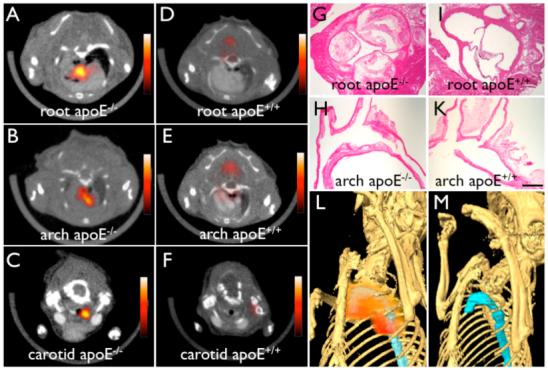
Fused PET-CT images of the aortic root (A), the arch (B) and carotid artery (C) of aged apoE-/- mice show strong PET signal in these vascular territories with high plaque burden, whereas no activity is observed in the same vasculature of wild type mice (D-F). (G) and (H) show H&E histology of respective vascular regions, which carry a high plaque burden in apoE-/- but not in wild type mice (I-K) (magnification 40x for G and I, magnification 20x for H and K, bar equals 0.4 mm). The 3D-maximum intensity reconstruction of the fused dataset (L) demonstrates focal PET signal (red) in the proximal thoracic aorta (blue) of an apoE-/- mouse, but not in wild type (M).
Figure 5. 64Cu-TNP distributes to atherosclerotic lesions.

5A-B: PET-CT shows enhancement of the posterior aortic root (arrow).
5C-F: En face Oil red O staining of the excised aorta depicts plaque loaded vessel segments, which co-localize with areas of high 64Cu-TNP uptake on autoradiography. 5E-F show a zoomed image of the root and arch. The arrows depict a plaque laden segment of the root with high activity, which corresponds to the in vivo signal seen in 5B.
5G-I: Pre and post injection MR images of the aortic root (inset). The dotted line in long axis views demonstrates slice orientation for short axis root imaging. The signal intensity (pseudocolored with identical scaling for pre- and post injection image) decreased significantly after injection of 64Cu-TNP, which was quantified by calculation of the contrast to noise ratio (5I, * p = 0.01).
5K: Near infrared fluorescence reflectance imaging (NIRF) of excised aortas showed accumulation of the probe in plaques residing in the root (arrow), the thoracic aorta and the carotid bifurcation (arrowheads), further corroborating the PET signal observed in these vascular territories.
Flow cytometry of digested aortas facilitates quantification of nanoparticle uptake into distinct inflammatory cell populations
Capitalizing on the fluorescent properties of the nanoparticle, we next aimed to determine the cellular source of signal observed by in vivo imaging. We performed flow cytometry of cellular suspensions yielded from digested mouse aortas, and found that Mø associated activity contributed to 73.9% of the overall activity. Other cells such as neutrophils, endothelial cells, lymphocytes and smooth muscle cells also ingested 64Cu-TNP and collectively contributed to the remaining signal (Fig. 6).
Figure 6. Flow cytometry analysis of digested atherosclerotic lesions shows predominant uptake of 64Cu-TNP into monocyte/macrophages.

Flow cytometry was performed on digested aortas of apoE-/- injected with the nanoparticle.
6A: Placement of gates within all living cells: i) lymphocyte gate, ii) neutrophil gate, iii) Mø gate, iv) endothelial cell gate, v) smooth muscle cell gate, and vi) other cell types.
6B: Histograms with respective intracellular signal in the VT680 channel for each cell type as identified in 6A.
6C: Relative signal contribution per cell type to overall signal. Mø are the dominating cell type ingesting 64Cu-TNP (73.9% of overall signal), followed by neutrophils (17.2%), endothelial cells (4.2%), lymphocytes (4.3%) and smooth muscle cells (0.4%) and other cell types not stained by the used antibody cocktail (6.6%).
Fluorescence microscopy reveals the cellular uptake profile of nanoparticle
To validate further the distribution of 64Cu-TNP within atheromata, microscopic sections were analyzed by fluorescence microscopy (Fig. 7). While the nanoparticle was visualized in the 680 channel (680 nm excitation and 700 nm emission wavelengths), respective antigens were stained using secondary antibodies tagged with Texas red. The nanoparticle accumulated mostly intracellularly in Mø, as demonstrated by colocalization with MAC-3 antigen, but some uptake also occurred in lesional smooth muscle cells (α-actin) located in the media adjacent to a highly inflamed, macrophage-rich region of the plaque and in endothelial cells (CD31). Importantly, such uptake was not seen in smooth muscle cells or endothelial cells of non-atherosclerotic vascular wall, arguing for functionally different cell states (i.e. activated smooth muscle cells and endothelial cells in atherosclerotic lesions)17.
Figure 7. In vivo cellular distribution of 64Cu-TNP assessed by fluorescence microscopy.
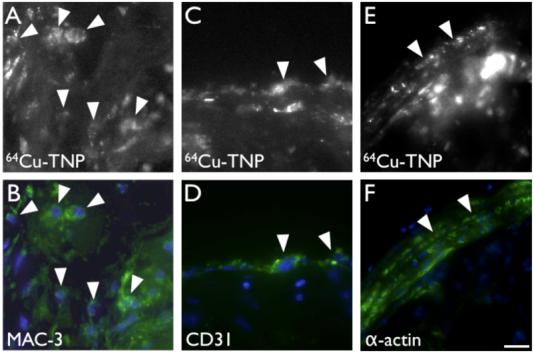
7A-B: Fluorescence microscopy in the 680nm channel reveals the cellular distribution of 64Cu-TNP (7A). Immunoreactive staining for MAC-3 (7B) demonstrates that uptake into Mø dominates (arrowheads).
7C-D: Immunoreactive staining for CD31 shows uptake into some endothelial cells lining the vascular lumen (arrowheads).
7E-F: Adjacent to plaques with high macrophage content, we also observed uptake into smooth muscle cells in the media (arrow heads). Bar depicts 10 μm.
64Cu-TNP and 18FDG enhance comparable arterial territories
We next sought to directly compare 18FDG and 64Cu-TNP imaging in the same animal, facilitated by the short half-life of 18FDG. Detectable PET signals were found in areas of high plaque burden such as the aortic root for both, 18FDG and 64Cu-TNP at respective peak enhancements. In a head-to-head comparison in apoE-/- mice, the PET signal emanating from atherosclerotic lesions was slightly higher for 64Cu-TNP (Fig. 8) and persisted longer, consistent with cellular uptake and trapping in phagocytic cells.
Figure 8. Serial PET imaging of 18FDG and 64Cu-TNP.
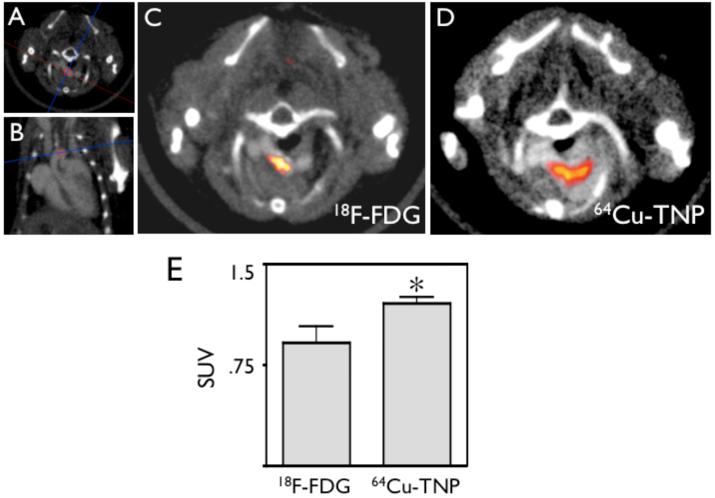
8A-B: CT scout scans show orientation of imaging slice through aortic arch, an area of frequent inflammatory atherosclerotic plaques31.
8C: PET-CT 1 hour after injection of 18FDG.
8D: PET-CT imaging of the same mouse 24 hours after injection of 64Cu-TNP. Both tracers show uptake in the aortic arch.
8E: Comparison of SUV calculated for both tracers shows higher values for 64Cu-TNP (* p<0.05).
DISCUSSION
Traditional imaging of atherosclerosis has focused on the caliber of the arterial lumen or the structure of plaque. Advances in the basic and clinical biology of atherosclerosis have identified inflammation as a key process contributing to lesion initiation, progression, and complication. This recognition has spurred considerable effort to image inflammation in atheromata. The application of nanotechnology offers new approaches to the design of diagnostic agents. Optical and magnetic resonance imaging have employed nanoparticles20, 21, but this technology has only recently been explored for the design of new generations of PET imaging agents. Here we report on the development and validation of a novel, flexible nanoparticle platform for PET imaging. The synergy of a high inherent phagocytic avidity of dextran coated nanoparticles and derivatization of these nanomaterials with a radiotracer provides a highly sensitive tool to assess Mø burden in murine atherosclerosic lesions. Furthermore, the tri-modal character of 64Cu-TNP allows hybrid imaging, and rigorous probe validation by fluorescence-based techniques on the cellular and molecular level.
Clinically, interest has burgeoned in developing strategies to identify inflamed, presumably rupture-prone atherosclerotic plaques. Such functional imaging might allow identification of high risk patients, and help direct therapy to prevent cardiovascular events22, 23. Goals for a suitable technology include high sensitivity, high specificity for biological processes leading to rupture of a plaque, and practicability. Phantom imaging shown in Fig. 2 established a high sensitivity for PET to detect low concentrations of 64Cu-TNP. TNP employed in this study was administered at 1.5 mg Fe/kg bodyweight, well below the dose currently in clinical trials for oncology (2.6 mg Fe/kg)24 and well below the dose used experimentally for imaging of atherosclerosis in rabbits (14-56 mg Fe/kg)3, 4. We anticipate that the detection threshold could easily be improved by several orders of magnitude with further chemical optimization aiming at higher specific activity of the nanoparticle, as well as with the higher sensitivity of next generation PET imaging systems.
In vivo PET-CT imaging after injection of 64Cu-TNP showed robust PET signal in regions of mouse atheromata. In vivo magnetic resonance and ex vivo fluorescence imaging established the distribution of the nanomaterials to atherosclerotic lesions. Phagocytic cells implicated in lesion growth and vulnerability ingested 64Cu-TNP as shown by immunofluorescence and flow cytometry. After in vivo distribution of 64Cu-TNP, cells that express Mø surface markers showed the highest nanoparticle uptake as characterized by maximal mean fluorescence units per cell in flow cytometry.
Although thorough toxicity tests remain to be performed, we expect 64Cu-TNP to be safe at the trace amounts used. Comparable iron oxide nanoparticles have been frequently used for MRI in animal models and in patients. In vitro studies have shown that high concentrations of nanoparticles may change the cytokine profile of macrophages25, while a dose dependent shift towards an antiflammatory phenotype was observed. It is unclear how the relatively high doses in this in vitro study reflect the in vivo situation. Nevertheless, it seems unlikely that iron oxide nanoparticle uptake would drive phagocytes towards a more inflammatory state. 64Cu has been used as a PET tracer in patients26. A recent study by Lewis et al. found no signs of acute toxicity of a 64Cu derivative in hamsters27. The metal copper can be toxic in high doses, however it is here injected in a chelated state, preventing any potential toxicity of free copper. For instance, Gadolinium is highly toxic, but is frequently used as a contrast agent in clinical MRI as Gd-DTPA.
Consecutive 18FDG and 64Cu-TNP PET-CT imaging established a similar but not identical macroscopic distribution for both probes, with peak vascular signal observed in the aortic root and arch. Microscopic probe distribution could be assessed for 64Cu-TNP but not for 18FDG since the radioactive signal was too low and decayed too fast to enable ex vivo autoradiography or gammacounting. Previously, 18FDG distribution has been believed to correlate with plaque macrophage content in patients12, 15 and in the rabbit plaques28, 29. However, unequivocal cellular distribution studies have not been published to date, given the experimental difficulty (rapid decay, unavailability of fluorescent analogs for correlative flow cytometry or fluorescence microscopy). Indeed, a recent study in apoE-/- mice identified brown fat and not atherosclerotic lesions as a dominant source of 18FDG signal in vivo16.
The multimodality capabilities of the nanomaterials developed here facilitated rigorous validation of the origin of the signal and the fate of the imaging probe. The addition of a fluorochrome for optical imaging proved particularly helpful to test the novel probe and determine its fate at a cellular level in vivo. We anticipate that nanomaterials such as the one described here will advance both basic research and clinical applications for several reasons. First, the tri-modality diagnostic capability will prove synergistic for hybrid imaging systems currently entering clinical use. Secondly, PET imaging has a high inherent sensitivity, allows for quantification of the signal, and will facilitate whole body screening of the entire arterial tree. Thirdly, the described nanotechnology platform is being introduced into the clinic24 and is versatile. The carbohydrate coating can be aminated to attach linkers and affinity ligands to specifically target these nanomaterials to other molecular and cellular structures such as adhesion molecules2, Mø subpopulations17 or cells undergoing apoptosis30.
ACKNOWLEDGEMENTS
The authors acknowledge the the CMIR Mouse Imaging Program (Peter Waterman, BS; Anne Yu, BS) for assistance with PET-CT and MR imaging, Eric Sun, PhD and Nikolai Sergeyev, PhD for nanoparticle preparation, the CMIR Pathology Core for assistance with histology, Michael J. Welch, PhD, at Washington University for production of 64Cu, Timur Shtatland, PhD, for statistical analysis, and Lee Josephson, PhD, for many helpful discussions. This work was funded in part by the D.W. Reynolds Foundation, and UO1-HL080731, RO1-HL078641, and R24-CA92782 (RW).
Footnotes
Subject heads: [124] Cardiovascular imaging agents/Techniques, [32] Nuclear cardiology and PET, [60] PET and SPECT
REFERENCES
- 1.Libby P. Inflammation in atherosclerosis. Nature. 2002;420:868–874. doi: 10.1038/nature01323. [DOI] [PubMed] [Google Scholar]
- 2.Nahrendorf M, Jaffer FA, Kelly KA, Sosnovik DE, Aikawa E, Libby P, Weissleder R. Noninvasive vascular cell adhesion molecule-1 imaging identifies inflammatory activation of cells in atherosclerosis. Circulation. 2006;114:1504–1511. doi: 10.1161/CIRCULATIONAHA.106.646380. [DOI] [PubMed] [Google Scholar]
- 3.Herborn CU, Vogt FM, Lauenstein TC, Dirsch O, Corot C, Robert P, Ruehm SG. Magnetic resonance imaging of experimental atherosclerotic plaque: comparison of two ultrasmall superparamagnetic particles of iron oxide. J Magn Reson Imaging. 2006;24:388–393. doi: 10.1002/jmri.20649. [DOI] [PubMed] [Google Scholar]
- 4.Ruehm SG, Corot C, Vogt P, Kolb S, Debatin JF. Magnetic resonance imaging of atherosclerotic plaque with ultrasmall superparamagnetic particles of iron oxide in hyperlipidemic rabbits. Circulation. 2001;103:415–422. doi: 10.1161/01.cir.103.3.415. [DOI] [PubMed] [Google Scholar]
- 5.Schmitz SA, Coupland SE, Gust R, Winterhalter S, Wagner S, Kresse M, Semmler W, Wolf KJ. Superparamagnetic iron oxide-enhanced MRI of atherosclerotic plaques in Watanabe hereditable hyperlipidemic rabbits. Invest Radiol. 2000;35:460–471. doi: 10.1097/00004424-200008000-00002. [DOI] [PubMed] [Google Scholar]
- 6.Jaffer FA, Nahrendorf M, Sosnovik D, Kelly KA, Aikawa E, Weissleder R. Cellular imaging of inflammation in atherosclerosis using magnetofluorescent nanomaterials. Mol Imaging. 2006;5:85–92. [PubMed] [Google Scholar]
- 7.Toussaint JF, LaMuraglia GM, Southern JF, Fuster V, Kantor HL. Magnetic resonance images lipid, fibrous, calcified, hemorrhagic, and thrombotic components of human atherosclerosis in vivo. Circulation. 1996;94:932–938. doi: 10.1161/01.cir.94.5.932. [DOI] [PubMed] [Google Scholar]
- 8.Kooi ME, Cappendijk VC, Cleutjens KB, Kessels AG, Kitslaar PJ, Borgers M, Frederik PM, Daemen MJ, van Engelshoven JM. Accumulation of ultrasmall superparamagnetic particles of iron oxide in human atherosclerotic plaques can be detected by in vivo magnetic resonance imaging. Circulation. 2003;107:2453–2458. doi: 10.1161/01.CIR.0000068315.98705.CC. [DOI] [PubMed] [Google Scholar]
- 9.Sosnovik DE, Nahrendorf M, Weissleder R. Molecular magnetic resonance imaging in cardiovascular medicine. Circulation. 2007;115:2076–2086. doi: 10.1161/CIRCULATIONAHA.106.658930. [DOI] [PubMed] [Google Scholar]
- 10.Okane K, Ibaraki M, Toyoshima H, Sugawara S, Takahashi K, Miura S, Shimosegawa E, Satomi J, Kitamura K, Satoh T. 18F-FDG accumulation in atherosclerosis: use of CT and MR co-registration of thoracic and carotid arteries. Eur J Nucl Med Mol Imaging. 2006;33:589–594. doi: 10.1007/s00259-005-0005-2. [DOI] [PubMed] [Google Scholar]
- 11.Davies JR, Rudd JH, Fryer TD, Graves MJ, Clark JC, Kirkpatrick PJ, Gillard JH, Warburton EA, Weissberg PL. Identification of culprit lesions after transient ischemic attack by combined 18F fluorodeoxyglucose positron-emission tomography and high-resolution magnetic resonance imaging. Stroke. 2005;36:2642–2647. doi: 10.1161/01.STR.0000190896.67743.b1. [DOI] [PubMed] [Google Scholar]
- 12.Rudd JH, Warburton EA, Fryer TD, Jones HA, Clark JC, Antoun N, Johnstrom P, Davenport AP, Kirkpatrick PJ, Arch BN, Pickard JD, Weissberg PL. Imaging atherosclerotic plaque inflammation with [18F]-fluorodeoxyglucose positron emission tomography. Circulation. 2002;105:2708–2711. doi: 10.1161/01.cir.0000020548.60110.76. [DOI] [PubMed] [Google Scholar]
- 13.Tahara N, Kai H, Yamagishi S, Mizoguchi M, Nakaura H, Ishibashi M, Kaida H, Baba K, Hayabuchi N, Imaizumi T. Vascular inflammation evaluated by [18F]-fluorodeoxyglucose positron emission tomography is associated with the metabolic syndrome. J Am Coll Cardiol. 2007;49:1533–1539. doi: 10.1016/j.jacc.2006.11.046. [DOI] [PubMed] [Google Scholar]
- 14.Tatsumi M, Cohade C, Nakamoto Y, Wahl RL. Fluorodeoxyglucose uptake in the aortic wall at PET/CT: possible finding for active atherosclerosis. Radiology. 2003;229:831–837. doi: 10.1148/radiol.2293021168. [DOI] [PubMed] [Google Scholar]
- 15.Tawakol A, Migrino RQ, Bashian GG, Bedri S, Vermylen D, Cury RC, Yates D, LaMuraglia GM, Furie K, Houser S, Gewirtz H, Muller JE, Brady TJ, Fischman AJ. In vivo 18F-fluorodeoxyglucose positron emission tomography imaging provides a noninvasive measure of carotid plaque inflammation in patients. J Am Coll Cardiol. 2006;48:1818–1824. doi: 10.1016/j.jacc.2006.05.076. [DOI] [PubMed] [Google Scholar]
- 16.Laurberg JM, Olsen AK, Hansen SB, Bottcher M, Morrison M, Ricketts SA, Falk E. Imaging of vulnerable atherosclerotic plaques with FDG-microPET: No FDG accumulation. Atherosclerosis. 2007;192:275–282. doi: 10.1016/j.atherosclerosis.2006.07.019. [DOI] [PubMed] [Google Scholar]
- 17.Weissleder R, Kelly K, Sun EY, Shtatland T, Josephson L. Cell-specific targeting of nanoparticles by multivalent attachment of small molecules. Nat Biotechnol. 2005;23:1418–1423. doi: 10.1038/nbt1159. [DOI] [PubMed] [Google Scholar]
- 18.Galkina E, Kadl A, Sanders J, Varughese D, Sarembock IJ, Ley K. Lymphocyte recruitment into the aortic wall before and during development of atherosclerosis is partially L-selectin dependent. J Exp Med. 2006;203:1273–1282. doi: 10.1084/jem.20052205. [DOI] [PMC free article] [PubMed] [Google Scholar]
- 19.Swirski FK, Pittet MJ, Kircher MF, Aikawa E, Jaffer FA, Libby P, Weissleder R. Monocyte accumulation in mouse atherogenesis is progressive and proportional to extent of disease. Proc Natl Acad Sci U S A. 2006;103:10340–10345. doi: 10.1073/pnas.0604260103. [DOI] [PMC free article] [PubMed] [Google Scholar]
- 20.Nahrendorf M, Sosnovik DE, Waterman P, Swirski FK, Pande AN, Aikawa E, Figueiredo JL, Pittet MJ, Weissleder R. Dual channel optical tomographic imaging of leukocyte recruitment and protease activity in the healing myocardial infarct. Circ Res. 2007;100:1218–1225. doi: 10.1161/01.RES.0000265064.46075.31. [DOI] [PubMed] [Google Scholar]
- 21.Weissleder R. Molecular imaging in cancer. Science. 2006;312:1168–1171. doi: 10.1126/science.1125949. [DOI] [PubMed] [Google Scholar]
- 22.Fayad ZA, Fuster V. Clinical imaging of the high-risk or vulnerable atherosclerotic plaque. Circ Res. 2001;89:305–316. doi: 10.1161/hh1601.095596. [DOI] [PubMed] [Google Scholar]
- 23.Jaffer FA, Weissleder R. Molecular imaging in the clinical arena. Jama. 2005;293:855–862. doi: 10.1001/jama.293.7.855. [DOI] [PubMed] [Google Scholar]
- 24.Harisinghani MG, Barentsz J, Hahn PF, Deserno WM, Tabatabaei S, van de Kaa CH, de la Rosette J, Weissleder R. Noninvasive detection of clinically occult lymph-node metastases in prostate cancer. N Engl J Med. 2003;348:2491–2499. doi: 10.1056/NEJMoa022749. [DOI] [PubMed] [Google Scholar]
- 25.Siglienti I, Bendszus M, Kleinschnitz C, Stoll G. Cytokine profile of iron-laden macrophages: implications for cellular magnetic resonance imaging. J Neuroimmunol. 2006;173:166–173. doi: 10.1016/j.jneuroim.2005.11.011. [DOI] [PubMed] [Google Scholar]
- 26.Anderson CJ, Dehdashti F, Cutler PD, Schwarz SW, Laforest R, Bass LA, Lewis JS, McCarthy DW. 64Cu-TETA-octreotide as a PET imaging agent for patients with neuroendocrine tumors. J Nucl Med. 2001;42:213–221. [PubMed] [Google Scholar]
- 27.Lewis JS, Connett JM, Garbow JR, Buettner TL, Fujibayashi Y, Fleshman JW, Welch MJ. Copper-64-pyruvaldehyde-bis(N(4)-methylthiosemicarbazone) for the prevention of tumor growth at wound sites following laparoscopic surgery: monitoring therapy response with microPET and magnetic resonance imaging. Cancer Res. 2002;62:445–449. [PubMed] [Google Scholar]
- 28.Ogawa M, Ishino S, Mukai T, Asano D, Teramoto N, Watabe H, Kudomi N, Shiomi M, Magata Y, Iida H, Saji H. (18)F-FDG accumulation in atherosclerotic plaques: immunohistochemical and PET imaging study. J Nucl Med. 2004;45:1245–1250. [PubMed] [Google Scholar]
- 29.Zhang Z, Machac J, Helft G, Worthley SG, Tang C, Zaman AG, Rodriguez OJ, Buchsbaum MS, Fuster V, Badimon JJ. Non-invasive imaging of atherosclerotic plaque macrophage in a rabbit model with F-18 FDG PET: a histopathological correlation. BMC Nucl Med. 2006;6:3. doi: 10.1186/1471-2385-6-3. [DOI] [PMC free article] [PubMed] [Google Scholar]
- 30.Sosnovik DE, Schellenberger EA, Nahrendorf M, Novikov MS, Matsui T, Dai G, Reynolds F, Grazette L, Rosenzweig A, Weissleder R, Josephson L. Magnetic resonance imaging of cardiomyocyte apoptosis with a novel magneto-optical nanoparticle. Magn Reson Med. 2005;54:718–724. doi: 10.1002/mrm.20617. [DOI] [PubMed] [Google Scholar]
- 31.Meir KS, Leitersdorf E. Atherosclerosis in the apolipoprotein-E-deficient mouse: a decade of progress. Arterioscler Thromb Vasc Biol. 2004;24:1006–1014. doi: 10.1161/01.ATV.0000128849.12617.f4. [DOI] [PubMed] [Google Scholar]