

Abstract
Objective
To examine the persistence of the original treatment effects 10 years after the Diabetes Control and Complications Trial (DCCT) in the follow-up Epidemiology of Diabetes Interventions and Complications (EDIC) study. In the DCCT, intensive therapy aimed at near-normal glycemia reduced the risk of microvascular complications of type 1 diabetes mellitus compared with conventional therapy.
Methods
Retinopathy was evaluated by fundus photography in 1211 subjects at EDIC year 10. Further 3-step progression on the Early Treatment Diabetic Retinopathy Study scale from DCCT closeout was the primary outcome.
Results
After 10 years of EDIC follow-up, there was no significant difference in mean glycated hemoglobin levels (8.07% vs 7.98%) between the original treatment groups. Nevertheless, compared with the former conventional treatment group, the former intensive group had significantly lower incidences from DCCT close of further retinopathy progression and proliferative retinopathy or worse (hazard reductions, 53%-56%; P<.001). The risk (hazard) reductions at 10 years of EDIC were attenuated compared with the 70% to 71% over the first 4 years of EDIC (P<.001). The persistent beneficial effects of former intensive therapy were largely explained by the difference in glycated hemoglobin levels during DCCT.
Conclusion
The persistent difference in diabetic retinopathy between former intensive and conventional therapy (“metabolic memory”) continues for at least 10 years but may be waning.
The Diabetes Control and Complications Trial (DCCT) was designed to determine whether intensive therapy with the aim of maintaining glycemic levels as close to the nondiabetic range as possible would prevent or delay the long-term complications of type 1 diabetes mellitus.1 The DCCT demonstrated substantial reductions in the risk of development and progression of the early microvascular complications of diabetes over an average of 6.5 years of intensive therapy as compared with conventional therapy. At the close of the DCCT in 1993, patients in the conventional therapy group were offered intensive therapy and instructed in its use. All patients subsequently returned to their health care providers for further diabetes care and 97% of the original DCCT cohort (n=1394) was enrolled in the Epidemiology of Diabetes Interventions and Complications (EDIC), a long-term observational study.2 An earlier report showed that the ongoing risk of all levels of retinopathy remained significantly reduced in the intensive compared with the conventional group during the first 4 years of EDIC, despite similar glycated hemoglobin (HbA1c) levels over this period (called “metabolic memory”).3 Determining the duration of metabolic memory is important to quantify the long-term clinical effects of intensive diabetes therapy. The current report describes the continuing differences between the 2 original treatment groups in retinal complications 10 years after the close of the DCCT.
METHODS
SUBJECTS
At baseline, the 1441 patients enrolled in the DCCT during 1983-1989 were 13 to 39 years of age, had type 1 diabetes mellitus for 1 to 15 years, and were in generally good health. The primary prevention (726 patients with no retinopathy, albumin excretion rates <28 μg/min [<40 mg/24 hours], and 1-5 years’ diabetes duration) and secondary intervention (715 patients with diabetes duration of 1-15 years, minimal to moderate nonproliferative diabetic retinopathy [NPDR], and urinary albumin excretion rates <139 μg/min [≤200 mg/24 hours]) cohort participants were randomly assigned to either intensive therapy, with the goal of achieving glycemic levels as close to the nondiabetic range as safely possible, or to conventional therapy, as previously described.1 Intensive therapy included at least 3 injections of insulin daily or continuous subcutaneous insulin infusion with pumps, with insulin dose adjustments based on frequent self-monitoring of capillary glucose levels, meal size and composition, and physical activity levels. Mean duration of follow-up in the DCCT was 6.5 years.
ASSESSMENT OF RETINOPATHY
During EDIC, retinopathy was assessed by 7-field stereo fundus photography in approximately one-quarter of the cohort each year and in the entire cohort at years 4 and 10. Photography was not conducted if a patient had previously undergone panretinal photocoagulation in both eyes. Retinopathy status was determined in 1211 patients at EDIC year 10, 1045 based on fundus photography and 166 living patients with a known history of panretinal photocoagulation in either eye during DCCT (35 patients) or EDIC (131 patients). All photographs were graded centrally, with graders masked to therapy assignment, using the final Early Treatment Diabetic Retinopathy Study (ETDRS) grading scale4 and DCCT methods.5 The primary outcome was the time to the first occurrence of further retinopathy progression during EDIC, defined as a 3-step or more progression from the level of retinopathy at DCCT closeout,3 representing a reproducible measure of clinically important worsening. The secondary retinopathy outcome was the time to the first occurrence of proliferative diabetic retinopathy (PDR) or worse during EDIC. Other retinopathy outcomes were the prevalence of a 3-step or more progression from DCCT entry, severe NPDR (ETDRS leve l53/<53) or worse, clinically significant macular edema (CSME),6 and photocoagulation therapy (focal or scatter). Patients who received panretinal scatter photocoagulation (laser) therapy in either eye were counted as having worsened retinopathy for all of these outcomes thereafter, and patients who received focal photocoagulation for macular edema were counted as having CSME thereafter. Visual acuity was assessed by ETDRS methods.7
Interreader reliability during EDIC was evaluated by having different graders reread the same 50 fundus photographs at each EDIC year and comparing the results with the primary double reading at DCCT closeout. The individual weighted κ measure8 of interrater agreement beyond chance ranged from 0.82 to 0.92 for ordinal ETDRS scores and from 0.71 to 0.90 for ordinal CSME scores over 10 years of measurements. The overall weighted κ9 stratified for EDIC year was 0.91 for ETDRS scores and 0.84 for CSME scores.
ASSESSMENT OF GLYCEMIC CONTROL
Hemoglobin A1c was measured annually in a central laboratory by high-performance liquid chromatography.10 The mean HbA1c value was calculated as the time-weighted average during the DCCT and EDIC.11
STATISTICAL ANALYSES
To test for differences between groups, the Wilcoxon rank sum test was used for quantitative or ordinal observations12 and the χ2 test, for categorical data.13 Generalized estimating equations with an unstructured working correlation matrix14 were used to assess the aggregate HbA1c level difference between groups over EDIC years and to test for differences in odds reduction in further 3-step or more progression and PDR between EDIC years 4 and 10.
Analyses of progression of retinopathy were stratified by, or included adjustment for, retinopathy severity at the end of DCCT, defined as no retinopathy (ETDRS grade 10/10), microaneurysms only (ETDRS grade 20), mild NPDR (ETDRS grade 30), moderate NPDR or greater (≥ETDRS grade 40), and any previous laser therapy (focal or scatter). The Mantel-Haenszel method provided a stratified adjusted odds ratio,15 with test-based confidence intervals (CIs). Logistic regression models assessed the effects of covariates on the prevalence (odds) of a particular retinopathy outcome at a specific EDIC year.15 P values were obtained from likelihood ratio tests. The percentage of reduction in the odds with intensive vs conventional therapy was computed as (1-odds ratio)×100.
The Weibull proportional hazards regression model for interval-censored data16 evaluated the treatment group effects on the cumulative incidence of further retinopathy progression during EDIC adjusted for other covariates. The model used all photographs in all patients. The Weibull assumption was verified by empirical estimation of the survival function.17 Risk (hazard) reduction with intensive vs conventional therapy was calculated as (1-hazard ratio)×100. P values were obtained from likelihood ratio tests. The proportion reduction in -log likelihood () was used to describe the proportion of variation in risk explained by the HbA1c levels.15 All analyses were performed using SAS (SAS Institute Inc, Cary, North Carolina).
RESULTS
SUBJECTS
Table 1 shows the characteristics at DCCT baseline and at the end of the DCCT (EDIC baseline) of the 1211 subjects with retinopathy status determined at EDIC year 10. At DCCT baseline, there were no significant differences between the intensive and conventional treatment groups. However, treatment group differences reflecting the beneficial effects of intensive therapy were seen at DCCT end for HbA1c level, prevalence of hyperlipidemia, retinopathy level, and need for photocoagulation.
Table 1. Characteristics of the 1211 Patients Evaluated for Retinopathy After 10 Years of EDIC Follow-up.
| DCCT Treatment Group, %a |
|||
|---|---|---|---|
| Characteristic | Conventional (n=615)b | Intensive (n=596)b | P Valuec |
| At DCCT entry | |||
| Women | 49.2 | 50.8 | .30 |
| Age, y, mean (SD) | 27 (7) | 27 (7) | .13 |
| Primary prevention cohortd | 51.2 | 49.2 | .47 |
| Duration of diabetes mellitus, y, mean (SD) | 5.7 (4.1) | 6.0 (4.2) | .27 |
| Glycated hemoglobin level, %, mean (SD) | 9.0 (1.6) | 9.1 (1.6) | .25 |
| At DCCT closeout/EDIC baselinee | |||
| Age, y, mean (SD) | 33 (7) | 34 (7) | .09 |
| Duration of diabetes, y, mean (SD) | 11.8 (4.9) | 12.2 (4.9) | .14 |
| DCCT follow-up, y, mean (SD) | 6.3 (1.6) | 6.4 (1.7) | .32 |
| Glycosylated hemoglobin level, %, mean (SD) | 9.0 (1.3) | 7.3 (0.9) | <.001 |
| Treatment | |||
| Continuous subcutaneous insulin infusion (pump) or multiple daily injections | 5.1 | 98.0 | <.001 |
| Self-monitoring of blood glucose level, ≥4 times/d | 4.1 | 53.7 | <.001 |
| Arterial blood pressure,f mm Hg, mean (SD) | 88.2 (8.7) | 88.7 (8.6) | .30 |
| Hyperlipidemiag | 10.6 | 7.2 | .04 |
| Level of retinopathy | |||
| None (10/10) | 17.8 | 28.5 | <.001 |
| Microaneurysms only (20/[<]20) | 31.7 | 39.8 | |
| Mild nonproliferative retinopathy (35/[<]35) | 27.7 | 21.5 | |
| Moderate or severe nonproliferative retinopathy (43/[<]43) | 22.8 | 10.2 | |
| Photocoagulation during DCCT | |||
| Scatter, for retinopathy | 4.1 | 1.7 | .01 |
| Focal, for macular edema | 5.4 | 2.2 | .004 |
| Treatment at EDIC year 10 | |||
| Continuous subcutaneous insulin infusion (pump) or multiple daily injections | 92.2 | 96.6 | .001 |
| Self-monitoring of blood glucose level, ≥4 times/d | 61.5 | 53.7 | .007 |
Abbreviations: DCCT, Diabetes Control and Complications Trial; EDIC, Epidemiology of Diabetes Interventions and Complications.
SI conversion factors: To convert low-density lipoprotein cholesterol to micromoles per liter, multiply by 0.0259; triglycerides to micromoles per liter, multiply by 0.0113; hemoglobin to proportion of total hemoglobin, multiply by 0.01.
Unless otherwise indicated.
The numbers of patients who were alive, had gradable fundus photographs at EDIC year 10, or underwent scatter photocoagulation in one or both eyes during EDIC are included.
P values were based on the Wilcoxon rank sum test for quantitative or ordinal variables or the χ2 test for categorical variables.
No retinopathy or microalbuminuria at baseline (see “Methods” section of the text).
The baseline data in the EDIC study were the same as the data at the end of the DCCT.
Arterial blood pressure=2/3 diastolic blood pressure + 1/3 systolic blood pressure.
Hyperlipidemia is defined as 2 consecutive reports of hypercholesterolemia (low-density lipoprotein cholesterol level >160 mg/dL) or hypertriglyceridemia (triglyceride level >500 mg/dL) within 1 month during DCCT.
TREATMENT AND METABOLIC OUTCOMES
During 6.5 years of treatment in DCCT, intensive and conventional therapy groups adhered to their assigned therapies 98% and 97% of the time, respectively. At EDIC year 4, 95% of the former intensive therapy group were still being treated with multiple daily injections of insulin or an infusion pump, compared with 75% of the former conventional therapy group (P<.001). At EDIC year 10, the differences between the 2 groups had narrowed further with regard to insulin therapy and self-monitoring (Table 1).
At entry to the DCCT, the mean HbA1c level in each treatment group was 9% (to convert to proportion of total hemoglobin, multiply by 0.01) (Table 1). Following 6.5 years of DCCT follow-up, the mean HbA1c levels were 7.3% and 9.0% in the intensive and conventional therapy groups, respectively. At the first EDIC evaluation, 1 year after DCCT end, HbA1c values in the 2 groups had converged (Figure 1). Over 10 years in EDIC, the mean HbA1c levels in the 2 former treatment groups were almost the same (8.07% in the conventional therapy group vs 7.98% in the intensive therapy group; P=.20).
Figure 1.

Distribution of glycated hemoglobin (HbA1c) values by Diabetes Control and Complications Trial (DCCT) treatment group at the end of the DCCT and at each of the first 10 years of the Epidemiology of Diabetes Interventions and Complications (EDIC) study among 1211 subjects evaluated for retinopathy at year 10 of the EDIC study. The box presents the quartiles of the distribution, the vertical lines show the 95th and fifth percentiles, the horizontal line is the median, and the mean is shown as +.
OPHTHALMOLOGIC OUTCOMES FROM DCCT BASELINE TO EDIC YEARS 4 AND 10
The prevalences of various levels of retinopathy and CSME were lower in the former intensive therapy group than in the former conventional therapy group at the end of DCCT and also at years 4 and 10 of EDIC (Table 2). The likelihood (odds) of a 3-step or more progression in retinopathy from DCCT baseline, the principal DCCT outcome, was 76% lower in the intensive than in the conventional therapy group at the end of DCCT (10.7% vs 33.2%). After 4 years of follow-up in EDIC, 48.9% of the former conventional therapy group had a 3-step or more progression in retinopathy from DCCT baseline compared with 17.8% of the former intensive therapy group; after 10 years, 60.6% had progressed in the conventional group vs 35.8% in the intensive group.
Table 2. Prevalence of Various Retinopathy Complications at DCCT Closeout and EDIC Years 4 and 10 Among 1211 Patients Evaluated for Retinopathy at EDIC Year 10.
| DCCT Closeout (n=1211) |
EDIC Year 4 (n=1094) |
EDIC Year 10 (n=1211) |
||||||||||
|---|---|---|---|---|---|---|---|---|---|---|---|---|
| Retinopathy Complicationb |
INT, % |
CON, % |
Odds Reductiona (95% CI), % |
P Value |
INT, % |
CON, % |
Adjusted Odds Reductionb (95% CI), % |
P Value |
INT, % |
CON, % |
Adjusted Odds Reductionb (95% CI), % |
P Value |
| Sample size | 596 | 615 | 541 | 553 | 596 | 615 | ||||||
| ≥3-step progression from DCCT baseline | 10.7 | 33.2 | 76 (67-82) | <.001 | 17.8 | 48.9 | 74 (64-80) | <.001 | 35.8 | 60.6 | 57 (45-66) | <.001 |
| SNPDR or worse | 2.5 | 7.0 | 66 (38-81) | <.001 | 4.6 | 17.4 | 68 (44-81) | <.001 | 9.1 | 25.0 | 58 (38-71) | <.001 |
| PDR or worse | 2.5 | 6.8 | 64 (35-81) | <.001 | 4.3 | 15.7 | 65 (39-80) | <.001 | 8.9 | 24.7 | 58 (38-71) | <.001 |
| CSMEc | 3.9 | 7.7 | 51 (19-71) | .005 | 3.8 | 13.3 | 62 (35-78) | <.001 | 9.0 | 19.0 | 38 (9-59) | .009 |
| Photocoagulation therapy (focal or scatter)d | 3.4 | 8.0 | 60 (32-76) | <.001 | 4.2 | 13.7 | 54 (21-73) | .004 | 8.4 | 23.6 | 57 (38-71) | <.001 |
Abbreviations: CI, confidence interval; CON, former DCCT conventional therapy group; CSME, clinical significant macular edema; DCCT, Diabetes Control and Complications Trial; EDIC, Epidemiology of Diabetes Interventions and Complications; INT, former DCCT intensive therapy group; PDR, proliferative diabetic retinopathy; SNPDR, severe nonproliferative diabetic retinopathy.
The odds reduction is for INT as compared with CON.
Adjusted odds reduction was computed after stratification by the level of retinopathy at the end of the DCCT as shown in Table 1. Since this Table is only limited to the 1121 patients with retinopathy evaluated at EDIC year 10 (except for CSME), the adjusted odds reduction at EDIC year 4 is slightly different from that previously published.3
Based on 1174 patients who were evaluated for CSME at EDIC year 10, including 1173 at DCCT closeout (589 INT and 584 CON), 1068 at EDIC year 4 (534 INT and 534 CON), and 1174 at EDIC year 10 (589 INT and 585 CON).
Patients with scatter photocoagulation after entry into the DCCT were counted as worse for retinopathy; those with focal photocoagulation were counted as worse for macular edema.
The overall prevalences during EDIC reflect, in part, retinopathy differences associated with intensive vs conventional therapy during DCCT. To eliminate the carryover of the treatment group differences at the end of the DCCT into EDIC, we performed logistic regression analysis adjusted for the level of retinopathy at the end of the DCCT. The adjusted odds of retinopathy progression from DCCT entry were reduced by 74% with intensive vs conventional therapy at 4 years of EDIC and 57% at 10 years (each P<.001). Continued significant reductions at 4 and 10 years of EDIC follow-up were also observed in the adjusted odds of severe NPDR or worse, PDR or worse, CSME, and photocoagulation. However, the odds reductions at 10 years were less than that observed at 4 years, except for those for photocoagulation (Table 2).
OPHTHALMIC OUTCOMES FROM EDIC BASELINE TO EDIC YEARS 4 AND 10
To assess metabolic memory further, we examined the prevalence of further 3-step or more progression of retinopathy from the level of retinopathy at DCCT closeout, adjusted for the level at closeout, among those free of panretinal scatter laser therapy during the DCCT. There was a 71% (95% CI, 56%-81%) odds reduction (P<.001) with intensive vs conventional therapy at EDIC year 4 (6.6% and 21.8% prevalence, respectively) and 50% (95% CI, 35%-62%) reduction (P<.001) at EDIC year 10 (24.2% and 40.8% prevalence for intensive and conventional treatment groups, respectively). Generalized estimating equations analysis showed that the beneficial treatment effect in further 3-step or more progression waned (P=.003). We also examined the prevalence of PDR or worse among those free of PDR during the DCCT. The odds reduction with intensive therapy after adjustment for the retinopathy levels at DCCT closeout was 76% (95% CI, 45%-89%) at EDIC year 4 (P<.001), with prevalences of 1.5% and 8.9% in the intensive and conventional treatment groups, respectively. At year 10, the odds reduction of PDR or worse was 59% (95% CI, 37%-73%; P<.001), with prevalences of 6.5% and 19.2% in the intensive and conventional treatment groups, respectively. However, for PDR or worse, the generalized estimating equations analysis showed that the odds reduction was not significantly different between years 4 and 10 (P=.12).
An additional analysis examined the cumulative incidence of further 3-step or more progression during EDIC from the level at DCCT closeout in multivariate Weibull proportional hazards regression models using evaluations at all years in subjects, after excluding 36 participants who had scatter photocoagulation in either eye during DCCT (Table 3) (n=1349). The Weibull model revealed a highly significant beneficial effect of DCCT intensive therapy up to 10 years after the end of DCCT. Figure 2A presents the estimated cumulative incidence of retinopathy further progression in each group derived from the Weibull model, reaching 51% at 10 years in the former conventional and 29% in the intensive treatment groups. The risk (hazard) of further retinopathy progression over the 10 years of EDIC was reduced by 53% (P<.001; 95% CI, 43%-61%). However, this beneficial effect was attenuated compared with the results over the first 4 years after the end of DCCT3 (Figure 2B), when there was a 70% risk (hazard) reduction (95% CI, 59%-79%; P<.001) with intensive therapy. The Weibull model was further fit for the interval between EDIC year 4 and EDIC year 10 (Figure 2B) among those patients who were free of further 3-step progression from DCCT closeout as of EDIC year 4 (n=1105). The risk reduction between EDIC years 4 and 10 verified the persistent and highly significant, albeit attenuated, beneficial effect of the former intensive therapy over this 6-year period (38% risk reduction; 95% CI, 22%-51%; P<.001).
Table 3. Incidence of Further 3-Step Progression of Retinopathy and PDR Between DCCT Closeout and EDIC Year 10 Stratified by the Level of Retinopathy at DCCT Closeout.
| Further 3-Step Progression |
PDRa |
|||||||
|---|---|---|---|---|---|---|---|---|
| Retinopathy Level at DCCT Closeout | No. at Riskb | No. With Event | Adjusted Hazard Reductionc(95% CI), % | P Valued | No. at Riske | No. With Event | Adjusted Hazard Reductionc (95% CI), % | P Valued |
| All levels | 1349 | 53 (43 to 61) | <.001 | 1314 | 56 (37 to 70) | <.001 | ||
| Intensive therapy | 681 | 187 | 666 | 45 | ||||
| Conventional therapy | 668 | 322 | 648 | 121 | ||||
| Stratum 1: no retinopathy | 47 (26 to 62) | <.001 | 72 (42 to 87) | .001 | ||||
| Intensive therapy | 194 | 71 | 194 | 1 | ||||
| Conventional therapy | 123 | 68 | 122 | 2 | ||||
| Stratum 2: microaneurysm only | 63 (47 to 74) | <.001 | ||||||
| Intensive therapy | 274 | 53 | 273 | 9 | ||||
| Conventional therapy | 219 | 87 | 219 | 20 | ||||
| Stratum 3: mild non-PDR | 58 (34 to 73) | <.001 | 58 (19 to 78) | .009 | ||||
| Intensive therapy | 148 | 31 | 148 | 15 | ||||
| Conventional therapy | 200 | 83 | 199 | 40 | ||||
| Stratum 4: moderate or severe non-PDR | 40 (9 to 60) | .02 | 39 (-3 to 64) | .06 | ||||
| Intensive therapy | 65 | 32 | 50 | 20 | ||||
| Conventional therapy | 126 | 84 | 104 | 59 | ||||
Abbreviations: CI, confidence interval; DCCT, Diabetes Control and Complications Trial; EDIC, Epidemiology of Diabetes Interventions and Complications; PDR, proliferative diabetic retinopathy.
For PDR, strata 1 and 2 were combined in stratified analysis and in adjustment for all-levels-combined analysis because of the low event rate in these 2 strata.
The sample size for all levels is the same as in Figure 2A (n = 1349), based on all EDIC evaluations in all subjects, including those at EDIC years 4 and 10 and those in a quarter of these subjects at other EDIC years, among those patients who were free of scatter photocoagulation during DCCT.
The Weibull model was performed for each stratum and for all levels combined after adjustment for primary/secondary cohort, glycated hemoglobin value at entry to the DCCT, and diabetes mellitus duration at DCCT baseline. Analysis of all levels combined was also adjusted for the level of retinopathy at the end of the DCCT. Hazard reduction is for intensive therapy as compared with conventional therapy.
P values were based on the Wald χ2 test from the Weibull model.
The sample size for all levels is the same as in Figure 3A (n = 1314), based on all EDIC evaluations in all subjects, including those at EDIC years 4 and 10 and those in a quarter of these subjects at other EDIC years, among those patients who were free of PDR during DCCT. Among the 1314, 5 patients who did not have retinopathy evaluation at DCCT closeout were excluded from the stratified analysis.
Figure 2.
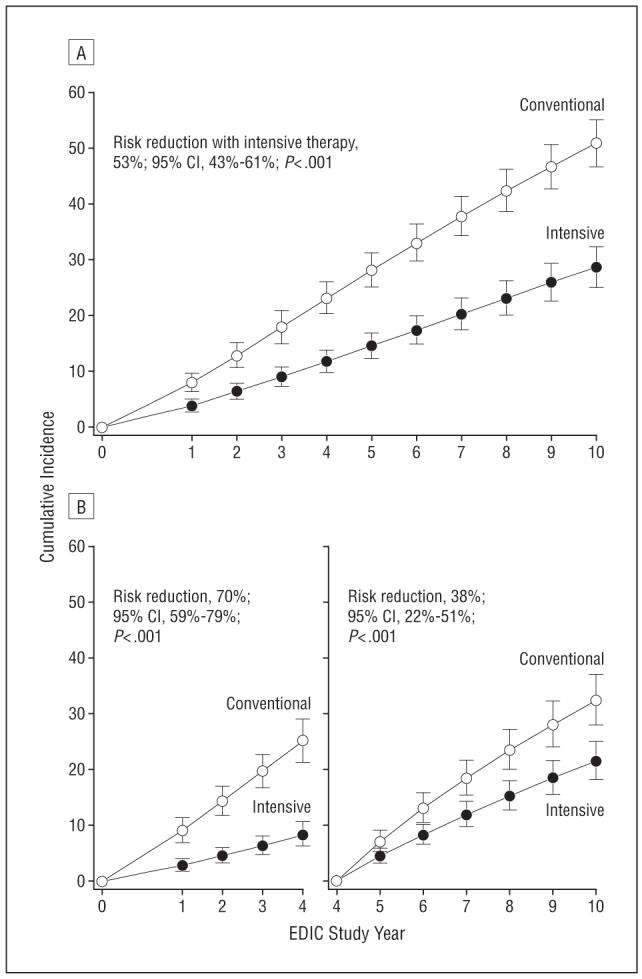
Estimated cumulative incidence of further 3-step progression of retinopathy from Diabetes Control and Complications Trial (DCCT) closeout to Epidemiology of Diabetes Interventions and Complications (EDIC) study year 10 (n=1349) (A) and from DCCT closeout to EDIC year 4 (n=1320) and from EDIC year 4 to EDIC year 10 (n=1105) (B) based on Weibull regression models adjusted for the level of retinopathy at the end of the DCCT, primary vs secondary cohort, glycated hemoglobin value on entry to the DCCT, and diabetes mellitus duration at DCCT baseline. Retinopathy was evaluated in 369 patients during EDIC year 1, 448 in year 2, 430 in year 3, 1225 in year 4 (1997), 338 in year 5, 440 in year 6, 406 in year 7, 204 in year 8, 233 in year 9, and 1211 in year 10 (2003). Subjects with prior scatter photocoagulation during the DCCT were excluded from analyses (26 in the conventional therapy group and 10 in the intensive therapy group). Patients who had further 3-step progression from DCCT closeout as of EDIC year 4 (n=212) and patients who were censored during the interval (n=32) were excluded from the analysis of incidence over years 4 to 10. CI indicates confidence interval.
A Weibull model analysis of the cumulative incidence of PDR or worse among patients who were free of PDR or worse during DCCT had similar results (Figure 3). The risk (hazard) of PDR during the 10 years of EDIC follow-up was reduced by 56% (95% CI, 37%-70%; P<.001), 71% during the first 4 years of EDIC (95% CI, 44%-85%; P<.001), and 46% from EDIC year 4 to 10 (95% CI, 16%-65%; P<.001).
Figure 3.
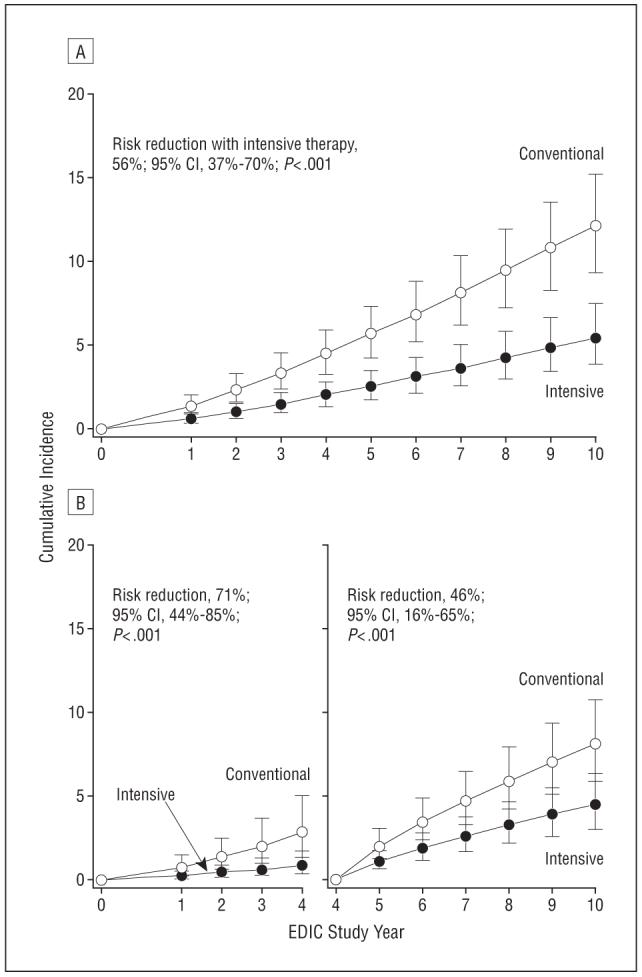
Estimated cumulative incidence of proliferative diabetic retinopathy (PDR) or worse from Diabetes Control and Complications Trial (DCCT) closeout to Epidemiology of Diabetes Interventions and Complications (EDIC) year 10 (n=1314) (A) and from DCCT closeout to EDIC year 4 (n=1285) and from EDIC year 4 to EDIC year 10 (n=1215) (B) based on Weibull regression models adjusted for the level of retinopathy at the end of the DCCT, primary vs secondary cohort, glycated hemoglobin value on entry to the DCCT, and diabetes mellitus duration at DCCT baseline. The sample size is based on all EDIC evaluations in all subjects, including those at EDIC years 4 and 10, and those in a quarter of these subjects at other EDIC years. Patients with prior PDR or worse during the DCCT were excluded from all the analyses (52 in the conventional therapy group and 26 in the intensive therapy group). Patients who had PDR during the first 4 years of EDIC follow-up (n=63) and patients who were censored during the interval (n=36) were excluded from the analysis of incidence over years 4 to 10. CI indicates confidence interval.
Table 3 presents separate Weibull models of the incidence of further 3-step progression and PDR over the 10 years of EDIC follow-up within the strata defined by retinopathy levels at DCCT closeout (EDIC baseline). For all DCCT closeout retinopathy levels, there was an overall benefit over the 10 years, but as the severity of retinopathy increased at DCCT closeout, the relative benefits of DCCT intensive therapy decreased. Whereas Table 3 examines the prolonged protective effect of intensive vs conventional treatment at each retinopathy level, Table 4 examines whether the inclusion of other risk factors attenuates the effects of intervention group. After adjusting for other DCCT baseline and DCCT closeout covariates, the differences between DCCT treatment groups in the risk of further progression of retinopathy remained highly significant (Table 4) (P<.001). Risk of further progression of retinopathy increased significantly with higher HbA1c level at DCCT baseline (19% increase in risk per 1% increase in HbA1c level; P<.001), higher mean blood pressure at DCCT closeout (11% increase in risk per 5 mm Hg-increase in the mean blood pressure; P < .001), and hyperlipidemia at DCCT closeout (70% increase in risk for those with hyperlipidemia vs those without; P=.001).
Table 4. Weibull Proportional Hazards Regression Model of Risk Factors for Further 3-Step Progression of Retinopathy From DCCT Closeout Over 10 Years of EDIC Follow-up in 1349 Patientsa.
| Covariate | χ2 | P Value | Hazard Ratio (95% CI)b |
|---|---|---|---|
| At DCCT entry | |||
| Glycated hemoglobin level at DCCT eligibility | 39.74 | <.001 | 1.19 (1.13-1.26) |
| Cohort (primary vs secondary) | 0.02 | .88 | 1.02 (0.78-1.33) |
| Type 1 diabetes mellitus duration | 3.25 | .07 | 0.97 (0.94-1.00) |
| At DCCT closeout | |||
| Mean blood pressure | 17.50 | <.001 | 1.11 (1.06-1.17) |
| Hyperlipidemia everc | 15.65 | .001 | 1.70 (1.31-2.21) |
| DCCT treatment group, intensive vs conventional | 62.44 | <.001 | 0.46 (0.38-0.56) |
The sample size is based on all EDIC evaluations in all subjects, including those at EDIC years 4 and 10 and those in a quarter of these subjects at other EDIC years, among those patients who were free of scatter photocoagulation during DCCT. The model was also adjusted for the retinopathy levels at the DCCT closeout (P<.001). Significance levels were not affected after adjustment for body mass index, albumin excretion rate, smoking, or neuropathy at DCCT closeout, none of which contributed meaningfully when added to this model (P>.053 for all).
Hazard ratio is the ratio of hazard of retinopathy progression per 1-percentage point increase in glycated hemoglobin level, 1-year increased duration of diabetes mellitus, 5-mm Hg increase in mean blood pressure, or for the dichotomous variable as noted.
Hyperlipidemia is defined as 2 consecutive reports of hypercholesterolemia (low-density lipoprotein cholesterol level >160 mg/dL) or hypertriglyceridemia (triglyceride level >500 mg/dL) within 1 month during DCCT.
RELATION OF PROGRESSION OF RETINOPATHY TO HYPERGLYCEMIA
Another Weibull model assessed the effect of the combined DCCT and EDIC mean HbA1c levels on the risk of further progression of retinopathy among those free of scatter photocoagulation during DCCT. Within each former therapy group, the hazard of further 3-step or more progression of retinopathy during EDIC increased as the mean HbA1c values during the DCCT and EDIC increased, adjusting for cohort, diabetes duration, HbA1c level at DCCT entry, and the level of retinopathy at the end of the DCCT. In the former conventional and intensive therapy groups, there was a 1.9 times greater risk and 2.0 times greater risk, respectively, of further progression of retinopathy for every 10% increase in HbA1c level (eg, from 8.0% to 8.8%) during the DCCT and EDIC (95% CI, 1.8-2.2; P<.001 and 95% CI, 1.8-2.3; P<.001, respectively). The HbA1c level effects on further progression of retinopathy were not significantly different for the 2 former DCCT treatment groups (P=.40).
In additional models that combined both treatment groups and adjusted for mean HbA1c levels during DCCT or for mean HbA1c levels during EDIC separately, 89% of the prolonged effect (R2) of DCCT intensive therapy on further retinopathy progression was explained by the differences in the DCCT mean HbA1c levels, whereas the EDIC mean HbA1c levels explained only 1.6% of the prolonged intensive therapy effect.
DCCT/EDIC Study Research Group
The following persons and institutions participated in the DCCT/EDIC Study Research Group:
Authors
Neil H. White, MD; Wanjie Sun, MS; Patricia A. Cleary, MS; Ronald P. Danis, MD; Matthew D. Davis, MD; Dean P. Hainsworth, MD; Larry D. Hubbard; John M. Lachin, ScD; David M. Nathan, MD.
Study Chairs
S. Genuth; D. M. Nathan; B. Zinman (vice chair); O. Crofford (past).
Group Participants
Albert Einstein College of Medicine: J. Crandall, M. Phillips, M. Reid, J. Brown-Friday, S. Engel, J. Sheindlin, H. Martinez (past), H. Shamoon (past), H. Engel (past); Case Western Reserve University: W. Dahms (deceased), M. Palmert (past), R. Gubitosi-Klug, L. Mayer, S. Pendegras, H. Zegarra, D. Miller, L. Singerman, S. Smith-Brewer, M. Novak, P. Gaston, S. Genuth (past); Cornell University Medical Center: D. Brillon, M. E. Lackaye, V. Reppucci, T. Lee, M. Heinemann (past); Henry Ford Health System: F. Whitehouse, M. McLellan, D. Kruger, J. D. Carey, E. Angus, M. Croswell, A. Galpirn (past); International Diabetes Center: R. Bergenstal, M. Johnson, M. Spencer, K. Morgan, D. Etzwiler (deceased), D. Kendall (past), D. Noller (past); Joslin Diabetes Center: A. Jacobson, E. Golden, R. Beaser, O. Ganda, O. Hamdy, J. Rosenzweig, H. Wolpert, P. G. Sharuk, P. Arrigg, A. Burwood, L. Rand (past); Massachusetts General Hospital: D. M. Nathan, M. Larkin, J. Godine, D. Moore, E. Cagliero, P. Lou, S. Fritz (past); Mayo Foundation: J. Service, G. Ziegler, J. Pach, R. Colligan; Medical University of South Carolina: M. Lopes-Virella, J. Colwell, K. Hermayer, M. Brabham, J. Soule, A. Blevins, J. Parker, D. Lee, P. Lindsey, M. Bracey, K. Lee, M. Nutaitis, A. Farr (past), S. Elsing (past), T. Thompson (past), J. Selby (past), T. Lyons (past), S. Yacoub-Wasef (past), M. Szpiech (past), D. Wood (past), R. Mayfield (past); Northwestern University: M. Molitch, B. Schaefer, L. Jampol, A. Lyon, M. Gill, Z. Strugula, L. Kaminski, J. Shankle, P. Astlesford, D. Blackburn, S. Ajroud-Driss, O. Stone, C. West, I. Burnett-Zeigler; University of California, San Diego: O. Kolterman, G. Lorenzi, M. Goldbaum, K. Harvey, H. Ferreyra; University of Iowa: W. Sivitz, M. Bayless, T. Weingeist, E. Stone, H. Culver Boldt, K. Gehres, S. Russell, J. Bayless, J. Kramer, J. Long, R. Zeither (past); University of Maryland School of Medicine: M. Hebdon, T. Donner, S. Johnsonbaugh, J. Gordon, R. Hemady, A. Kowarski (past), D. Ostrowski (past), T. Donner, S. Steidl (past), B. Jones (past), D. Counts (past); University of Michigan: W. Herman, C. Martin, R. Pop-Busui, A. K. Vine, S. Elner, E. Feldman, J. Albers, D. Greene (past), M. J. Stevens (past); University of Minnesota: J. Bantle, B. Rogness, T. Olsen, E. Steuer (past), P. Rath (past); University of Missouri: D. Hainsworth, S. Hitt, J. Giangiacom, D. Goldstein (past); University of New Mexico: D. Schade, J. Canady, J. M. Schluter, A. Das, D. Hornbeck (past); University of Pennsylvania: S. Schwartz, P. A. Bourne, B. J. Maschak-Carey (past), L. Baker (deceased), S. Braunstein, A. Brucker; University of Pittsburgh: T. Orchard, N. Silvers, C. Ryan, T. Songer, B. Doft, S. Olson, R. L. Bergren, L. Lobes, P. Paczan Rath, D. Becker, A. Drash (past); University of South Florida: A. Morrison, J. Vaccaro-Kish, M. L. Bernal, J. Malone, P. R. Pavan, N. Grove, M. N. Iyer, A. F. Burrows, E. A. Tanaka (past), R. Gstalder (past); University of Tennessee: S. Dagogo-Jack, C. Wigley, H. Ricks, A. Kitabchi, M. B. Murphy, S. Moser, D. Meyer, A. Iannacone, E. Chaum, S. Yoser, M. Bryer-Ash (past), S. Schussler (past), H. Lambeth (past); University of Texas Southwestern University Medical Center: P. Raskin, S. Strowig, R. Ufret, Y-G. He, A. Edwards (past), J. Alappatt (past), C. Wilson (past), S. Park (past); University of Toronto: B. Zinman, A. Barnie, S. MacLean, R. Devenyi, M. Mandelcorn, M. Brent, S. Rogers, A. Gordon; University of Washington: J. Palmer, S. Catton, J. Brunzell, J. Ginsberg, J. Kinyoun, L. Van Ottingham (past); University of Western Ontario: J. Dupre, J. Harth, D. Nicolle, C. Canny (past); Vanderbilt University: M. May, J. Lipps, A. Agarwal, T. Adkins, L. Survant, R. Lorenz (past), S. Feman (past); Washington University, St Louis: N. White, L. Levandoski, I. Boniuk, G. Grand, M. Thomas, D. Burgess, D. Joseph, K. Blinder, G. Shah, J. Santiago (deceased); Yale University School of Medicine: W. Tamborlane, P. Gatcomb, K. Stoessel, K. Taylor (past).
Clinical Coordinating Center
Case Western Reserve University: W. Dahms (deceased), R. Trail, J. Quin, P. Gaston, M. Palmert.
Data Coordinating Center
The George Washington University, Biostatistics Center: J. Lachin, P. Cleary, D. Kenny (past), J. Backlund, W. Sun, B. Rutledge, B. Waberski, K. Klumpp, K. Chan, L. Diminick, D. Rosenberg (past), B. Petty (past), A. Determan (past), C. Williams (past), L. Dews, M. Hawkins.
National Institute of Diabetes and Digestive and Kidney Disease Program Office
C. Cowie; J. Fradkin; C. Siebert (past); R. Eastman (past).
Central Fundus Photograph Reading Center
University of Wisconsin: R. Danis, M. Davis, L. Hubbard, P. Geithman, L. Kastorff, M. Neider, D. Badal, B. Esser, K. Miner, H. Wabers, K. Glander, J. Joyce, N. Robinson, C. Hurtenbach, C. Hannon.
Central Biochemistry Laboratory
University of Minnesota: M. Steffes, J. Bucksa, B. Chavers.
Central Carotid Ultrasound Unit
New England Medical Center: D. O’Leary, L. Funk, J. Polak, A. Harrington.
Central Electrocardiography Reading Unit
University of Minnesota: R. Crow (past), B. Gloeb (past), S. Thomas (past), C. O’Donnell (past); Wake Forest University: R. Prineas, C. Campbell.
Central Neuropsychological Coding Unit
C. Ryan; D. Sandstrom; T. Williams; M. Geckle; E. Cupelli; F. Thoma; B. Burzuk; T. Woodfill.
Central Autonomic Nervous System Reading Unit
Mayo Clinic: P. Low, C. Sommer, K. Nickander.
Computed Tomography Reading Center
Harbor UCLA Research and Education Institute: R. Detrano, N. Wong, M. Fox, L. Kim, R. Oudiz.
External Advisory Committee
G. Weir (chair); C. Clark; R. D’Agostino; M. Espeland; B. Klein; T. Manolio; L. Rand; D. Singer; M. Stern.
Molecular Risk Factors Program Project
Medical University of South Carolina: M. Lopes-Virella, W. T. Garvey, T. J. Lyons, A. Jenkins, R. Klein, G. Virella, A. A. Jaffa, D. Lackland, M. Brabham (past), D. McGee (past), D. Zheng (past), R. K. Mayfield (past).
Genetic Studies Group
Hospital for Sick Children: A. Paterson, A. Boright, S. Bull, L. Sun, S. Scherer (past), B. Zinman (past).
Lipoprotein Distribution/Obesity Group
University of Washington: J. Brunzell, J. Hokanson, S. Marcovina, J. Purnell, S. Sibley, S. Deeb, K. Edwards.
Editor, EDIC Publications
D. M. Nathan.
VISUAL ACUITY 10 YEARS AFTER THE END OF THE DCCT
After 10 years of EDIC follow-up, 4 former intensive therapy patients had a visual acuity worse than 20/200 in 1 eye. None was so affected in both eyes. Only 1 of these 4 patients lost vision owing to diabetic retinopathy. One former conventional therapy group patient had a visual acuity worse than 20/200 in 1 eye at EDIC year 10 owing to PDR.
COMMENT
During the first 10 years of follow-up in the EDIC, the level of glycemic control in the former DCCT therapy groups converged. Based on previous epidemiologic assessments, the small difference in HbA1c values between the former therapy groups would be expected to reduce the relative benefit of intensive therapy that occurred during the DCCT.18 However, progression of retinopathy during the first 4 years of post-DCCT follow-up remained markedly less frequent in the former intensive therapy group, despite an increase in median HbA1c value from 7.2% during the DCCT to 7.9% during the EDIC, than in the former conventional therapy group. Conversely, in the former conventional therapy group, the risk of progression of retinopathy during the first 4 years of EDIC3 remained about the same as during the first 4 years of the DCCT,19 despite a decrease in the median HbA1c value from 9.1% during DCCT to 8.2% during EDIC. The continued separation in retinopathy of the former treatment groups was not merely a reflection of the differences in the severity of retinopathy between the 2 groups at the end of the DCCT, since the reductions in risk of further progression persisted after adjusting for the differences in complications between the 2 therapy groups at DCCT end. DCCT/EDIC has shown a similar prolonged effect of prior intensive therapy on microalbuminuria and albuminuria11 and neuropathy.20
The likelihood of further progression of retinopathy in both groups was strongly associated with the mean HbA1c value during the DCCT and EDIC combined, with a stronger effect of the mean HbA1c value during the DCCT. In the Stockholm Diabetes Intervention Study, the prevalence of severe retinopathy after 7.5 years of follow-up was related to the mean HbA1c value during the first 5 years of follow-up.21
Intensive therapy that maintains near-normal glycemic levels for an average of 6.5 years has a beneficial impact on long-term complications that extends at least 10 years beyond the actual period of such therapy. Moreover, therapy that maintains higher HbA1c levels has adverse effects on complications that persist beyond the period of high HbA1c levels. However, the DCCT/EDIC results should not be interpreted to mean that intensive therapy need only be applied for a limited period. Rather, the results support the implementation of intensive treatment as early in the course of the disease as possible. Stratified Weibull models fitted separately in the 4 retinopathy strata at DCCT closeout (Table 3) reveal that the metabolic memory is waning faster in patients with more severe retinopathy than in those with milder retinopathy, which reinforces the importance of implementing intensive glycemia control as early in the course of the disease as possible.
One potential limitation of the current study is that we did not adjust for other medication use, which might have confounded the results. However, we have shown in previously published analyses that the use of other medications, such as angiotensin-converting enzyme inhibitors and aspirin, was not significantly different between the treatment groups.22
The persistent adverse effects of hyperglycemia and the long-term beneficial effects of lowering glycemia on the development and progression of complications, also shown in animal models of diabetes,23 has been termed metabolic memory. One possible explanation for this phenomenon is the slow accumulation, and subsequent slow degradation, of advanced glycation end products (AGEs).24 DCCT patients in the intensive therapy group had lower concentrations of these substances in skin collagen than did patients in the conventional therapy group.25 The levels of skin collagen AGEs were also associated with the subsequent incidence of progression of retinopathy (and nephropathy) over the first 10 years of EDIC.26 Although the metabolic memory effect is present 10 years after the DCCT, the apparent waning of metabolic memory (“metabolic amnesia”) between EDIC years 4 and 10 may be secondary to a combination of clearance of the long-lasting AGEs in the former conventional group and the accumulation of AGEs in the former intensive treatment group. There are currently no direct data to prove this speculation, and alternative explanations include epigenetic effects of hyperglycemia or a combination of effects.
Acknowledgments
Funding/Support: DCCT/EDIC is sponsored through research contracts from the Division of Diabetes, Endocrinology, and Metabolic Diseases of the National Institute of Diabetes and Digestive and Kidney Diseases, the National Institutes of Health. Additional support is provided by the General Clinical Research Centers Program, National Center for Research Resources, National Institutes of Health, and by Genentech, Inc, through a Cooperative Research and Development Agreement with the National Institute of Diabetes and Digestive and Kidney Diseases.
Biography

Ophthalmological Numismatics
Johann Gottlieb Fabini (Theofil Janos) (1791-1847) was one of the first Hungarian professors of ophthalmology. Fabini, a native of Transylvania, studied medicine in Vienna, Austria, where for 2 years he was assistant to George Beer. While in Vienna, he also had the opportunity to work with Carl von Graefe and William MacKenzie. Returning to Hungary in 1817, he was appointed chair of Ophthalmology at the University of Budapest, where he was to remain for the rest of his career. His primary interests were the diseases of the cornea, which is reflected in his publications in 1830 and 1831, respectively, of Doctrina de morbus oculorum and Praecipius corneae morbis.
In Hungary in 1982, a commemorative medal by Eszter Miro was cast in bronze, 105 mm in diameter. The medal is uniface and depicts Fabini’s clothed facing bust, three-quarters to the left; within the curve at left: FABINI TEOFIL; and within the curve at lower right, the artist’s initials: ME.
Courtesy of: Jay M. Galst, MD, clinical associate professor, New York Medical College, and Peter van Alfen, PhD, associate curator, American Numismatic Society.
Footnotes
Financial Disclosure: None reported.
Trial Registration: clinicaltrials.gov Identifiers: NCT00360815 and NCT00360893.
REFERENCES
- 1.The effect of intensive therapy of diabetes on the development and progression of long-term complications in insulin-dependent diabetes mellitus: the Diabetes Control and Complications Trial Research Group. N Engl J Med. 1993;329(14):977–986. doi: 10.1056/NEJM199309303291401. [DOI] [PubMed] [Google Scholar]
- 2.Epidemiology of Diabetes Interventions and Complications (EDIC): design, implementation, and preliminary results of a long-term follow-up of the Diabetes Control and Complications Trial Cohort. Diabetes Care. 1999;22(1):99–111. doi: 10.2337/diacare.22.1.99. [DOI] [PMC free article] [PubMed] [Google Scholar]
- 3.Retinopathy and nephropathy in patients with type 1 diabetes four years after a trial of intensive therapy: the Diabetes Control and Complications Trial/Epidemiology of Diabetes Interventions and Complications Research Group. N Engl J Med. 2000;342(6):381–389. doi: 10.1056/NEJM200002103420603. [DOI] [PMC free article] [PubMed] [Google Scholar]
- 4.Early Treatment Diabetic Retinopathy Study Research Group Fundus photographic risk factors for progression of diabetic retinopathy: ETDRS report number 12. Ophthalmology. 1991;98(5suppl):823–833. [PubMed] [Google Scholar]
- 5.The effect of diabetes therapy on the progression of diabetic retinopathy in insulin-dependent diabetes mellitus: the Diabetes Control and Complications Trial. Arch Ophthalmol. 1995;113(1):36–51. doi: 10.1001/archopht.1995.01100010038019. [DOI] [PubMed] [Google Scholar]
- 6.Early Treatment Diabetic Retinopathy Study Research Group Photocoagulation for diabetic macular edema: Early Treatment Diabetic Retinopathy Study report number 1. Arch Ophthalmol. 1985;103(12):1796–1806. [PubMed] [Google Scholar]
- 7.Early Treatment Diabetic Retinopathy Study (ETDRS) Manual of Operations. National Technical Information Service; Springfield, VA: 1985. Accession No. PB85223006. [Google Scholar]
- 8.Cohen J. Weighted kappa: nominal scale agreement with provision for scaled agreement or partial credit. Psychol Bull. 1968;70:213–220. doi: 10.1037/h0026256. [DOI] [PubMed] [Google Scholar]
- 9.Fleiss JL. Statistical Methods for Rates and Proportions. 2nd ed. John Wiley; New York, NY: 1981. pp. 38–46. [Google Scholar]
- 10.Steffes M, Cleary P, Goldstein D, et al. Hemoglobin A1c measurements over nearly two decades: sustaining comparable values throughout the Diabetes Control and Complications Trial and the Epidemiology of Diabetes Interventions and Complications study. Clin Chem. 2005;51(4):753–758. doi: 10.1373/clinchem.2004.042143. [DOI] [PMC free article] [PubMed] [Google Scholar]
- 11.Writing Team for the Diabetes Control and Complications Trial. Epidemiology of Diabletes Intervention and Complications Research Group Sustained effect of intensive treatment of type 1 diabetes mellitus on development and progression of diabetic nephropathy: the Epidemiology of Diabetes Interventions and Complications (EDIC) Study. JAMA. 2003;290(16):2159–2167. doi: 10.1001/jama.290.16.2159. [DOI] [PMC free article] [PubMed] [Google Scholar]
- 12.Snedecor GW, Cochran WG. Statistical Methods. 6th ed. Iowa State University Press; Ames: 1980. [Google Scholar]
- 13.Agresti A. Categorical Data Analysis. John Wiley & Sons; New York, NY: 1990. pp. 80–91.pp. 235–236. [Google Scholar]
- 14.Liang K-Y, Zeger SL. Longitudinal data analysis using generalized linear models. Biometrika. 1986;73(1):13–22. [Google Scholar]
- 15.Lachin JM. Biostatistical Methods: The Assessment of Relative Risks. John Wiley & Sons; New York, NY: 2000. [Google Scholar]
- 16.Odell PM, Anderson KM, D’Agostino RB. Maximum likelihood estimation for intervalcensored data using a Weibull-based accelerated failure time model. Biometrics. 1992;48(3):951–959. [PubMed] [Google Scholar]
- 17.Turbull BW. The empirical distribution function with arbitrarily censored and truncated data. J R Stat Soc [Ser B] 1976;38:290–295. [Google Scholar]
- 18.The relationship of glycemic exposure (HbA1c) to the risk of development and progression of retinopathy in the Diabetes Control and Complications Trial. Diabetes. 1995;44(8):968–983. [PubMed] [Google Scholar]
- 19.Early worsening of diabetic retinopathy in the Diabetes Control and Complications Trial. Arch Ophthalmol. 1998;116(7):874–886. doi: 10.1001/archopht.116.7.874. published correction appears in Arch Ophthalmol. 1998;116(11):1469. [DOI] [PubMed] [Google Scholar]
- 20.Martin CL, Albers J, Herman WH, et al. DCCT/EDIC Group Neuropathy among the Diabetes Control and Complications Trial cohort 8 years after trial completion. Diabetes Care. 2006;29(2):340–344. doi: 10.2337/diacare.29.02.06.dc05-1549. [DOI] [PMC free article] [PubMed] [Google Scholar]
- 21.Reichard P. Are there any glycemic thresholds for the serious microvascular complications? J Diabetes Complications. 1995;9(1):25–30. doi: 10.1016/1056-8727(94)00008-c. [DOI] [PubMed] [Google Scholar]
- 22.Nathan DM, Cleary PA, Backlund J-YC, et al. Intensive diabetes treatment and cardiovascular disease in type 1 diabetes mellitus. N Engl J Med. 2005;353(25):2643–2653. doi: 10.1056/NEJMoa052187. [DOI] [PMC free article] [PubMed] [Google Scholar]
- 23.Engerman RL, Kern TS. Progression of incipient diabetic retinopathy during good glycemic control. Diabetes. 1987;36(7):808–812. doi: 10.2337/diab.36.7.808. [DOI] [PubMed] [Google Scholar]
- 24.Vlassara H, Bucala R, Striker L. Pathogenic effects of advanced glycosylation: biochemical, biological and clinical implications for diabetes and aging. Lab Invest. 1994;70(2):138–151. [PubMed] [Google Scholar]
- 25.Monnier VM, Bautista O, Kenny D, et al. Skin collagen glycation, glycoxidation and crosslinking are lower in subjects with long-term intensive vs. conventional therapy of type I diabetes. Diabetes. 1999;48(4):870–880. doi: 10.2337/diabetes.48.4.870. [DOI] [PMC free article] [PubMed] [Google Scholar]
- 26.Genuth S, Sun W, Cleary P, et al. Levels of glycation and carboxymethyllysine in skin collagen predict future 10 year progression of diabetic retinopathy and nephropathy in DCCT/EDIC participants with type 1 diabetes. Diabetes. 2005;54(11):3103–3111. doi: 10.2337/diabetes.54.11.3103. [DOI] [PMC free article] [PubMed] [Google Scholar]