Abstract
A fast T1 measurement sequence using inversion recovery Look-Locker echo-planar imaging at steady state (IR LL-EPI SS) is presented. Delay time for a full magnetization recovery is not required in the sequence, saving acquisition time significantly for high-resolution T1 mapping. Imaging parameters of the IR LL-EPI SS sequence were optimized to minimize the bias from the excitation pulses imperfection and to maximize the accuracy and reliability of T1 measurements, which are critical for its applications. Compared with the conventional inversion recovery Look-Locker echo-planar imaging (IR LL-EPI) sequence, IR LL-EPI SS method preserves similar accuracy and reliability, while saving 20% in acquisition time. Optimized IR LL-EPI SS provided quantitative T1 mapping with 1×1×4 mm3 resolution and whole brain coverage (28 slices) in approximately 4 minutes.
Keywords: Magnetic Resonance Imaging, Fast T1 measurement, Look-Locker echo planar imaging, steady state, parameter optimization
Introduction
Fast measurement of spin-lattice relaxation time constant (T1) has been increasingly popular for determining pathology in brain tissues (1–3). Look-Locker echo planar imaging (LL-EPI) sequence has been commonly used for rapid T1 measurement due to its fast data acquisition (4, 5). The coverage of region-of-interest (ROI), spatial resolution, and temporal resolution are important parameters in the design of acquisition paradigms.
A single-shot EPI with a Look-Locker (LL) acquisition can provide a rapid T1 map within a few seconds (6). Single-shot LL-EPI techniques have limitations when applied to high-resolution (e.g. 256×256 in-plane matrix) imaging with multi-slice coverage of the brain. To overcome the loss of temporal sampling points over an inversion recovery (IR) period due to the multi-slice single-shot EPI imaging, an algorithm of reordering the slice acquisitions was proposed (7). However, the spatial resolution was restricted to approximately 2 mm2 (128×128 matrix). Furthermore, these single-shot EPI approaches suffer from geometrical distortions due to magnetic susceptibility differences between tissue and air/bone, and signal loss from a relatively long echo time (TE). Segmented k-space acquisitions have been applied to retain the optimal temporal resolution with high spatial resolution (256×256) and/or whole brain coverage (8). However, IR segmented LL-EPI approaches need a delay time between the end of the segmented acquisition at steady state and another inversion pulse for the next segmented acquisition. This delay time for a full recovery of longitudinal magnetization from the steady state is a hindrance for rapid T1 mapping. To mitigate this problem, T1 mapping with partial inversion recovery (TAPIR) approach was proposed, which does not require the delay time between segmented acquisitions and the following saturation recovery (SR) pulse (9). However, the additional time between SR and the following IR pulses is still required for high signal-to-noise ratio (SNR). Recent studies proposed that the optimized parameter for the additional time in TAPIR was approximately 2 seconds (10).
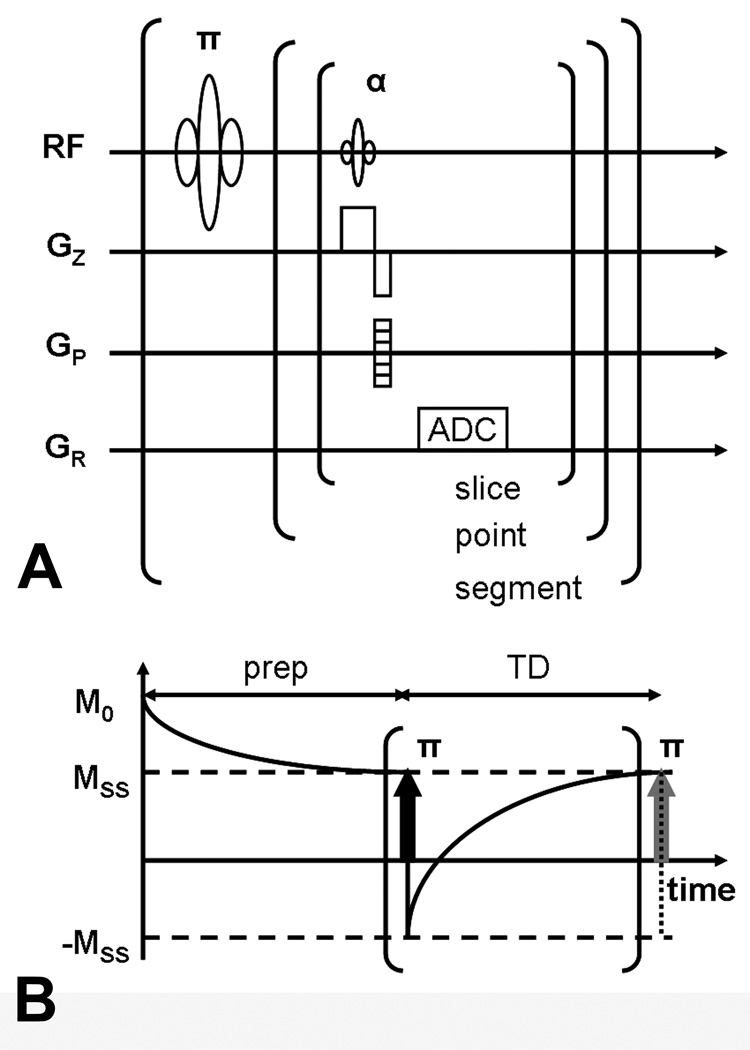
We present here a fast T1 mapping method using a segmented acquisition paradigm of IR LL-EPI, which measures the apparent longitudinal relaxation of magnetization between negative and positive steady states (IR LL-EPI SS). This method does not require the time duration for a full or partial recovery of the magnetization (see Fig. 1), and therefore reduces the total image acquisition time. Potential bias on T1 measurement due to imperfection of the excitation pulses is investigated, and imaging parameters in the IR LL-EPI SS sequence are optimized with flip angle (FA) of 16°, repetition time (TR) of 400ms, and the time duration in data acquisition per inversion period (TD) of 10s. The accuracy and reliability of T1 measurements using IR LL-EPI SS are compared with a conventional IR LL-EPI technique using simulation. In the following text, the conventional IR LL-EPI that requires a delay time between successive inversion pulses in the acquisition is referred to IR LL-EPI, and is thus distinguished from IR LL-EPI SS. Phantom studies are performed to validate the T1 measurement using IR LL-EPI SS and to demonstrate the accuracy and the reliability of the sequence. Finally, high resolution in-vivo T1 mapping with whole brain coverage (28 slices) is presented with 1×1 mm2 in-plane resolution, 4 mm thickness within 4 minutes.
FIG 1.
IR LL-EPI SS sequence diagram (A) and acquisition paradigm (B). After a non-selective inversion pulse, a series of α° excitation RF pulses are applied to acquire partial k-space data (ADC) following the LL acquisition algorithm. Before the first inversion pulse and data acquisition, a series of α° preparation pulses (prep) are applied for TD to make the longitudinal magnetization in each imaging plane approach a steady state.
Methods
T1 measurement using IR LL-EPI SS
The mathematical model for T1 measurement using IR LL-EPI sequences has been well investigated in previous studies (5, 11). In summary, a longitudinal magnetization as a function of time (t) in IR LL-EPI acquisition can be described as
| [1] |
where MSS is the longitudinal magnetization in a steady state, M0 is the equilibrium magnetization, and is the apparent longitudinal magnetization relaxation time constant.
Assuming the transverse magnetization decay following spin-spin relaxation is ignorable (T2 << TR), can be expressed as
| [2] |
where θ is the applied flip angle (FA) and TR is a time interval between two successive data acquisitions in the same imaging slice.
At steady state, MSS is expressed as a function of M0, TR, T1 and θ
| [3] |
The imperfection of the excitation pulses
One of the error sources in the T1 measurement using IR LL-EPI is the imperfection of the FA of the excitation pulses. The efficiency of the excitation pulses has been investigated and its effects on T1 measurement has been reported (12, 13). When the actual FA is defined as γθ, where γ is the efficiency of the excitation pulse, equation [2] can be modified as
| [4] |
where is the measured apparent relaxation rate of longitudinal magnetization. However, measured T1 (T1,m) is calculated without considering the efficiency of the excitation pulses,
| [5] |
Combining equation [4] and equation [5], 1/T1,m can be expressed as
| [6] |
Therefore, the discrepancy between the measured and true T1 values due to imperfection of excitation pulses (1/T1,m − 1/T1) can be expressed as a function of TR, γ, and θ. When an unitless variable, τTR (=TR/T1 ), is introduced, the accuracy of measured R1 due to the imperfect excitation (Aγ) can be expressed as
| [7] |
A previous study showed that the normalized B1 histogram over the whole brain has mean efficiency of approximately 90.0% and full width at half maximum of 8.7% (14). Assuming the B1 histogram follows a normal distribution, the standard deviation (SD) is calculated as 3.69%. Then, 99% of normalized B1 is expected to have efficiency larger than 81.4%. Using equation [7], Aγ was calculated with two γ values, 0.9 and 0.814, which represent the mean and the lowest 99% of the B1 efficiency values, respectively, in brain imaging.
Optimization of accuracy and reliability in the T1 measurement
The relaxation of longitudinal magnetization between negative and positive MSS follows a simple exponential equation over time, . When normalized by MSS, the longitudinal magnetization signal intensity at time t, S(t), can be expressed simply as . Using equation [2] and τTR, S(t) can be described as
| [8] |
When the time duration of data acquisition per IR period, TD, is normalized by T1, another unitless variable, τTD (=TD / T1), is introduced. Therefore, S(TD) can be expressed simply as
| [9] |
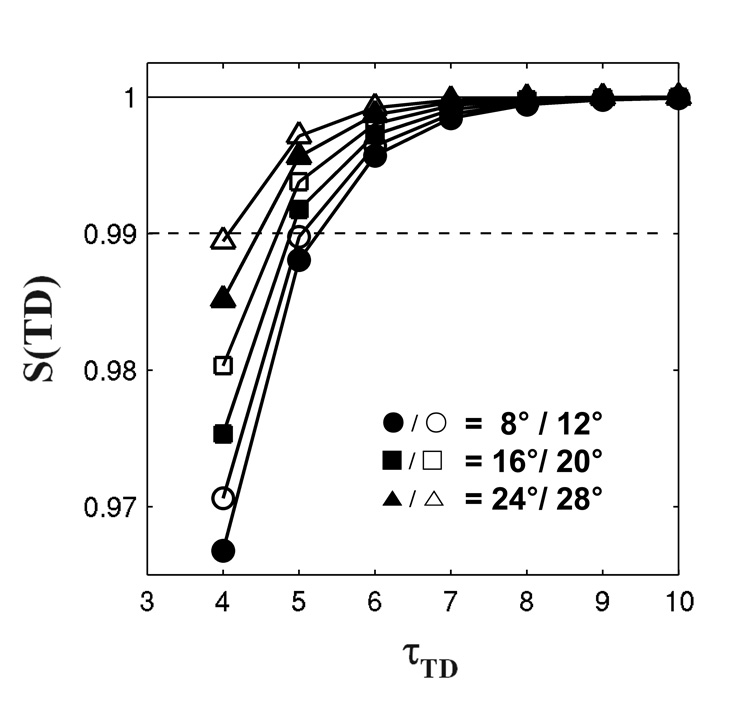
Note that equation [9] represents how close the longitudinal magnetization approaches the steady state at time TD. Figure 2 shows the representative curve of S(TD) with τTR = 0.4. To allow 99% of the longitudinal magnetization to recover at the end of the IR period, τTD should be larger than 6. Assuming brain T1 values at 3T are approximately from 1 s (white matter;WM) to 1.5 s (gray matter; GM)(15), TD values for accurate T1 measurements in brain tissues should be larger than 9 s. Therefore, the optimal TD value was chosen as 10 s, and τTD was consequently set to 6.5 in the simulation.
FIG 2.
Recovery of longitudinal magnetization in an LL sequence as a function of τTD. The relaxation curves show that 99% of the steady-state longitudinal magnetization recovers at the end of the IR period when TD is 6 times longer than expected T1 values for various FAs. The solid line and dashed line represent 100% and 99% of the steady-state signal respectively.
Signal recovery at the acquisition time points was simulated in both IR LL-EPI SS and IR LL-EPI. Monte Carlo simulation (repetition = 104) was performed with various τTR and θ. However, the optimal parameters are dependent on SNR in the IR images. The experimental SNR in GM at steady state with a 90° excitation was used as an index, denoted as SNRSS(θ = 90°,GM). Normalized by expected steady-state signal intensity in GM (assuming T1 value in GM is T1,GM), SNR at the steady state with 90° excitation pulses in GM can be written as;
| [10] |
Experimental noise was added to the simulations as described in (16).
| [11] |
Where,
| [12] |
| [13] |
In the above equations, Mi is the initial longitudinal magnetization normalized by the signal intensity at steady state, and was set to 1 for the simulation of IR LL-EPI SS and M0 / MSS for IR LL-EPI. Parametners, n1 and n2 are randomly chosen numbers from a Gaussian distribution with zero mean and unit variance. n is an integer ranging from 0 to τTD (6.5) / τTR. The time interval between the inversion pulse and the first acquisition pulse (ti) was set to a half of TR in the simulation. SNRSS (θ = 90°, GM) was measured as 28 from a representative GM ROI in the experimental data with whole brain coverage, acquired with a 256 × 192 cm2 FOV, 256 × 192 in-plane matrix, 4mm thickness, TR/TE =400/6.2 ms, and FA = 90°. T1GM was set to 1.5 s in the simulations based on previous studies (15).
Using equations [10–13], MR signals at the acquisition time points were simulated with varying TR and FA. The simulated signal recovery data were fitted to a three-variable mono-exponential equation, using a Levenberg-Marquardt fitting algorithm (MATLAB 7.5, Mathworks, Inc., Natick, MA). Note that the signals were simulated following Eq.[12], therefore τTR (rather than T1) was obtained from the fitting.
The accuracy of the R1 measurement using IR LL-EPI SS, AIRLLEPISS, was defined as (1/T1,IRLLEPISS − 1/T1,true)/(1/T1,true). When TR is multiplied by both nominator and denominator terms, AIRLLEPISS can be calculated by τTR values:
| [14] |
Reliability (or error) of the R1 measurement using IR LL-EPI SS was evaluated by the SD of the fitted τTR normalized by the simulated τTR value
| [15] |
For comparison, accuracy ( AIRLLEPI) and reliability (rSDIRLLEPI) of an IR LL-EPI approach, defined similarly as those of IR LL-EPI SS, were also calculated.
Phantom and in vivo experiments
The accuracy and the reliability of both IR LL-EPI SS and IR LL-EPI approaches were demonstrated in phantom studies. Six phantoms containing different concentrations of Gadolinium solution based on distilled water (0.05, 0.075, 0.1, 0.2, 0.3, and 0.4 m Mol/L) were prepared. MRI scans were performed on a Siemens 3T Allegra scanner (Siemens Medical Solutions, Erlangen, Germany). For measurement of the intrinsic T1 of the phantoms, data were collected using a single-slice, non-selective IR EPI sequence with 10 different inversion times (TIs) ranging from 34 ms to 15000 ms. TR was set to 30 s, sufficient for the full recovery of the longitudinal magnetization, and TE was set to 11 ms. The other imaging parameters were: FA=16°, FOV=256×192 mm2, matrix=64×48, 4mm thickness (voxel size=4×4×4mm3). To minimize potential instrumental instability and the effects of temperature fluctuation due to repeated RF pulses, the intrinsic T1 values of the phantoms were measured twice before and after IR LL-EPI SS and IR LL-EPI scans, and the two measurements were averaged.
The phantoms scans were repeated 10 times with non-selective IR LL-EPI SS and IR LL-EPI sequences in an interleaved order. The center slice of the multi-slice IR LL-EPI SS or IR LL-EPI was aligned to the single slice of the IR EPI imaging acquired for the intrinsic or baseline measurement as described above. Optimal imaging parameters for the LL sequences were determined from the simulations: FA=16°, FOV=256×192 mm2, matrix=256×192, 4mm thickness (voxel size=1×1× 4mm3), 28 slices, bandwidth = 1628 Hz/voxel, TR/TE = 400/6.2 ms, number of lines in k-space per data acquisition = 9, TD= 10 s. An additional delay time of 3 s was inserted for the IR LL-EPI scan before the repeated inversion pulses. Total acquisition time of IR LL-EPI SS and IR LL-EPI were 4 minutes and 5 minutes, respectively. T1 values of the phantoms in the center slice of LL approaches were measured and compared with T1 values measured with IR EPI in six selected ROIs, each encompassing a different tube (note that the center slice of LL approaches is positioned same as the single slice of IR EPI). The accuracy of both LL methods was calculated assuming T1 values measured with IR EPI as baseline. The reliability of both LL methods was assessed by calculating the average SD values in the six ROIs across the 10 LL measurements.
Three healthy subjects were scanned using the non-selective IR LL-EPI SS sequence with the same imaging parameters as in the phantoms. For the validation of T1, the same IR EPI scan was performed as that in the phantom experiment above. Written informed consent was obtained from the participants prior to the experiments in accordance with the protocol approved by the Institutional Review Board of the National Institute on Drug Abuse.
Results
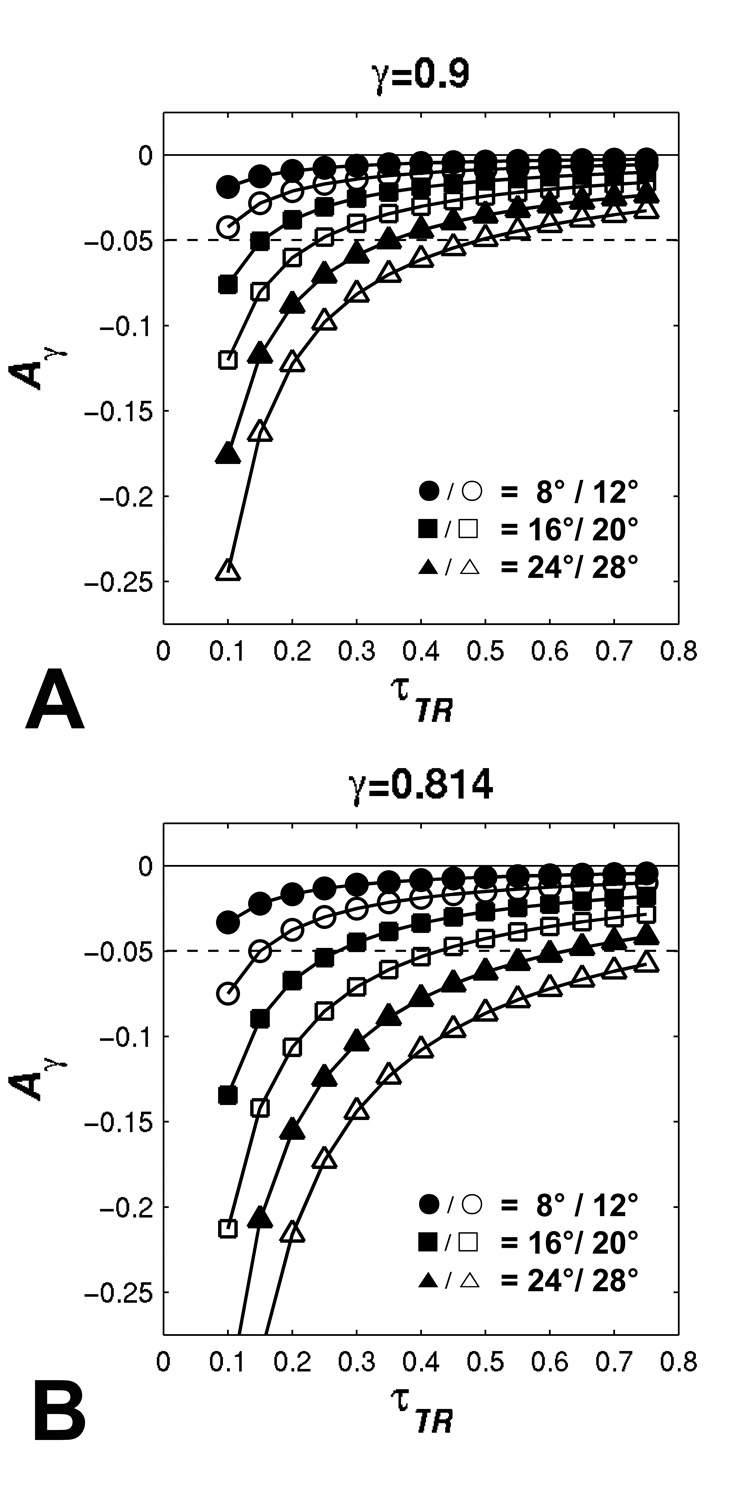
Figure 3 shows the accuracy of R1 measurement of IR LL-EPI SS with excitation efficiencies of 0.9 and 0.814, respectively. When τTR is larger than 0.25, the error is within 5% for γ=0.9 and FA≤20°, and for γ=0.814 and FA≤16°. The bias from the excitation pulse imperfection increases when larger FA and shorter τTR (or TR) are applied.
FIG 3.
The effects of the imperfect efficiency of the excitation pulse on T1 measurement. Two efficiency values (A:γ=0.9, and B:γ=0.814) are simulated. Accuracy as a function of τTR is demonstrated with different FAs, shown as. Dashed lines represent ± 5% of error.
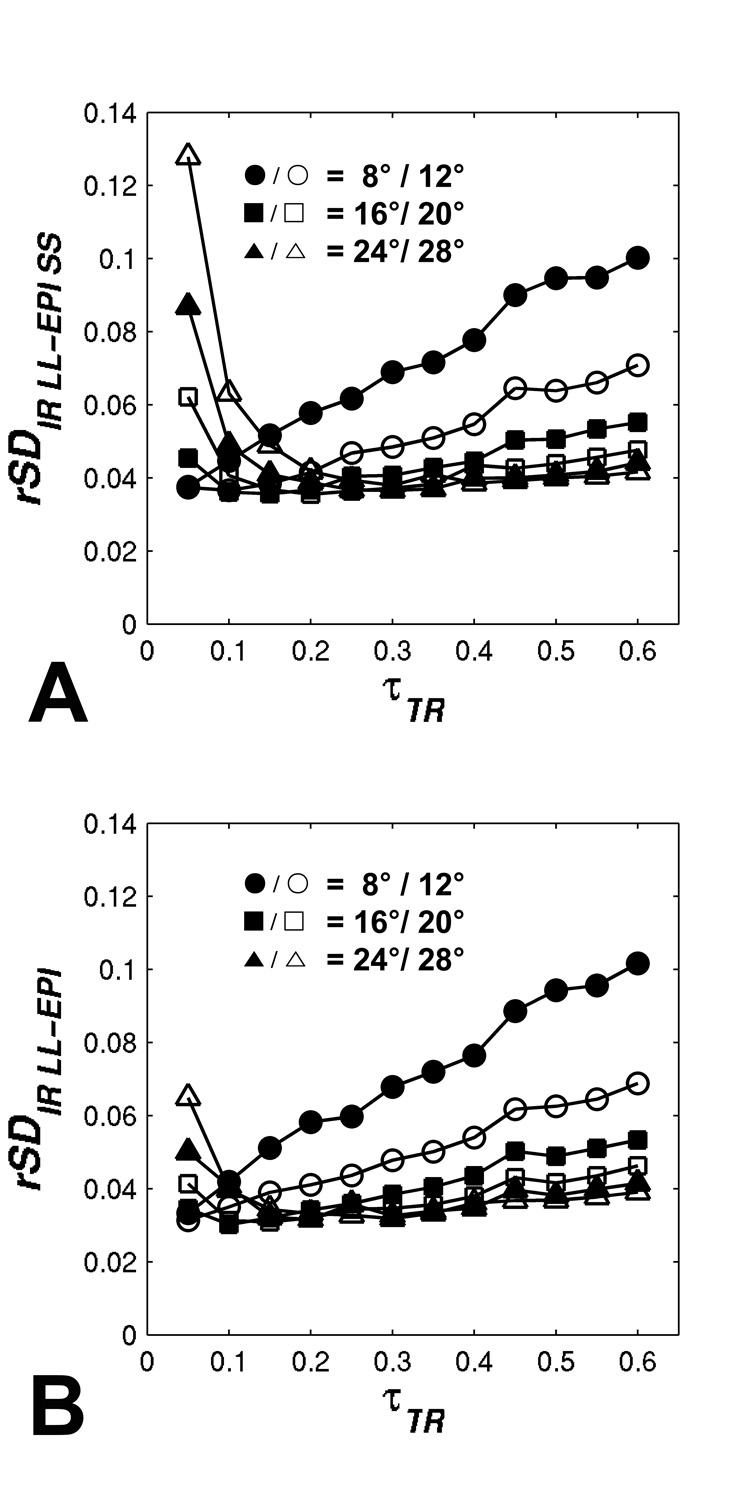
From the result of Monte-Carlo simulation, the accuracies of R1 measurements, averaged across different τTR values using IR LL-EPI SS and IR LL-EPI are listed in Table 1. It is shown that the accuracies of the two methods (AIRLLEPISS and AIRLLEPI) are similar, both below 1 % error when FA ranges from 8° to 32°. Figure 4 depicts the reliability of R1 measurements for both LL methods. When τTR >0.2, the reliability plots of the two methods are very similar, showing a trend of improved reliability at larger FAs. However, the reliability of IR LL-EPI SS at lower τTR (τTR <0.2) is worse than that of IR LL-EPI, especially for larger FAs.
Table 1.
The accuracy of R1 measurements averaged over different τTR values (0.05 < τTR < 0.60) using the IR LL-EPI SS (AIRLLEPISS) and IR LL-EPI (AIRLLEPI).
| Accuracy (%) | Flip angle | ||||||
|---|---|---|---|---|---|---|---|
| 8 ° | 12 ° | 16 ° | 20 ° | 24 ° | 28 ° | 32 ° | |
| AIRLLEPISS | 1.0 ± 0.5 | 0.5 ± 0.3 | 0.4 ± 0.2 | 0.4 ± 0.4 | 0.3 ± 0.3 | 0.4 ± 0.6 | 0.5 ± 0.1 |
| AIRLLEPI | 0.9 ± 0.5 | 0.5 ± 0.3 | 0.4 ± 0.2 | 0.2 ± 0.2 | 0.2 ± 0.2 | 0.2 ± 0.3 | 0.1 ± 0.2 |
FIG 4.
Monte Carlo simulation results of the R1 measurement reliability using (A) IR LL-EPI SS and (B) IR LL-EPI. Different FAs are simulated over varying τTR values.
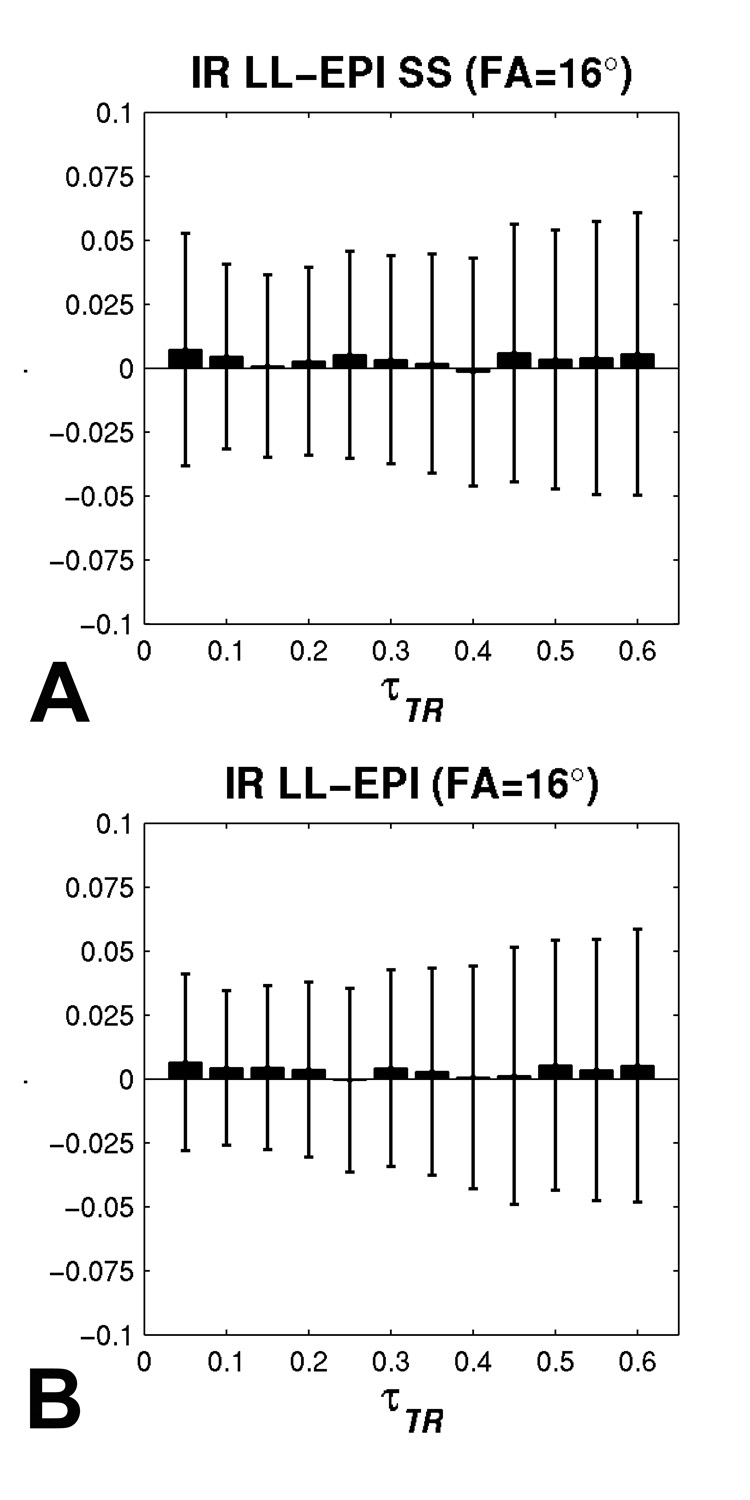
To maximize the accuracy and reliability and to minimize the bias from the excitation imperfection, the optimal FA was determined by analyzing Fig.3 and Fig.4. FA of 16° was chosen by minimizing |Aγ| + 2.33·|rSD| in the range of 0.25≤ τTR ≤0.4. Figure 5 shows the accuracy and reliability of both IR LL-EPI SS and IR LL-EPI as a function of τTR at a FA of 16°. When τTR ranges from 0.25 to 0.4, both IR LL-EPI SS and IR LL-EPI approaches produce high accuracy (~0.2% of error) and good reliability (4.1±0.3% and 3.9±0.4%, respectively). Assuming typical T1 for brain tissues ranges from 1 to 1.5 s at 3T, the optimal TR can be determined to be between 300 ms and 400 ms. Because longer TRs can provide shorter scan time for fixed brain coverage, and are less sensitive to bias from the excitation pulse imperfection (see Table 3), TR of 400 ms and FA of 16° were used as the optimal parameters in the following phantom and in vivo experiments.
FIG 5.
The accuracy and reliability of IR LL-EPI SS (A) and IR LL-EPI (B) are compared as a function of τTR when a FA of 16° is applied. Wide solid bars and error bars represent the accuracy and the reliability, respectively, over different τTR values.
Table 3.
Accuracy and reliability of IR LL-EPI SS with different TRs.
| TR (ms) | lines of readout per acquisition | Total Time (min) | Imaging time per slice (s) | Accuracy (%) | Reliability (%) |
|---|---|---|---|---|---|
| 300 | 5 | 6:40 | 14.3 | 0.4±0.1 | 4.0±0.2 |
| 400 | 9 | 4:00 | 8.6 | 0.2±0.3 | 4.2±0.2 |
| 500 | 11 | 3:10 | 6.8 | 0.3±0.3 | 4.6±0.5 |
Using the optimized parameters, the accuracy and the reliability of both IR LL-EPI SS and IR LL-EPI approaches were measured in phantoms, and the results are shown in Tab. 2. Assuming T1 values measured by IR EPI as a baseline, the accuracy of the high-resolution T1 measurement in both LL methods was within 1.2%, and the reliability of the T1 measurement was 5.2% for IR LL-EPI SS and 5.0% for IR LL-EPI, across the phantoms with a T1 range of 688–1970 ms.
Table 2.
Accuracy and reliability of IR LL-EPI SS and IR LL-EPI in phantom studies
| T1 (ms) | Accuracy (%) | Reliability (%) | |||
|---|---|---|---|---|---|
| IR LL-EPI SS | IR LL EPI | IR LL-EPI SS | IR LL EPI | ||
| Tube 1 | 650 | 1.5 | 0.5 | 5.7 | 5.5 |
| Tube 2 | 736 | 0.8 | 0.2 | 5.2 | 5.3 |
| Tube 3 | 1059 | −1.5 | −1.7 | 5.2 | 5.0 |
| Tube 4 | 1389 | −1.0 | −1.3 | 4.8 | 4.7 |
| Tube 5 | 1701 | −1.2 | −1.4 | 5.3 | 4.8 |
| Tube 6 | 1900 | −3.2 | −3.3 | 5.0 | 4.7 |
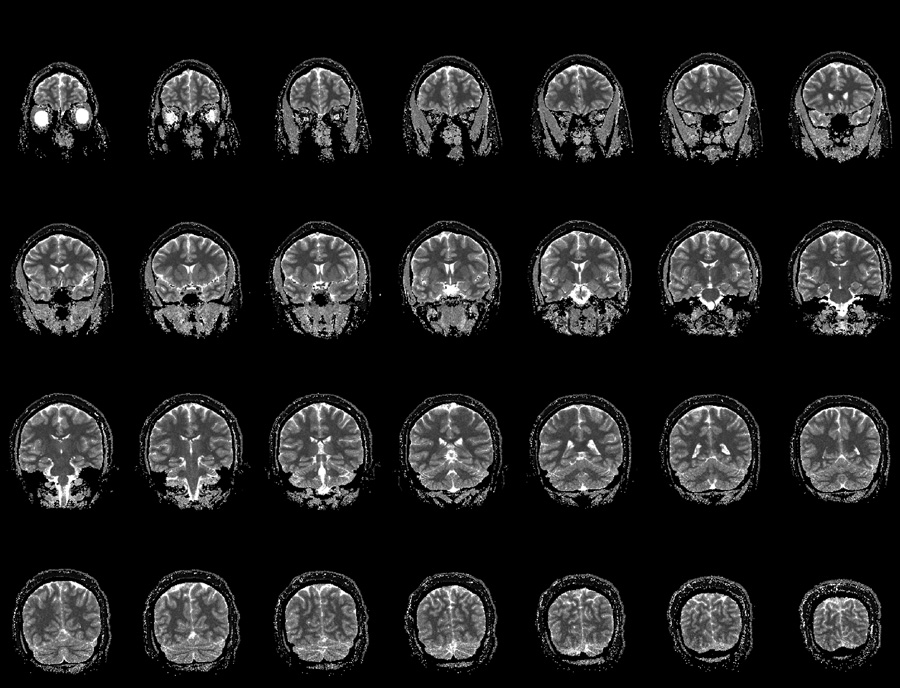
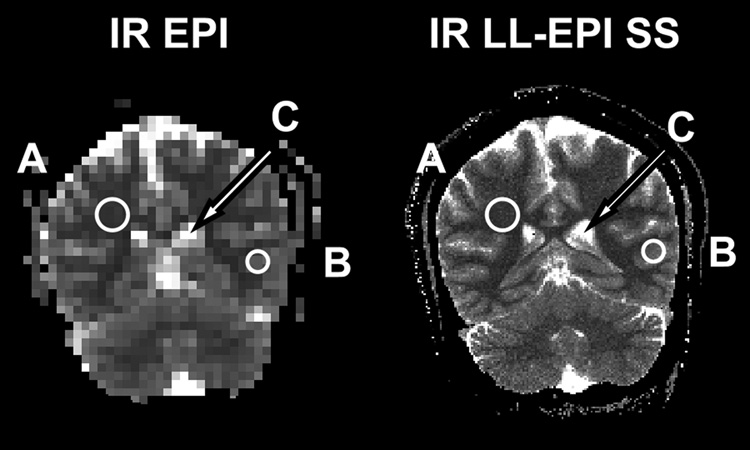
A representative high-resolution in vivo T1 mapping using IR LL-EPI SS with a FA of 16° and a TR of 400 ms is shown in Fig. 6. The total acquisition time covering 28 slices was 4 minutes, or about 8.6 s per slice. Fig. 7 shows a comparison between T1 maps using IR EPI (64×48 matrix) and IR LL-EPI SS (256×192 matrix). Three ROIs were drawn manually in representative regions of WM, GM and CSF. The T1 values were 943±57, 1460±33, and 4391±545 ms in WM, GM, and CSF, respectively, as measured by IR EPI. T1 values measured by IR LL-EPI SS were 964±116, 1465±148, and 4522±417 ms in WM, GM, and CSF, respectively. The two methods showed consistent results, which are also in good agreement with the literature (15, 17).
FIG 6.
A representative T1 maps using IR LL-EPI SS. The maps are scaled from 0 (black) to 3500ms (white). 28 slices of high-resolution T1 mapping (1×1×4 mm3) are obtained in 4 minutes with FA=16° and TR=400ms.
FIG 7.
A comparison of T1 measurements using IR EPI and IR LL-EPI SS. Representative WM (A), GM (B), and CSF (C) ROIs are drawn as shown in the figure. T1 values are measured as 943±57, 1460±33, and 4391±545 ms using IR EPI and 964±116, 1465±148, and 4522±417 ms using IR LL-EPI SS in WM, GM, and CSF, respectively.
Discussion
The basic approach to calculate T1 from a train of LL-EPI acquisitions after an inversion or saturation pulse is to fit the data to an exponential equation, such as . Two distinct methods have been proposed measuring T1 using IR LL-EPI. The first method is to calculate T1 from the measured signal regrowth rate with FA and TR as input variables (see Eq. [2]) (5,13). The other method uses the measured and the ratio of M0 to MSS (18). For convenience, the former method which is dependent on applied flip angle is referred to as the FA dependent method, and the latter as the FA independent method.
Error sources have been investigated for accurate measurement of T1. The efficiency (or imperfection) of the inversion pulse has been reported to be an important error source in T1 measurement. Kingsley et al. demonstrated an imperfect inversion efficiency of 0.85~0.94 in the human brain even with non-selective adiabatic inversion pulses (19). Note that the inversion efficiency invokes directly a proportional bias on T1 measurement in the FA independent method. To correct for the imperfection of inversion pulses, additional scanning is required. Zaitsev et al. proposed a method to map the inversion efficiency for the T1 correction by comparing TAPIR sequences with and without a 180°–180° module after a 90° excitation pulse and preparation time (10). It was shown that inversion efficiency was 0.76 to 0.98 in the human brain, and a maximum T1 error of 24% was observed in the cingulate region when the efficiency was not corrected (10). Imperfection of non-selective adiabatic inversion pulses in the brain is believed to be mainly due to B1 inhomogeneity and the relatively short T2 of brain tissue components (19). Therefore, an additional scan is needed for the correction as proposed (10), which makes running time twice as long. In this study, we used FA dependent method for T1 calculation, which avoided error from M0 measurement due to inversion efficiency.
The excitation pulse efficiency has also been reported to be an important error source for T1 measurement when FA was used as an input variable to measure T1. Samson et al. showed an overall B1 efficiency of approximately 0.9 in the human brain (14). Yarnkh demonstrated B1 variations of 0.88 to 1.04 relative to the nominal B1 (20). The discrepancy between the actual and the specified FAs is mainly due to B1 inhomogeneity and slice-profile imperfection. Mapping B1 inhomogeneity has been used to correct for the bias in T1 measurement. One of the methods for B1 mapping is to measure the actual FA using a dual FA sequence (21), Based on measured FA imaging, T1 correction is feasible (13, 22). However, additional scanning is needed for these methods. In the present study, to achieve shorter acquisition time, we used an approach to minimize the bias in T1 measurement by optimizing imaging parameters, rather than measuring FA maps. Alternatively, IR LL-EPI SS with dual or varying FA could be used to correct for the error in T1 due to an imperfect FA, although the total scanning time would be increased.
The imaging parameter optimization in LL approaches for fast T1 mapping has been investigated in previous studies (11, 23). Crawley and Henkelman derived a relative figure of merit, , where DR is the dynamic range, b is a constant, and Tseq is the duration of the sequence (11). Note that DR is 2×MSS for IR LL-EPI SS, and (M0+MSS) for IR LL-EPI. When Tseq is set to 10 s for IR LL-EPI SS, and 13 s for IR LL-EPI, the relative merit of IR LL-EPI SS is improved by approximately 8% compared to IR LL-EPI with 0.2< τTR <0.4. Kay and Henkelman proposed an optimal FA of 20°, which agrees with our findings (see Fig3-A and Fig.4-B) (23). However, a smaller FA can minimize the bias from the excitation pulses imperfection, which gets severe with low τTR or large T1. In this study, a FA of 16° was chosen as the optimal value. For the simulation results showed that with FA=16°, the accuracy of IR LL-EPI SS and IR LL-EPI are about 0.2% in with 0.2< τTR <0.4. The reliability of IR LL-EPI is slightly higher than that of IR LL-EPI SS (3.9% vs 4.1%). The phantom experiments showed the similar results. In the phantoms with a T1 of 650 to 1900 ms, both LL methods possessed similar accuracy (average error ~1.2%). IR LL-EPI showed slightly better reliability than IR LL-EPI SS (5.0% vs 5.2%). The slight loss of reliability (~5%) using IR LL-EPI SS can be explained by the discrepancy of DR between IR LL-EPI SS and IR LL-EPI. The equation derived by Crawley and Henkelman showed that the reliability is proportional to DR (11). When FA of 16° is applied, the ratio of DR in IR LL-EPI SS to in IR LL-EPI is 94.8% for 0.21 τTR <0.4. However, IR LL-EPI SS reduces the total acquisition time (4 minutes) by approximately 20% as compared with the IR LL-EPI (5 minutes), when a fixed TD of 10 s is used in both methods and an additional delay time of 3 s is added for a full magnetization recovery in IR LL-EPI.
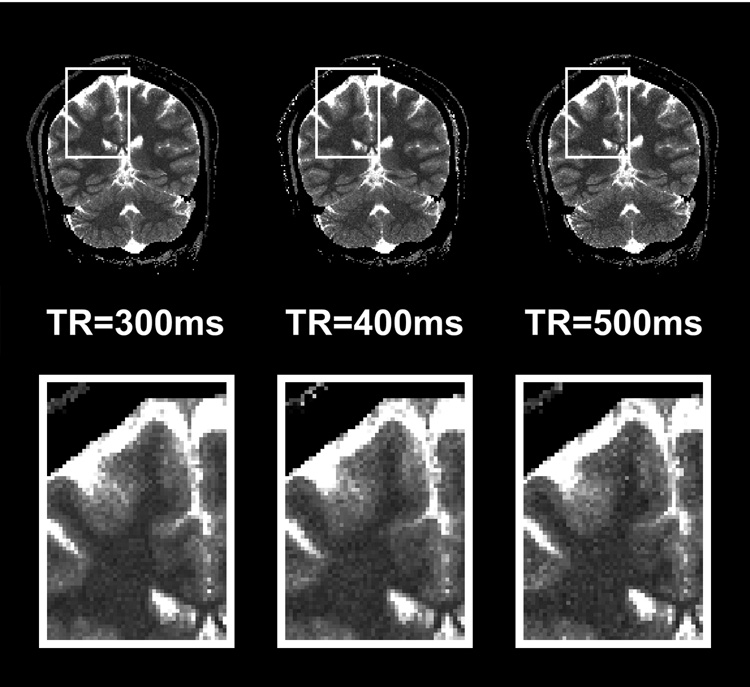
In this study, the optimal imaging parameters for IR LL-EPI SS were chosen as FA=16° and TR=400 ms based on the simulations considering the lowest 99% of FA efficiency (=0.814) experimental SNR (=28) values. However, FA efficiency may dependent on various parameters, such as magnetic field strength, geometry and anatomy of the object, coil type, and characters of the excitation pulse. Therefore, optimization should be performed either on a wider range of RF efficiency or based on specific experiments. For example, T1 mapping using IR LL-EPI SS with a 64×64 or 128×128 matrix size might allow for smaller FA and longer TR values, due to higher SNR, as optimal parameters than high-resolution T1 mapping (256×256). Furthermore, optimization is dependent on the considerations of specific studies. In particular, optimal TR is important for fast high-resolution T1 mapping, because it affects the total acquisition time. When the brain coverage or the number of imaging slices is fixed, a longer TR value allows a larger number of k-space lines readout per acquisition, which leads to less segmentation to fill the k-space, and therefore reduces the total running time. Tab. 3 shows three sets of imaging parameters and the corresponding accuracy and reliability in the range of WM and GM for 28 slices of IR LL-EPI SS scanning, with TR of 300, 400 and 500 ms. These parameters provide similar accuracy across a range of τTR corresponding to T1 values of WM and GM. Relative to the results at TR=400ms, 300 ms TR gives a 9% improvement in reliability, and 500 ms TR losses 10% of reliability. However, the total running time increases by 66% with 300 ms TR, and decreases by 21% with a 500ms TR, compared to 400 ms TR. Fig. 8 compares a representative slice of T1 map from a subject when different TR values were applied. The enlarged T1 maps in the bottom row show that the T1 maps look slightly grainier when TR values are increased. However, the loss of reliability in the T1 map is not dramatic among 300, 400 and 500 ms, which is in agreement with the simulation results in Tab. 3. While a TR of 400 ms is considered optimal in this study, the optimization of TR values might depend on the priority of specific experiments, in which total running time and reliability are considered.
FIG 8.
Representative T1 maps acquired with TR =300, 400, or 500 ms. The total acquisition time for whole brain T1 mapping (28 slices) with these parameters is 6min 40s, 4min, or 3min 10s.
In summary, fast high-resolution T1 mapping can be achieved by the IR LL-EPI SS method, which does not require an additional time delay between inversion pulses and therefore shortens the total acquisition time. Imaging parameters of the IR LL-EPI SS sequence were optimized to minimize the bias from the imperfection of excitation pulses and to maximize the accuracy and reliability of T1 measurement. Compared with IR LL-EPI, the IR LL-EPI SS method preserves similar accuracy and reliability, while saving 20% in acquisition time. The proposed fast T1 mapping technique was demonstrated on in vivo human brains, and provided an imaging time of 8.6 s per slice.
Acknowledgements
This work was supported by the Intramural Research Program of the National Institute on Drug Abuse (NIDA), National Institutes of Health (NIH). The authors would like to thank Dr. Thomas Ross and Dr. Betty Jo Salmeron for helpful discussion, Kimberly Modo and Loretta Spurgeon for recruiting participants, and Eliscia Smith for technical support.
References
- 1.Bos C, Lepetit-Coiffe M, Quesson B, Moonen CT. Simultaneous monitoring of temperature and T1: methods and preliminary results of application to drug delivery using thermosensitive liposomes. Magn Reson Med. 2005;54(4):1020–1024. doi: 10.1002/mrm.20635. [DOI] [PubMed] [Google Scholar]
- 2.Haselgrove J, Moore J, Wang Z, Traipe E, Bilaniuk L. A method for fast multislice T1 measurement: feasibility studies on phantoms, young children, and children with Canavan's disease. J Magn Reson Imaging. 2000;11(4):360–367. doi: 10.1002/(sici)1522-2586(200004)11:4<360::aid-jmri3>3.0.co;2-g. [DOI] [PubMed] [Google Scholar]
- 3.Shin W, Cashen TA, Horowitz SW, Sawlani R, Carroll TJ. Quantitative CBV measurement from static T1 changes in tissue and correction for intravascular water exchange. Magn Reson Med. 2006;56(1):138–145. doi: 10.1002/mrm.20937. [DOI] [PubMed] [Google Scholar]
- 4.Jezzard P, Duewell S, Balaban RS. MR relaxation times in human brain: measurement at 4 T. Radiology. 1996;199(3):773–779. doi: 10.1148/radiology.199.3.8638004. [DOI] [PubMed] [Google Scholar]
- 5.Look DC, Locker DR. Time saving in measurement of NMR and EPR relaxation times. REV SCI INSTRUM. 1970;41:250–251. [Google Scholar]
- 6.Gowland P, Mansfield P. Accurate measurement of T1 in vivo in less than 3 seconds using echo-planar imaging. Magn Reson Med. 1993;30(3):351–354. doi: 10.1002/mrm.1910300312. [DOI] [PubMed] [Google Scholar]
- 7.Clare S, Jezzard P. Rapid T(1) mapping using multislice echo planar imaging. Magn Reson Med. 2001;45(4):630–634. doi: 10.1002/mrm.1085. [DOI] [PubMed] [Google Scholar]
- 8.Henderson E, McKinnon G, Lee TY, Rutt BK. A fast 3D look-locker method for volumetric T1 mapping. Magn Reson Imaging. 1999;17(8):1163–1171. doi: 10.1016/s0730-725x(99)00025-9. [DOI] [PubMed] [Google Scholar]
- 9.Steinhoff S, Zaitsev M, Zilles K, Shah NJ. Fast T(1) mapping with volume coverage. Magn Reson Med. 2001;46(1):131–140. doi: 10.1002/mrm.1168. [DOI] [PubMed] [Google Scholar]
- 10.Zaitsev M, Steinhoff S, Shah NJ. Error reduction and parameter optimization of the TAPIR method for fast T1 mapping. Magn Reson Med. 2003;49(6):1121–1132. doi: 10.1002/mrm.10478. [DOI] [PubMed] [Google Scholar]
- 11.Crawley AP, Henkelman RM. A comparison of one-shot and recovery methods in T1 imaging. Magn Reson Med. 1988;7(1):23–34. doi: 10.1002/mrm.1910070104. [DOI] [PubMed] [Google Scholar]
- 12.Wang J, Mao W, Qiu M, Smith MB, Constable RT. Factors influencing flip angle mapping in MRI: RF pulse shape, slice-select gradients, off-resonance excitation, and B0 inhomogeneities. Magn Reson Med. 2006;56(2):463–468. doi: 10.1002/mrm.20947. [DOI] [PubMed] [Google Scholar]
- 13.Wang J, Qiu M, Kim H, Constable RT. T1 measurements incorporating flip angle calibration and correction in vivo. J Magn Reson. 2006;182(2):283–292. doi: 10.1016/j.jmr.2006.07.005. [DOI] [PubMed] [Google Scholar]
- 14.Samson RS, Wheeler-Kingshott CA, Symms MR, Tozer DJ, Tofts PS. A simple correction for B1 field errors in magnetization transfer ratio measurements. Magn Reson Imaging. 2006;24(3):255–263. doi: 10.1016/j.mri.2005.10.025. [DOI] [PubMed] [Google Scholar]
- 15.Ethofer T, Mader I, Seeger U, Helms G, Erb M, Grodd W, Ludolph A, Klose U. Comparison of longitudinal metabolite relaxation times in different regions of the human brain at 1.5 and 3 Tesla. Magn Reson Med. 2003;50(6):1296–1301. doi: 10.1002/mrm.10640. [DOI] [PubMed] [Google Scholar]
- 16.Donahue KM, Weisskoff RM, Chesler DA, Kwong KK, Bogdanov AA, Jr, Mandeville JB, Rosen BR. Improving MR quantification of regional blood volume with intravascular T1 contrast agents: accuracy, precision, and water exchange. Magn Reson Med. 1996;36(6):858–867. doi: 10.1002/mrm.1910360608. [DOI] [PubMed] [Google Scholar]
- 17.Stanisz GJ, Odrobina EE, Pun J, Escaravage M, Graham SJ, Bronskill MJ, Henkelman RM. T1, T2 relaxation and magnetization transfer in tissue at 3T. Magn Reson Med. 2005;54(3):507–512. doi: 10.1002/mrm.20605. [DOI] [PubMed] [Google Scholar]
- 18.Deichmann R, Haase A. Quantification of T1 Values by SNAPSHOP-FLASH NRM Imaging. J Magn Reson. 1992;96(3):608–612. [Google Scholar]
- 19.Kingsley PB, Ogg RJ, Reddick WE, Steen RG. Correction of errors caused by imperfect inversion pulses in MR imaging measurement of T1 relaxation times. Magn Reson Imaging. 1998;16(9):1049–1055. doi: 10.1016/s0730-725x(98)00112-x. [DOI] [PubMed] [Google Scholar]
- 20.Yarnykh VL. Actual flip-angle imaging in the pulsed steady state: a method for rapid three-dimensional mapping of the transmitted radiofrequency field. Magn Reson Med. 2007;57(1):192–200. doi: 10.1002/mrm.21120. [DOI] [PubMed] [Google Scholar]
- 21.Bottomley PA, Ouwerkerk R. The Dual-Angle Method for Fast, Sensitive T-1 Measurement In-Vivo with Low-Angle Adiabatic Pulses. Journal of Magnetic Resonance Series B. 1994;104(2):159–167. [Google Scholar]
- 22.Venkatesan R, Lin W, Haacke EM. Accurate determination of spin-density and T1 in the presence of RF-field inhomogeneities and flip-angle miscalibration. Magn Reson Med. 1998;40(4):592–602. doi: 10.1002/mrm.1910400412. [DOI] [PubMed] [Google Scholar]
- 23.Kay I, Henkelman RM. Practical implementation and optimization of one-shot T1 imaging. Magn Reson Med. 1991;22(2):414–424. doi: 10.1002/mrm.1910220249. [DOI] [PubMed] [Google Scholar]


