The response observed in some patients with myelodysplastic syndrome following treatment with antithymocyte globulin suggests that the immune system plays a role in at least some of these cases. This paper describes an activated adaptive immune system combined with autologous killer function of NK cells in patients with myelodysplastic syndromes. See related perspective article on page 449.
Keywords: myelodysplastic syndrome, lymphocytes, immune-surveillance, immunetherapy, autologous cytotoxicity
Abstract
Background
An activated immune system has been observed in patients with myelodysplastic syndrome but its exact contribution to disease development and control is not fully clarified. On the one hand an activated and skewed T-cell repertoire has been reported, but on the other hand, decreased natural killer cell function has been found. Immune activation could reflect undesired autoimmune reactions against normal hematopoietic precursor cells as well as effective immune-surveillance against dysplastic clones.
Design and Methods
We have investigated immune effector cells (lymphocyte subsets, lymphocyte activation markers, and natural killer cells) of 40 low and intermediate risk myelodysplastic syndrome patients and compared them to those of 10 age-matched healthy donors. Furthermore, we have analyzed the cytotoxic capacity of effector cells against autologous bone marrow hematopoietic precursor cells of 8 myelodysplastic syndrome patients and 2 healthy donors.
Results
In myelodysplastic syndrome patients, we have found an activated state of lymphocytes, determined by increased percentages of effector T cells with cytotoxic profile, more skewing of the T-cell receptor Vβ (TCR-Vβ) repertoire, and decreased frequencies of regulatory T cells, when compared to healthy donors. The percentage of natural killer cells did not differ between myelodysplastic syndrome patients and healthy donors, but natural killer cells of myelodysplastic syndrome patients expressed increased levels of granzyme B. Finally, we have demonstrated non-MHC restricted autologous cytotoxicity up to 90% against aberrant hematopoietic precursor cells, presumably mediated by natural killer cells.
Conclusions
Our data point to a role for active immune-surveillance in myelodysplastic syndrome, as demonstrated by activated T cells and TCR-Vß skewing. Autologous cytotoxicity against hematopoietic precursor cells was natural killer cell dependent, which points to an additional role for the innate immune system in immune-surveillance of myelodysplastic syndrome patients.
Introduction
Myelodysplastic syndromes are defined as a group of myeloid neoplasms characterized by morphological dysplasia in one or more of the hematopoietic cell lineages. Increased proliferation of hematopoietic precursor cells in the bone marrow is counterbalanced by increased intramedullary apoptosis. This phenomenon is considered to underlie ineffective hematopoiesis which results in refractory peripheral cytopenia.1 MDS patients have a variable risk of transformation to acute myeloid leukemia (AML), which can be estimated by the international prognostic scoring system (IPSS).2 Patients are classified as low-risk, intermediate-1 (int-1) risk, intermediate-2 (int-2) risk or high-risk MDS patients, with a probability to progress to AML within five years of respectively 14%, 28%, 66%, and 100%. Intensive chemotherapy (with or without stem cell transplantation) is mostly offered for int-2 risk, high-risk, and young patients. For low- and for int-1 risk patients and patients not fit for intensive chemotherapy, the main treatment goal is to minimize or prevent transfusion dependency and usually therapy with growth factors like erythropoietin and G-CSF is initiated.
Apart from these two therapeutic options, there could be a role for immunotherapy, other than allogeneic stem cell transplantation. As a consequence of the high apoptotic load of the dysplastic and normal hematopoietic precursor cells, tumor-antigens and auto-antigens might be presented to the immune system and evoke an adaptive immune response. Consequently, activated T cells and clonal T-cell expansions are found in the majority of MDS patients.3–7 However, the exact functional significance of these T cells remains unclear.8 On the one hand, the immune response could be directed to the dysplastic pre-malignant precursor cells and represent immune-surveillance. Evidence for this theory was provided by Sloand et al. who showed in vitro that blasts with trisomy 8 are specifically targeted by autologous T cells in a 14 day culture.9 On the other hand, as a consequence of breaking peripheral tolerance, undesired autoimmune reactivity against normal hematopoietic precursor cells could prevail. This phenomenon (bystander killing) may well explain why patients with trisomy 8 generally respond well to immune suppression. Further evidence for adaptive immune-surveillance has been provided by the observation that leukemia patients with an MDS history have been successfully vaccinated with WT1 peptide based vaccines resulting in an anti-tumor immune response.10
T cells as part of the adaptive immune system have been thought to play the dominant role in immune-surveillance of MDS patients. Innate immune responses against tumor cells have been reported to play a role in immune-surveillance in AML, as was demonstrated by a correlation between decreased NK cell activity and poor prognosis.11,12 In MDS, two groups have demonstrated normal frequencies of NK cells. Although different expression levels of NK activating receptors were reported, both groups reported reduced NK function.13,14
These data point to a primary role for the adaptive immune system in the pathogenesis of MDS, but many questions remain. Only 30% of patients respond to classical immune-suppressive therapy.15,16 Understanding the role of the immune system is crucial to identify patients that will benefit from immune-suppressing therapies,16,17 as well as to correctly monitor patients that will be treated with immune-modulatory agents which are rapidly introduced in the treatment of MDS patients now.
In this study, we investigated the role of the immune system in the pathogenesis of low- and intermediate-risk MDS patients. We have analyzed lymphocyte subsets, lymphocyte activation markers, and NK cells in 40 MDS patients and compared them to healthy donors. We have found an activated state of lymphocytes as illustrated by increased percentages of effector T cells, increased granzyme B and perforin expression, more skewing of the TCR-Vβ repertoire and decreased frequencies of regulatory T cells when compared to healthy donors. Moreover, we demonstrated direct autologous cytotoxicity of effector cells against aberrant hematopoietic precursor cells in vitro. These effector reactions were not MHC class I restricted, but NK cell dependent, which points to a role for the innate immune responses beside the already presumed adaptive immune responses in immune-surveillance of MDS.
Design and Methods
Peripheral blood and bone marrow samples
After obtaining informed consent, peripheral blood samples were drawn from 40 newly diagnosed MDS patients and 10 healthy donors. Flow cytometric analysis of peripheral blood lymphocytes was performed after NH4Cl lysis of erythrocytes. Peripheral blood mononuclear cell fractions (collected through density gradient centrifugation, Ficoll-Paque TMPLUS, Amersham Biosciences) were cryopreserved and used for detection of granzyme B, perforin, FOXP3, and for cytotoxicity assays.
Bone marrow samples were drawn from 8 MDS patients and from 2 healthy donors. Bone marrow mononuclear cell fractions (collected through density gradient centrifugation) were cryopreserved and used for cytotoxicity assays.
Diagnosis, bone marrow morphology by cytology and karyotyping in myelodysplastic syndrome
Diagnosis of MDS was made according to recently proposed criteria.18 Bone marrow aspirates of patients were examined in accordance with World Health Organization (WHO)19 criteria by two independent hematologists (AvdL, GJO), both experienced in MDS diagnosis and classified as refractory anemia (RA); RA with ringed sideroblasts (RARS); refractory cytopenia with multilineage dysplasia (RCMD); RCMD with ringed sideroblasts (RCMD-RS); RA with excess blasts (RAEB-1 or RAEB-2); and MDS unclassified (MDS-U). Conventional karyotyping and recording was assessed according to ISCN guidelines.20 By consensus, at least 20–25 bone marrow metaphases were examined. In certain cases, in which a clear-cut demonstration of clonal aberrations was noted, 10 metaphases were considered to be sufficient. Whenever no metaphases could be analyzed, additional fluorescence in situ hybridization (FISH) was performed according to recently published recommendations.18 Such FISH investigations included 5q31, CEP7, 7q31, CEP8, 20q, CEPY. FISH for p53 was not performed. Good cytogenetic risk profile was defined as normal karyotype, -Y, del(5q), or del(20q). Poor cytogenetic risk profile was defined as abn(7) or abnormalities on ≥ 3 different chromosomes. Intermediate risk profile was defined as no good and no poor cytogenetic risk profile.
Risk assessment and definitions of transfusion dependency and disease progression
Risk assessment was evaluated by IPSS.2 This scoring system includes the number of cytopenias, chromosomal abnormalities, and the percentage of bone marrow blasts. Patients with an IPSS of 0–2 (low, intermediate-1 and intermediate-2 risk) were included in this study. Patients were also classified according to the WPSS (WHO based IPSS), according to a recent proposal,21 with a slight modification (transfusion dependency was defined as transfusion of 3 units of filtrated erythrocytes every four weeks [instead of eight weeks] in a period of least four months). Disease progression was defined as an increase in WHO subgroup to RAEB-2 or AML within 18 months.
Antibodies and flow-cytometry analysis
All directly labeled antibodies (Abs) were purchased from Beckton Dickinson (BD, New Jersey, USA) unless otherwise specified. The following monoclonal Abs were used:
Fluorescein isothiocyanate (FITC) labeled granzyme B (clone GB11), CD3 (SK7), CD34 (8G12), CD45RA (4KB5, Dako Cytomation, Glostrup, Denmark), CD45RO (KCHL-1, Dako Cytomation), anti-HLA-A2 (BB7, MBL, Woburn, USA), CD28 (CD28.1, Dako Cytomation), CD57 (HNK-1), CD4 (SK3), CD16 (DJ130C, Dako Cytomation).
Phycoerythrin (PE) labeled perforin (δG9), FOXP3 (PCH101, eBioscience, San Diego, USA), CD27 (L128), CD58 (L306.4), CD56 (My31), CD16 (3G8, Beckman Coulter, Fullerton, USA), peridinin chlorophyll a protein (PercP) labeled CD4 (SK3), CD8 (SK1), CD45 (2D1).
Allophycocyanin (APC) labeled CD25 (2A3), CD34 (HPCA-2), CD3 (SK7). Alexa Fluor® 647 conjugated granzyme B (BD). All isotype controls were purchased from Dako Cytomation.
Other tools for flow cytometric analysis were: Annexine V (VPS diagnostics, Hoeven, the Netherlands), 7-amino-actinomycin D (7AAD, ViaProbe, BD), TCR-Vβ Repertoire Kit (Beckman Coulter), SYTO16 (Molecular Probes, Eugene, OR, USA).
Mononuclear cell fractions were pre-incubated with 10% human gammaglobuline (6 mg/mL, Sanquin, Amsterdam, the Netherlands), followed by incubation with directly conjugated antibodies. For intracellular staining with granzyme B and perforin, cells were, after surface staining, fixed with PBS/1% paraformaldehyde and permeabilized with PBS/0.05% saponine. For intra-cellular staining of FOXP3, cells were treated with the fixation and permeabilization solutions according to the protocol of the manufacturer. All incubations were performed at room temperature for 15 minutes for extracellular and 30 minutes for intracellular staining. Cells were washed after every incubation step with PBS/0.1% human serum albumin/0.05% sodiumazide and analyzed on a FACS Calibur (BD). At least 25,000 viable cells on a forward scatter were acquired and data were analyzed using CellQuest software (BD). Blasts were defined as CD34+/CD45dim/SSClow. Mean fluorescence intensity index (MFI) was defined by correlating the mean fluorescence (MF) of the population of interest to the MF of isotype control using the formula: [MF (total population of interest) − MF (isotype control)]/MF (isotype control).
Cell viability was measured by combined Annexine V and 7AAD staining. Absolute cell numbers were counted by using fluorescent beads (flow-count TM fluorospheres, Beckmann Coulter).
Flow cytometric cytotoxic assay
The ability of T cells to kill hematopoietic precursor cells was evaluated in a flow cytometric cytotoxicity assay, as previously described.22 Peripheral CD8+ T cells (effector cells) and bone marrow derived CD34+ blasts (target cells) were selected by magnetic separation (positive selection with CD8 and CD34 microbeads respectively, Miltenyi Biotec, Bergisch Gladbach, Germany). During this procedure also CD8dim cells were selected resulting in effector population consisting of CD3+CD8+ T cells (79–94%) and CD3−CD8dim NK cells (6–21%). In additional experiments, NK cells were reduced by magnetic separation with CD16 microbeads. Effector cells were cultured with 104 blasts at different effector to target cell ratios. After six hours of culture, effector cells and blasts were stained with a specific T-cell marker (CD3) and a specific blast marker (CD34) respectively. SYTO16/7AAD staining identified early apoptosis and secondary necrosis. Efflux of SYTO16 particularly in P-glycoprotein (Pgp)–expressing cells, e.g. myeloid leukemia cells, necessitated the addition of PSC833, a Pgp-pump inhibitor, to the assay mixture. MHC restriction of the cytotoxic response was analyzed by pre-incubation of the blasts with an MHC class I–blocking antibody (W6.32, 10 μg/mL for one hour, a kind gift of Dr. S.M. van Ham, Department of Immunopathology, Sanquin Research at CLB, Amsterdam, the Netherlands) and its appropriate isotype control (mouse IgG2a, 10 μg/mL, Sanquin).
Statistical analysis
Statistical analyses were conducted with SPSS 15.0.1 software. To analyze associations between variables Spearman’s correlation coefficient was used. Differences between patient characteristics were analyzed with the Mann-Whitney U (MWU) test or Fisher’s Exact Test (FET).
Results
Patients’ characteristics
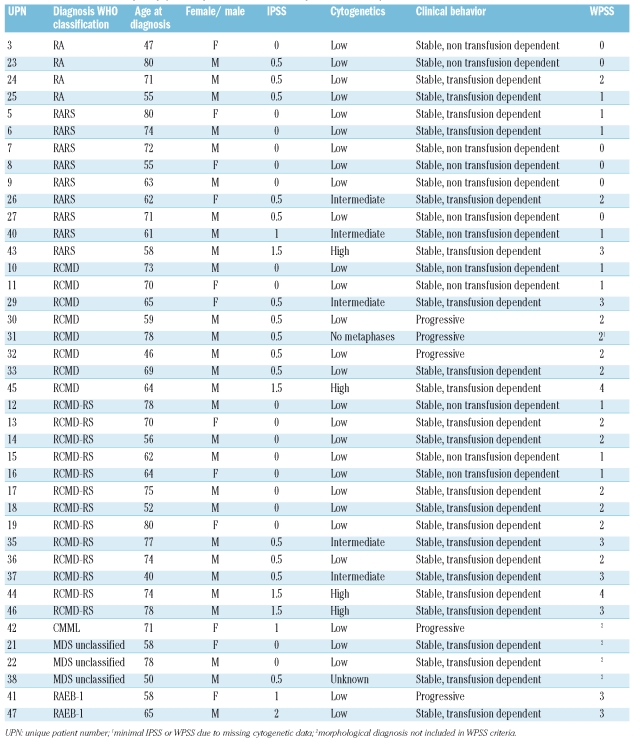
Patients’ characteristics are shown in Table 1. Distribution according to WHO classification is as follows: RA n=4, RARS n=9, RCMD n=8, RCMD-RS n=13, MDS-unclassified n=3, RAEB-1 n=3. Data about IPSS, cytogenetic risk profile, clinical behavior (non-transfusion dependent, transfusion dependent or progressive disease), and WPSS are provided. Median age of the MDS patients at the moment of diagnosis was 67 years (range 40–80 years). All healthy donors were aged over 40 (median age 55 years, range 40–74 years). To rule out any influence from other immune activating conditions, patients with active infections or active auto-immune diseases and patients who received a blood transfusion within three months before diagnosis were excluded.
Table 1.
Characteristics of myelodysplastic syndromes and acute myeloid leukemia patients.
Increased percentages of effector and activated T cells and increased granzyme+ cells in myelodysplastic syndrome
If immune-surveillance of dysplastic hematopoietic precursor cells occurs, this will be most prominent in the bone marrow. We compared bone marrow and peripheral blood samples of 3 patients. The total amount of CD3+ T cells in the bone marrow was lower than in peripheral blood (mean 20% vs. 46%). No significant differences in the peripheral blood and bone marrow derived lymphocyte subsets and activation markers that are described below could be detected. These data demonstrate that analysis of peripheral blood derived lymphocytes is justified.
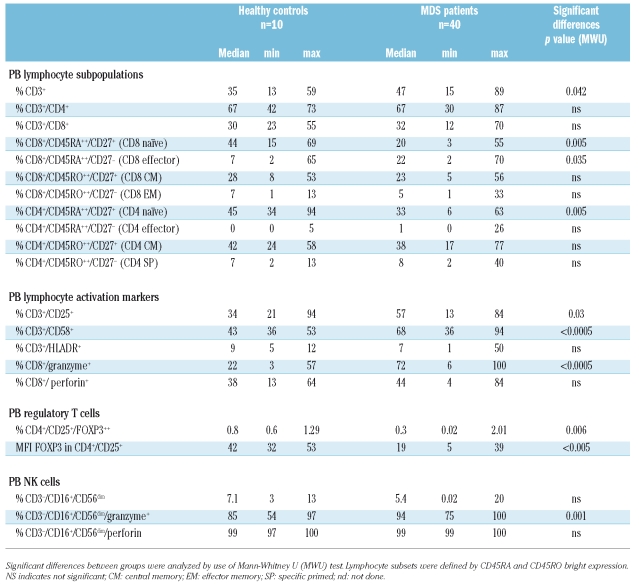
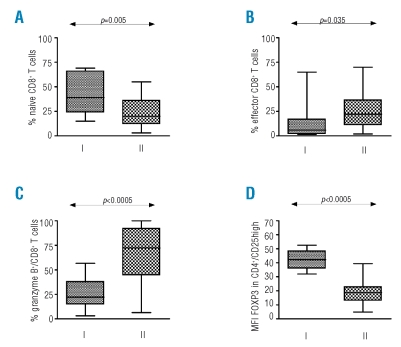
As a result of antigen recognition, naïve T cells proliferate and differentiate into effector T cells and ultimately some of them become memory T cells. Naïve CD8+ T cells lose CD28 and CD27 expression and may acquire CD25, CD57, and CD58 expression when becoming effector cells.23 Memory T cells acquire CD45RO instead of CD45RA. Effector T cells have higher levels of cytotoxic granules containing granzyme B and perforin.24 Subsets of naïve, effector, central memory (CM), effector memory (EM) and specific primed (SP) CD4+ and CD8+ T cells were defined by CD45RA and CD45RO bright expression and described in more detail in Table 2. Although the total percentage of T lymphocytes in MDS patients in peripheral blood was higher, no difference was observed between healthy donors and MDS patients regarding the percentage of CD4+ and CD8+ T cells (Table 2). When analyzing T cell subsets, MDS patients had significantly decreased percentages of naïve CD4+ and CD8+ T lymphocytes and an increased percentage of effector CD8+ T lymphocytes when compared to healthy donor samples (Figures 1 and 2).
Table 2.
Comparison of lymphocyte subsets and activation markers on lymphocytes of myelodysplastic syndrome patients and healthy donors.
Figure 1.
Significant differences between lymphocytes of MDS patients and healthy donors. I refers to healthy donor group, II to MDS patient group (A) Differences in percentage naïve CD8+ cells (CD8+/CD45RA+/CD27+). (B) Differences in percentage effector CD8+ cells (CD8+/CD45RA+/CD27−). (C) Differences in percentage CD8+ granzyme+ T cells. (D) Differences in MFI FOXP3 in regulatory T cells (CD4+/CD25high).
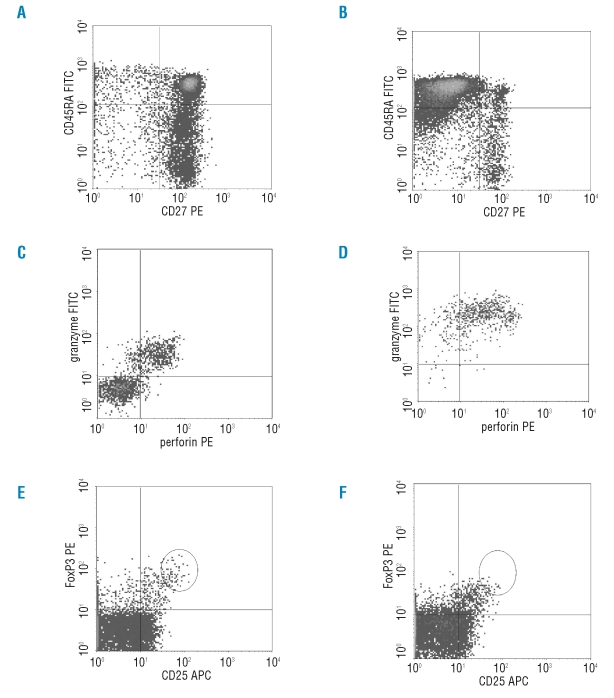
Figure 2.
Representative flow-cytometric examples of differences between lymphocytes of MDS patients and healthy donors. (A) and (B) Differences in naïve and effector CD8+ T cells. (C) and (D) Differences in percentage granzyme B and perforin positive CD8+ T cells. (E) and (F) Differences in percentage and MFI FOXP3 in CD4+/CD25high T cells.
T cells in MDS patients expressed more activation markers such as CD25 and CD58 (Table 2). Moreover, significantly more granzyme B positive CD8+ T cells were found in MDS patients (Figure 1C). These T cells expressed higher levels of cytotoxic granules with granzyme B (measured by mean fluorescence intensity (MFI)) when compared to healthy donors (Figure 2C–D).
NK cells were defined by CD3−/CD16+/CD56dim expression. Percentages of NK did not differ significantly between MDS patients (median 5.4% (0.02–20%) and healthy donors (median 7.1% (3–13%) p=0.28 MWU, Table 2). NK cells of both MDS patients and healthy donors were positive for perforin expression. Remarkably, the expression of granzyme B was significantly higher in NK cells of MDS patients compared to healthy donors (median expression 94% vs. 85.4%, respectively, p=0.001 MWU, Table 2).
In conclusion, when compared to healthy donors, MDS patients had increased percentages of effector and activated T cells and increased percentages of both granzyme positive T cells and NK cells.
Decreased frequencies of T-regulatory cells in myelodysplastic syndrome
We hypothesized that, if the activated immune status in MDS patients is functional, the regulatory T-cell activation should be lower than in healthy donors. We determined the percentage CD4+/CD25high/FOXP3+ T cells, and as only CD4 populations with high FOXP3 levels lack T-helper 1 cytokine production,25 we also determined the MFI of FOXP3.
The percentage of CD25high/FOXP3+ cells was significantly lower in MDS patients as compared to healthy donors (p=0.006). Moreover, the amount of FOXP3 per cell (FOXP3 MFI) was also significantly decreased in CD4+/CD25high cells of MDS patients when compared to healthy donors (p<0.0001) (Table 2, Figure 1 and examples in Figure 2).
In conclusion, MDS patients have decreased frequencies of T-regulatory cells and decreased FOXP3 expression per cell when compared to healthy donors.
Increased T-cell activation status in myelodysplastic syndrome
In the MDS patient group, the level of granzyme B expression correlated significantly to the percentage of effector CD8+ T cells and inversely to the percentage of naïve CD8+ T cells (p<0.0005, correlation coefficient (r)=0.7 and p=0.001, r=−0.5, respectively). Moreover, the percentage of NK cells was inversely correlated to the percentage of naïve CD8+ T cells (p=0.001, r–0.60) and positively to the percentage of granzyme+ CD8+ T cells (p=0.02, r=0.44).
The ratio of effector to naïve CD8+ T cells correlates significantly to the upregulation of other activation markers and adhesion molecules such as CD56, CD57, CD58, CD11c, and HLA-DR. Differences in immune activation status did not correlate significantly to WHO classification or other clinical parameters such as transfusion dependency.
To summarize, in MDS patients, the shift to more effector T cells is accompanied by significant upregulation of granzyme B, perforin expression, adhesion molecules, and activation markers on T cells and to the percentage NK cells. In conclusion, we observed a generally activated and more cytotoxic phenotype of the lymphocytes of MDS patients when compared to healthy donors.
Skewing of TCR-Vβ repertoire in myelodysplastic syndrome
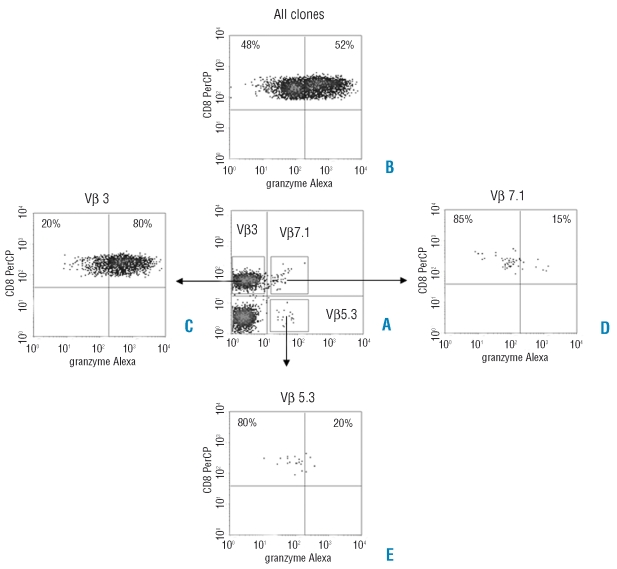
We analyzed the TCR-Vβ repertoire of CD4+ and CD8+ T cells by flow cytometry. Skewed expansions (defined as expression of a Vβ clone above mean +2SD (standard deviation) of normal value) were found in MDS patients as well as in age matched healthy donors. twenty-three percent of MDS patients displayed skewed Vβ expansions in the CD4+ T cell population and 100% of MDS patients showed skewing in CD8+ T cell population compared to 27% (CD4+) and 78% (CD8+) of healthy donors. However, in MDS patients, more highly frequent TCR-Vβ expansions (defined as a Vβ chain expressed at a level above 2 × normal value) were found; 6.5% of patients vs. 0% of donors in the CD4+ T cell population and 43% (MDS) vs. 22% (donors) in the CD8+ T cell population. An example of an MDS patient with a strongly skewed TCR-Vβ repertoire (representing about 50% of all CD8+ T cells) is given in Figure 3A.
Figure 3.
Granzyme B expression in different TCR-Vβ clones. (A) Vβ3 clone is aberrantly over-expressed (44.2%, normal values maximal 13.8%) in CD8+ T cells. (B) Mean percentage of granzyme B expression in all clones is 52%. (C) Granzyme B expression in Vβ 3 is increased when compared to mean percentage of all clones (80% vs. 52%). (D) and (E) Granzyme B expression in normally expressed clones (Vβ7.1 and Vβ5.3) is decreased when compared to mean percentage of all clones (15% and 20% vs. 52%, respectively).
In MDS patients, the number of CD4+ T cells with skewed TCR-Vβ expansions above mean ±2SD inversely correlated to the percentage of naive CD4+ (p<0.0005, r=−0.569) and naïve CD8+ T cells (p=0.001, r=−0.509) and positively correlated to an increased percentage of effector CD4+ T cells (p=0.005, r=0.4444), effector CD8+ T cells (p=0.01, r=0.412), CD3+/CD57+ (p<0.0005, r=0.669), CD3+/CD58+(p<0.008, r=0.418), granzyme B (p<0.0005, r=0.581) and perforin (p<0.008, r=0.435) expression.
In 5 patients we analyzed the granzyme B expression directly in the CD8+ TCR-Vβ skewed T cells. In 4 of these patients, the skewed TCR-Vβ expansion of CD8+ T lymphocytes expressed higher levels of granzyme B when compared to the remnant of unskewed T cells (representative example in Figure 3), indicating that the CD8+ T cells with skewed TCR-Vβ expansions have more cytotoxic capacities when compared to CD8+ T cells with a normal TCR-Vβ repertoire.
In conclusion, CD8+ T cells with a skewed TCR-Vβ repertoire suggestive for clonal expansions (although not proven by CDR3 spectratyping), were predominantly found in the patients with increased levels of effector T cells, granzyme B, perforin, and activation marker expression. CD8+ T cells with a skewed TCR-Vβ repertoire expressed increased levels of granzyme B when compared to CD8+ T cells with a normal TCR-Vß repertoire.
Autologous cytotoxicity towards hematopoietic precursor cells in myelodysplastic syndrome
T cells of MDS patients have been shown to inhibit growth of hematopoietic precursor cells in culture.9,26 To further strengthen our hypothesis of immune-surveillance playing a role in the pathogenesis of MDS, we analyzed the cytotoxic capacity of T cells against autologous hematopoietic precursor cells. We selected 8 patients with different T-cell activation status and different clinical parameters. As control, bone marrow and peripheral blood from 2 healthy donors were used. Peripheral blood derived CD8+ T cells (effector cells) and bone marrow derived CD34+ blasts (target cells) were selected by magnetic separation. CD8+ T cells were cultured with 104 blasts at different effector to target cell ratios. After six hours of culture, apoptosis and secondary necrosis of blasts was determined by staining with CD34 and SYTO16/7AAD.
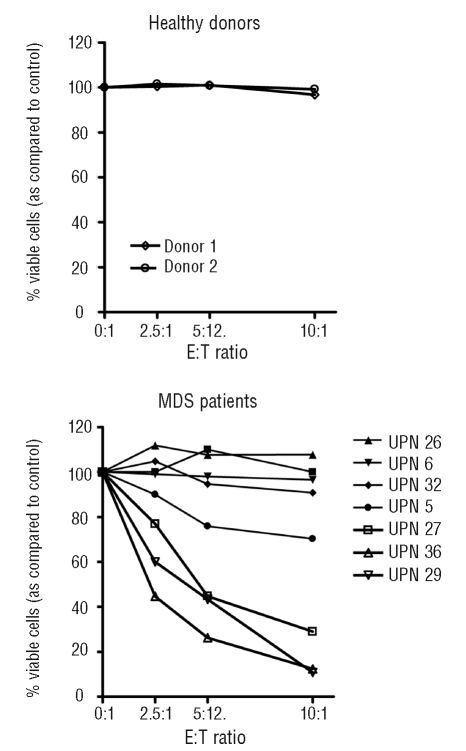
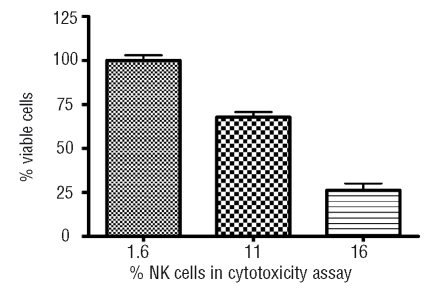
The CD8+ T cells of healthy donors showed no autologous cytotoxicity against hematopoietic precursor cells. In contrast, in 4 out of 8 patients, dose dependent autologous cytotoxicity, from 20% up to 90% when compared to the control sample could be observed (Figure 4). However, MHC class I blocking did not abrogate cytotoxicity. As our effector populations were not pure CD8+ T cells and consisted of various amounts of NK cells (6–21%), we performed additional experiments with samples in which NK cells were removed with CD16 microbeads. These experiments showed that removal of NK cells reduced cytotoxicity (Figure 5). These findings, together with the observation that cytotoxicity against hematopoietic precursor cells was not MHC class I restricted, indicate that NK cells are responsible for at least a part of observed cytotoxicity.
Figure 4.
Autologous T-cell mediated cytotoxicity against hematopoietic precursor cells in 8 MDS patients and 2 healthy controls. Peripheral blood derived CD8+ T cells were co-cultured for six hours with autologous bone marrow derived blasts at different E:T ratios as indicated. Viable blasts were defined as CD34+/7AAD−/SYTO16+.
Figure 5.
Correlation between percentage of NK cells and autologous cytotoxicity against hematopoietic precursor cells. In one patient sample, NK cells were removed by magnetic separation with CD16 microbeads, resulting in reduced cytotoxicity.
The level of cytotoxicity seemed not to be related to WHO classification or IPSS (Table 3). Patients who showed high levels of cytotoxicity were all transfusion dependent, whereas the 2 patients that showed no cytotoxicity were not transfusion dependent. Regarding lymphocyte characteristics, highest levels of effector CD8+ T cells, granzyme B expression and most skewed TCR-Vβ repertoires were found in the patients with highest levels of autologous cytotoxicity.
Table 3.
Characteristics of the patients who were analyzed for autologous cytotoxicity against hematopoietic precursor cells.
In one patient (UPN 5), aberrant CD7 expression was demonstrated on all myeloid CD34+ blasts. It is highly likely that these CD7+ precursor cells represent a dysplastic clone in MDS.27,28 Consequently, cytotoxicity (30%) was directed against these aberrant hematopoietic precursor cells.
In conclusion, we demonstrated autologous cytotoxicity against hematopoietic precursor cells in low-risk MDS patients. Cytotoxicity was not MHC class I restricted, but at least partly NK cell dependent, as removal of NK cells reduced cytotoxicity.
Discussion
It remains unclear whether the altered immune status in MDS patients reflects predominantly undesired autoimmune reactions against normal hematopoietic precursor cells (such as in aplastic anemia) or effective immune-surveillance against dysplastic clones. Several groups have reported increased T-cell activation6,8,29 and decreased NK cell function13,30 in MDS patients. We have set up this study to evaluate the immune status of low-and intermediate-risk MDS patients. First, to provide evidence for the existence of immune-surveillance and secondly to be able to monitor these immune responses upon treatment, since immune modulating drugs are emerging.
If immune-surveillance plays a role in the pathogenesis of MDS, tumor antigens could induce clonal effector CD8+ T-cell expansions with a cytotoxic phenotype. Indeed, when compared to healthy donors, we have found that MDS patients have significantly decreased percentages of naïve CD4+ and CD8+ T cells, significantly increased percentages of effector CD8+ T cells and NK cells with a high cytotoxic phenotype (as measured by the expression of granzyme B and perforin) and increased percentages of CD4+ and CD8+ T cells with a skewed TCR-Vβ repertoire, suggesting clonal T-cell expansion.
Regulatory T cells can counteract immune-surveillance in solid tumors.31 We have demonstrated decreased frequencies of regulatory T cells and decreased FOXP3 expression (MFI) in CD4+/CD25high T cells of MDS patients when compared to healthy donors. It is possible that regulatory T-cell activation during progression to AML increases, as recent publications have reported higher levels of regulatory T cells in AML patients when compared to healthy donors32 and higher levels in high-risk MDS patients when compared to low-risk MDS patients.33
Most interestingly, up to 90% autologous cytotoxicity of effector cells against hematopoietic precursor cells could be demonstrated. We were able to show cytotoxic activity specifically directed against aberrant cells, strongly supporting the existence of immune-surveillance against (pre-)malignant hematopoietic precursor cells. Cytotoxicity was not MHC class I restricted but NK cell dependent, indicating that besides an activated status of the adaptive immune system, innate immune responses play a role in immune-surveillance of MDS. This is in contrast to previous studies demonstrating that NK cell killer function towards cell lines was decreased in MDS.13,30 Killer function towards autologous hematopoietic precursor cells was not tested in these studies. More research is needed to unravel the exact mechanism and activating NK cell receptors that are involved in the autologous cytotoxicity against hematopoietic precursor cells that we have observed in this study.
In this study, we have found an activated state of lymphocytes as evidenced by increased percentages of effector T cells, increased granzyme B expression in T cells and NK cells, increased numbers of T cells with a skewed TCR-Vβ repertoire, and decreased frequencies of regulatory T cells in MDS patients when compared to healthy donors. Moreover, we demonstrate NK cell dependent autologous cytotoxicity against aberrant hematopoietic precursor cells in vitro. The collaboration of innate and adaptive immune responses (via dendritic cell activation), which is well recognized in the defense against pathogens, also seems important in tumor immunology.34 Our findings of an activated adaptive immune system combined with autologous killer function of NK cells supposes that this collaboration results in active immune-surveillance in MDS. Understanding the exact role of immune-surveillance in MDS is of importance as immune modulatory drugs are emerging in the treatment of low- and intermediate-risk MDS patients.
Footnotes
Authorship and Disclosures
LD, JG, AZ, MEDC, and TMW performed experiments; CE collected samples: MEDC analyzed results, made the figures, and wrote the paper; TMW analyzed results; GJO and AAL designed the research.
The authors declare no competing financial interests.
Funding: this study was supported by an unrestricted grant from Roche B.V., the Netherlands.
References
- 1.Corey SJ, Minden MD, Barber DL, Kantarjian H, Wang JC, Schimmer AD. Myelodysplastic syndromes: the complexity of stem-cell diseases. Nat Rev Cancer. 2007;7:118–29. doi: 10.1038/nrc2047. [DOI] [PubMed] [Google Scholar]
- 2.Greenberg P, Cox C, LeBeau MM, Fenaux P, Morel P, Sanz G, et al. International scoring system for evaluating prognosis in myelodysplastic syndromes. Blood. 1997;89:2079–88. [PubMed] [Google Scholar]
- 3.Kook H, Zeng W, Guibin C, Kirby M, Young NS, Maciejewski JP. Increased cytotoxic T cells with effector phenotype in aplastic anemia and myelodysplasia. Exp Hematol. 2001;29:1270–7. doi: 10.1016/s0301-472x(01)00736-6. [DOI] [PubMed] [Google Scholar]
- 4.Epperson DE, Nakamura R, Saunthararajah Y, Melenhorst J, Barrett AJ. Oligoclonal T cell expansion in myelodysplastic syndrome: evidence for an autoimmune process. Leuk Res. 2001;25:1075–83. doi: 10.1016/s0145-2126(01)00083-2. [DOI] [PubMed] [Google Scholar]
- 5.Epling-Burnette PK, Painter JS, Rollison DE, Ku E, Vendron D, Widen R, et al. Prevalence and clinical association of clonal T-cell expansions in myelodysplastic syndrome. Leukemia. 2007;21:659–67. doi: 10.1038/sj.leu.2404590. [DOI] [PubMed] [Google Scholar]
- 6.Melenhorst JJ, Eniafe R, Follmann D, Nakamura R, Kirby M, Barrett AJ. Molecular and flow cytometric characterization of the CD4 and CD8 T-cell repertoire in patients with myelodysplastic syndrome. Br J Haematol. 2002;119:97–105. doi: 10.1046/j.1365-2141.2002.03802.x. [DOI] [PubMed] [Google Scholar]
- 7.Wlodarski MW, Gondek LP, Nearman ZP, Plasilova M, Kalaycio M, Hsi ED, et al. Molecular strategies for detection and quantitation of clonal cytotoxic T-cell responses in aplastic anemia and myelodysplastic syndrome. Blood. 2006;108:2632–41. doi: 10.1182/blood-2005-09-3902. [DOI] [PMC free article] [PubMed] [Google Scholar]
- 8.Meers S, Vandenberghe P, Boogaerts M, Verhoef G, Delforge M. The clinical significance of activated lymphocytes in patients with myelodysplastic syndromes: a single centre study of 131 patients. Leuk Res. 2008;32:1026–35. doi: 10.1016/j.leukres.2007.10.004. [DOI] [PubMed] [Google Scholar]
- 9.Sloand EM, Mainwaring L, Fuhrer M, Ramkissoon S, Risitano AM, Keyvanafar K, et al. Preferential suppression of trisomy 8 compared with normal hematopoietic cell growth by autologous lymphocytes in patients with trisomy 8 myelodysplastic syndrome. Blood. 2005;106:841–51. doi: 10.1182/blood-2004-05-2017. [DOI] [PMC free article] [PubMed] [Google Scholar]
- 10.Oka Y, Tsuboi A, Murakami M, Hirai M, Tominaga N, Nakajima H, et al. Wilms tumor gene peptide-based immunotherapy for patients with overt leukemia from myelodysplastic syndrome (MDS) or MDS with myelofibrosis. Int J Hematol. 2003;78:56–61. doi: 10.1007/BF02983241. [DOI] [PubMed] [Google Scholar]
- 11.Costello RT, Sivori S, Marcenaro E, Lafage-Pochitaloff M, Mozziconacci MJ, Reviron D, et al. Defective expression and function of natural killer cell-triggering receptors in patients with acute myeloid leukemia. Blood. 2002;99:3661–7. doi: 10.1182/blood.v99.10.3661. [DOI] [PubMed] [Google Scholar]
- 12.Fauriat C, Just-Landi S, Mallet F, Arnoulet C, Sainty D, Olive D, et al. Deficient expression of NCR in NK cells from acute myeloid leukemia: Evolution during leukemia treatment and impact of leukemia cells in NCRdull phenotype induction. Blood. 2007;109:323–30. doi: 10.1182/blood-2005-08-027979. [DOI] [PubMed] [Google Scholar]
- 13.Kiladjian JJ, Bourgeois E, Lobe I, Braun T, Visentin G, Bourhis JH, et al. Cytolytic function and survival of natural killer cells are severely altered in myelodysplastic syndromes. Leukemia. 2006;20:463–70. doi: 10.1038/sj.leu.2404080. [DOI] [PubMed] [Google Scholar]
- 14.Epling-Burnette PK, Bai F, Painter JS, Rollison DE, Salih HR, Krusch M, et al. Reduced natural killer (NK) function associated with high-risk myelodysplastic syndrome (MDS) and reduced expression of activating NK receptors. Blood. 2007;109:4816–24. doi: 10.1182/blood-2006-07-035519. [DOI] [PMC free article] [PubMed] [Google Scholar]
- 15.Broliden PA, Dahl IM, Hast R, Johansson B, Juvonen E, Kjeldsen L, et al. Antithymocyte globulin and cyclosporine A as combination therapy for low-risk non-sideroblastic myelodysplastic syndromes. Haematologica. 2006;91:667–70. [PubMed] [Google Scholar]
- 16.Sloand EM, Wu CO, Greenberg P, Young N, Barrett J. Factors affecting response and survival in patients with myelodysplasia treated with immunosuppressive therapy. J Clin Oncol. 2008;26:2505–11. doi: 10.1200/JCO.2007.11.9214. [DOI] [PMC free article] [PubMed] [Google Scholar]
- 17.Saunthararajah Y, Nakamura R, Wesley R, Wang QJ, Barrett AJ. A simple method to predict response to immunosuppressive therapy in patients with myelodysplastic syndrome. Blood. 2003;102:3025–7. doi: 10.1182/blood-2002-11-3325. [DOI] [PubMed] [Google Scholar]
- 18.Valent P, Horny HP, Bennett JM, Fonatsch C, Germing U, Greenberg P, et al. Definitions and standards in the diagnosis and treatment of the myelodysplastic syndromes: Consensus statements and report from a working conference. Leuk Res. 2007;31:727–36. doi: 10.1016/j.leukres.2006.11.009. [DOI] [PubMed] [Google Scholar]
- 19.Vardiman JW, Harris NL, Brunning RD. The World Health Organization (WHO) classification of the myeloid neoplasms. Blood. 2002;100:2292–302. doi: 10.1182/blood-2002-04-1199. [DOI] [PubMed] [Google Scholar]
- 20.Mitelman F ISCN. An International System for Human Cytogenetic Nomenclature. Vol. 2007 Basel, Switzerland: S. Karger; 1995. [Google Scholar]
- 21.Alessandrino EP, la Porta MG, Bacigalupo A, Van Lint MT, Falda M, Onida F, et al. WHO classification and WPSS predict post-transplant outcome in patients with myelodysplastic syndrome: a study from the GITMO (gruppo italiano trapianto di midollo osseo) Blood. 2008;112:895–902. doi: 10.1182/blood-2008-03-143735. [DOI] [PubMed] [Google Scholar]
- 22.Westers TM, Houtenbos I, Schuurhuis GJ, Ossenkoppele GJ, van de Loosdrecht AA. Quantification of T-cell-mediated apoptosis in heterogeneous leukemia populations using four-color multiparameter flow cytometry. Cytometry A. 2005;66:71–7. doi: 10.1002/cyto.a.20146. [DOI] [PubMed] [Google Scholar]
- 23.Rufer N, Zippelius A, Batard P, Pittet MJ, Kurth I, Corthesy P, et al. Ex vivo characterization of human CD8+ T subsets with distinct replicative history and partial effector functions. Blood. 2003;102:1779–87. doi: 10.1182/blood-2003-02-0420. [DOI] [PubMed] [Google Scholar]
- 24.Trapani JA, Smyth MJ. Functional significance of the perforin/granzyme cell death pathway. Nat Rev Immunol. 2002;2:735–47. doi: 10.1038/nri911. [DOI] [PubMed] [Google Scholar]
- 25.Gavin MA, Torgerson TR, Houston E, DeRoos P, Ho WY, Stray-Pedersen A, et al. Single-cell analysis of normal and FOXP3-mutant human T cells: FOXP3 expression without regulatory T cell development. Proc Natl Acad Sci USA. 2006;103:6659–64. doi: 10.1073/pnas.0509484103. [DOI] [PMC free article] [PubMed] [Google Scholar]
- 26.Molldrem JJ, Jiang YZ, Stetler-Stevenson M, Mavroudis D, Hensel N, Barrett AJ. Haematological response of patients with myelodysplastic syndrome to antithymocyte globulin is associated with a loss of lymphocyte-mediated inhibition of CFU-GM and alterations in T-cell receptor Vbeta profiles. Br J Haematol. 1998;102:1314–22. doi: 10.1046/j.1365-2141.1998.00920.x. [DOI] [PubMed] [Google Scholar]
- 27.Ogata K, Yoshida Y. Clinical implications of blast immunophenotypes in myelodysplastic syndromes. Leuk Lymphoma. 2005;46:1269–74. doi: 10.1080/10428190500142155. [DOI] [PubMed] [Google Scholar]
- 28.van de Loosdrecht AA, Westers TM, Westra AH, Drager AM, van der Velden VH, Ossenkoppele GJ. Identification of distinct prognostic subgroups in low- and intermediate-1-risk myelodysplastic syndromes by flow cytometry. Blood. 2008;111:1067–77. doi: 10.1182/blood-2007-07-098764. [DOI] [PubMed] [Google Scholar]
- 29.Kochenderfer JN, Kobayashi S, Wieder ED, Su C, Molldrem JJ. Loss of T-lymphocyte clonal dominance in patients with myelodysplastic syndrome responsive to immunosuppression. Blood. 2002;100:3639–45. doi: 10.1182/blood-2002-01-0155. [DOI] [PubMed] [Google Scholar]
- 30.Epling-Burnette PK, Bai F, Painter JS, Rollison D, Salih HR, Krusch M, et al. Reduced natural killer (NK) function associated with high-risk myelodysplastic syndrome (MDS) and reduced expression of activating NK receptors. Blood. 2007;109:4816–24. doi: 10.1182/blood-2006-07-035519. [DOI] [PMC free article] [PubMed] [Google Scholar]
- 31.Beyer M, Schultze JL. Regulatory T cells in cancer. Blood. 2006;108:804–11. doi: 10.1182/blood-2006-02-002774. [DOI] [PubMed] [Google Scholar]
- 32.Wang X, Zheng J, Liu J, Yao J, He Y, Li X, et al. Increased population of CD4(+)CD25(high), regulatory T cells with their higher apoptotic and proliferating status in peripheral blood of acute myeloid leukemia patients. Eur J Haematol. 2005;75:468–76. doi: 10.1111/j.1600-0609.2005.00537.x. [DOI] [PubMed] [Google Scholar]
- 33.Kordasti SY, Ingram W, Hayden J, Darling D, Barber L, Afzali B, et al. CD4+CD25high Foxp3+ regulatory T cells in myelodysplastic syndrome (MDS) Blood. 2007;110:847–50. doi: 10.1182/blood-2007-01-067546. [DOI] [PubMed] [Google Scholar]
- 34.Ghiringhelli F, Apetoh L, Housseau F, Kroemer G, Zitvogel L. Links between innate and cognate tumor immunity. Curr Opin Immunol. 2007;19:224–31. doi: 10.1016/j.coi.2007.02.003. [DOI] [PubMed] [Google Scholar]


