Abstract
In this study, scaling down nanosuspension production to 10 mg of drug compound and evaluation of the nanosuspensions to 1 mg of drug compound per test were investigated. Media milling of seven model drug compounds (cinnarizine–indomethacin–itraconazole–loviride–mebendazole–naproxen–phenytoin) was evaluated in a 96-well plate setup (10, 20, and 30 mg) and a glass-vial-based system in a planetary mill (10, 100, and 1,000 mg). Physicochemical properties evaluated on 1 mg of drug compound were drug content (high-performance liquid chromatography), size [dynamic light scattering (DLS)], morphology (scanning electron microscopy), thermal characteristics (differential scanning calorimetry), and X-ray powder diffraction (XRPD). Scaling down nanosuspension production to 10 mg of drug compound was feasible for the seven model compounds using both designs, the planetary mill design being more robust. Similar results were obtained for both designs upon milling 10 mg of drug compound. Drug content determination was precise and accurate. DLS was the method of choice for size measurements. Morphology evaluation and thermal analysis were feasible, although sample preparation had a big influence on the results. XRPD in capillary mode was successfully performed, both in the suspended state and after freeze-drying in the capillary. Results obtained for the latter were superior. Both the production and the physicochemical evaluation of nanosuspensions can be successfully downscaled, enabling nanosuspension screening applications in preclinical development settings.
Key words: ball mill, media milling, nanosizing, nanosuspensions, scaling down, well plate
INTRODUCTION
The fact that new drug candidates are becoming more hydrophobic and hence less water soluble imposes challenges to obtain adequate oral bioavailability (1). As a result, formulation efforts have become more focused in overcoming the inherent poor aqueous solubility of drug compounds. Examples of such formulation strategies are complexation (2), solid dispersions (3), lipid formulations (4), and particle size reduction (5). The latter strategy has evolved from micronization to nanonization during the last decade. Nanonization or the formulation of drugs as submicron-sized drug nanocrystals has rapidly grown to a mature drug delivery strategy, with currently five commercial products based on the technology (6). From the possible technologies for the manufacture of drug nanocrystals, media milling is currently the method of choice, with four of the five commercial products relying on this approach. Media milling consists of mechanical attrition of drug particles using milling media such as glass, (yttrium-stabilized) zirconium oxide, or highly cross-linked polystyrene resins (7). Since the process is conducted in aqueous suspension, nanosuspensions are obtained upon successful production. To prevent agglomeration of the drug particles, addition of a suitable stabilizer to the suspension is a necessity.
Early identification of enabling formulation approaches helps to guide molecules through preclinical development. Traditionally, formulation efforts are situated during development stages, where compound availability is relatively large. In the preformulation stage and during late discovery, in contrast, compound availability is scarce. Therefore, formulation development in these stages should be performed on minute amounts of drug compound, preferentially in a screening approach. During the last years, an increased interest in the downscaling of different formulation strategies can be noted, illustrated by reports published on the matter [e.g., (8–12)] and commercial activity developed around it (e.g. Avantium, http://www.avantium.com/index.php, accessed 26 May 2008; Symyx, http://www.symyx.com/index.php, accessed 26 May 2008; TransForm Pharmaceuticals, http://www.transformpharma.com/, accessed 26 May 2008).
For nanosuspension process development purposes, the Nanomill® System has been reported (6). However, the working capacity of the smallest chamber is 10 ml, which makes screening studies difficult when compound supply is low. In the same manuscript, the lack of a sufficiently downscaled system to support discovery was acknowledged. However, nanosuspension production by media milling is characterized by its ease of scale-up (7), making results generated on nanosuspensions in downscaled designs valuable. When looking into the literature, we found only one reference in patent literature on the downscaling of media milling (13). The document describes media milling on minute amounts of drug compound. In the examples provided in the document, milling is performed in 24- or 48-well plates. The focus lies on the production of nanosuspensions; and, unfortunately, a thorough physicochemical characterization on these small amounts of nanosuspensions is not included in the document. However, for a downscaled process, production of minute amounts of nanosuspension should be complemented with a thorough physicochemical characterization on small amounts of sample. Examples of important physicochemical evaluation methods of nanosuspensions and/or nanoparticles include size, drug content, morphology, thermal characteristics, and X-ray powder diffraction (XRPD) (14). In a parallel screening design, such a process would enable a rapid optimization of nanosuspension production for compounds in preclinical development. Examples of screening parameters that can be evaluated include the drug content, stabilizer type, stabilizer content, and type and amount of milling material used for nanosuspension production.
In this study, downscaling production and evaluation of nanosuspensions were investigated. For nanosuspension production, two different milling designs were evaluated that allow parallel production of nanosuspensions for screening purposes. Amounts of drug compound used for nanosuspension production were as low as 10 mg per experiment, an amount of drug on which a thorough physicochemical characterization is still possible. The first design evaluated was a 96-well plate setup and was chosen based on the fact that well plates can be easily integrated into a high-throughput setting. The second design consists of a glass-vial-based system in a planetary mill, as medium- and low-energy mills have previously been described for their capability in obtaining nanosuspensions [e.g., (15–20)]. For both milling designs, milling kinetics were studied for the model compound loviride (LOV), to evaluate a suitable end point of the milling process. Subsequently, a 24-h end-point milling experiment was performed for six other compounds [cinnarizine (CIN), indomethacin (IND), itraconazole (ITR), mebendazole (MEB), naproxen (NAP), and phenytoin]. The set of compounds covers broad ranges of different physicochemical parameters [molecular weight (230–706 g/mol), melting point (120–295°C), logP (2.3–8.5), aqueous solubility (0.3–31 μg/ml), and density (1.13–1.44 g/ml)] and was chosen to test the general applicability of the approach. The stabilizing system chosen for all nanosuspensions was 25 wt.% of d-α-tocopherol polyethylene glycol 1,000 succinate (TPGS), based on previous results with this system on the model drug compounds used. To make a thorough physicochemical characterization possible on 10 mg of drug compound, the amount of drug compound used for a single evaluation was limited to 1 mg of drug compound. Evaluation of the value of the different characterization tools was either done based on available literature or through experimental data generated on the loviride nanosuspension.
MATERIALS AND METHODS
Materials
TPGS (Eastman Chemical Company, Kingsport, TN, USA) was a gift from the manufacturer. Loviride and itraconazole were kindly provided by Johnson & Johnson Pharmaceutical Research and Development (Beerse, Belgium). Cinnarizine (Certa n.v., Braine-l’Alleud, Belgium), indomethacin (Certa n.v., Braine-l’Alleud, Belgium), mebendazole (Certa n.v., Braine-l’Alleud, Belgium), naproxen (Certa n.v., Braine-l’Alleud, Belgium), phenytoin (Fagron NV, Waregem, Belgium), acetonitrile gradient grade far UV (Fisher Scientific UK Limited, Loughborough, UK), yttrium-stabilized zirconia (∅ 0.5 mm, YTZ® grinding media, Tosoh Corporation Advanced Ceramics Department, Tokyo, Japan), UV-star 96-well plates (Greiner Bio-One International AG, Frickenhausen, Germany) were obtained commercially. Demineralized water was used for all formulations (Elga, maxima ultrapure water, ≥18 MΩ).
Media Milling
Formulation and Study Design
For the production of all nanosuspensions, the following formula was used as starting suspension (weight-based): one part of drug compound, 0.25 parts of TPGS as a stabilizer, five parts of water. To this suspension, 15 parts of ∅ 0.5-mm yttrium-stabilized zirconium beads were added as a milling agent. For the study of particle size reduction upon milling with loviride, milling was performed for 0.25, 0.5, 1, 2, 4, 8, 16, and 24 h for the different milling designs (“Media Milling in 96-Well Plates” and “Media Milling Using the Ball Mill Design”). For the end-point evaluations of the different compounds, milling was performed for 24 h. Particle size was measured by dynamic light scattering (DLS, “Determination of Particle Size by Dynamic Light Scattering”). Each formulation was evaluated in duplicate for the 24-h end-point experiment and the average and range were calculated.
Media Milling in 96-Well Plates
After addition of the starting suspension and milling beads into the 96-well plates, the plates were closed with an aluminum seal. Subsequently, the plate was fixed on an orbital shaker (KS 125 basic, IKA®-WERKE GmbH and Co., Staufen, Germany) and milling was performed at 900 rpm. At the predetermined sampling times, the aluminum cover of the wells was pierced and 6.0 μl of sample was withdrawn with a pipette.
Media Milling Using the Ball Mill Design
Media milling was conducted in sealed vials of different sizes containing the starting suspensions and milling beads. Nylon vial holders that fitted into 500-ml mixing bowls were designed to allow milling of the vials in the ball mill. For each type of vial, the distance of the vial to the center of the holder was set at a fixed distance to obtain the same milling conditions for all vials. Up to four mixing bowls were then placed into the grinding stations of a planetary mill (Retsch PM 400 MA, Retsch GmbH, Haan, Germany) and milling was performed at 250 rpm.
Determination of Particle Size by Dynamic Light Scattering
For the measurement of the particle size of the nanosuspensions, DLS was used. DLS was performed using a Nanophox instrument in autocorrelation mode (SympaTec GmbH, Clausthal-Zellerfeld, Germany). Prior to measurement, samples were diluted with a saturated solution of the compound under investigation. Saturated solutions were prepared by filtration of a drug suspension after 12 h of equilibration under stirring conditions, through a 0.45-μm-nylon 47-mm-membrane filter (Millipore Corporation, Bedford, MA, USA). Detection was carried out at a scattering angle of 90°; sample temperature was set at 25°C and three runs of 30 s were performed on each sample. From the resulting correlation curves, a second-order analysis was performed to calculate the average mean particle size and standard deviation.
Evaluation of Well Plate Wear and Deformation with Optical Profilometry
Optical profilometry of the bottom of the wells prior to and after milling was performed with a Wyko NT 3300 white-light interferometer (Veeco Instruments, Tucson, AZ, USA). After calibration, samples were analyzed in vertical scanning interferometry mode, using an objective of 5 and field of view of 1. Three well bottoms were evaluated prior to and after milling.
Determination of Drug Content
Evaluation of drug content was performed by sampling 6.0 μl of loviride nanosuspension (corresponding to ±1 mg of loviride) with a pipette (1-10 μl Calibra® micropipette, Socorex Isba S.A., Switzerland), followed by dissolving and diluting the nanosuspension into the validated high-performance liquid chromatography (HPLC) range. Samples were analyzed by HPLC on a Merck-Hitachi-Lachrom instrument (Hitachi Ltd., Tokyo, Japan) using a Merck Chromolith Performance RP18-e (100–4.6 mm) column (Merck, Darmstadt, Germany). A mobile phase consisting of water and acetonitrile [55/45% (v/v)] was used. The flow rate was set at 2 ml/min and UV detection was performed at 360 nm. The injection volume was 20 μl. The validated range of the method was 0.0025–0.1 mg/ml with an R2 value > 0.9999. The limit of detection was 0.5 μg/ml and the limit of quantification 2 μg/ml. Precision and accuracy were assessed by analyzing standards (n = 6) with concentrations of 0.1, 0.05, 0.025, 0.01, 0.005, and 0.0025 mg/ml. All relative standard deviations were below 5% and recovery was always within the 95–105% interval.
The nanosuspension content determined by HPLC was compared to the theoretical value. This value was calculated taking into consideration the density of the drug compound, as determined by helium pycnometry (Beckman comparison pycnometer model 930, Beckman Industries Inc., Fullerton, CA, USA), and the density of the TPGS solution, measured with a handheld density meter (DMA 35N, Anton Paar, Graz, Austria). The experiment was performed in triplicate and the average and standard deviation were calculated.
Determination of Particle Morphology by Scanning Electron Microscopy
Prior to morphology evaluation, different approaches to sample preparation were evaluated: (1) an amount of nanosuspension corresponding to 1 mg of loviride was carefully spread onto a scanning electron microscopy (SEM) sample holder and left to dry under ambient conditions, (2) the same procedure was followed, but water removal was done by freeze-drying, and (3) an aliquot of nanosuspension was freeze-dried and subsequently the dried sample was spread out onto the sample holder, thereby braking up the matrix structure formed during freeze-drying. For freeze-drying, the sample was frozen in a freezer at −7°C, followed by freeze-drying in a Christ model Alpha freeze-dryer (type 1050, Van Der Heyden, Brussels, Belgium).
SEM studies of the matrix formers prior to and after spray-drying were performed on a Philips XL30 SEM-FEG (FEI, Eindhoven, the Netherlands) equipped with a Schottky field-emission electron gun. Prior to imaging, mounted samples were sputter-coated with gold (sputtering device 07 120; Balzers Union, Liechtenstein). A 10-kV electron beam was used and detection was performed with a conventional Everhart–Thornley secondary electron detector.
Differential Scanning Calorimetry
Two different approaches for sample preparation were evaluated: (1) an amount of nanosuspension corresponding to 1 mg of loviride was carefully transferred into a differential scanning calorimetry (DSC) sample pan with known weight and left to dry in air under ambient conditions and (2) the same procedure was followed but, after nanosuspension transfer, the nanosuspension was freeze-dried, as described in “Determination of Particle Morphology by Scanning Electron Microscopy.”
Following determination of the weight of the dried product on the sample pan, a lid was placed on the pan and total mass was determined. The powder obtained after freeze-drying 1 ml of nanosuspension was used as a reference.
The DSC measurements were performed using a DSC Q2000 (TA Instruments, New Castle, DE, USA) equipped with an intercooler. Data were treated mathematically using the resident Universal Analysis® Software. Calibration for temperature and heat of fusion was carried out with indium and tin as reference materials, respectively. The samples were analyzed in open aluminum pans and scanned under a nitrogen purge with a heating rate of 10°C/min from 20°C to 250°C. Each measurement was performed in triplicate and the average and standard deviation was calculated.
X-ray Powder Diffraction
X-ray powder diffraction was performed at room temperature with an automated X’Pert PRO diffractometer (PANalytical, the Netherlands). X’Pert Data Collector version 2.2c (PANalytical, the Netherlands) was used for data collection.  was obtained with a 0.02-mm Ni filter. The diffracted beams were detected with an X’celerator RTMS detector. The data were collected in continuous mode in the region of 2° ≤ 2θ ≤ 60° (capillary geometry) or 4° ≤ 2θ ≤ 40° (Bragg–Brentano geometry) with a counting time of 19.7 s. The X-ray tube was set up at a voltage of 45 kV and a current of 40 mA. The diffractograms were analyzed using X’pert Data Viewer version 1.2a.
Capillary experiments were performed in 0.7 mm ∅ capillaries (Hilgenberg GmbH, Malsfeld, Germany). An amount of nanosuspension corresponding to 1 mg of loviride was transferred into the capillary. Subsequently, the sample was freeze-dried (“Determination of Particle Morphology by Scanning Electron Microscopy”) and the capillary was sealed. Alternatively, the capillary was immediately sealed to evaluate the feasibility of measuring directly in the suspended state. During measurement, samples were irradiated using a line focus with a length of 12 mm and width of 0.4 mm.
Reference experiments on bulk freeze-dried nanosuspension, pure loviride, and pure TPGS were performed. For these experiments, a Bragg–Brentano geometry was used, with flat sample stage spinning with a rotation time of 4 s/2πrad. The irradiated and observed area was 100 mm2.
RESULTS AND DISCUSSION
Scaling Down of the Media Milling Process
For nanosuspension production, the drug compound to water ratio is 10 mg/50 μl (200 mg/ml water), a feasible concentration for media milling (21). The stabilizing system is 25 wt.% TPGS (relative to the drug weight) since previous results indicated that adequate stabilization could be obtained for the model compounds using this system (submitted manuscript). In a first experiment, the particle size reduction process of a loviride suspension is followed as a function of milling time for the 96-well plate and ball mill designs. Subsequently, particle size reduction was evaluated for all model compounds and both designs using a 24-h milling end point.
Media Milling in 96-Well Plates
The first design evaluated was milling in 96-well plates. The total volume of each well is 392 μl with a well working volume of 25–340 μl, as mentioned in the manufacturer’s technical specifications. Milling is performed on 30, 20, and 10 mg of drug compound, corresponding to volumes falling within the recommended working range of the wells.
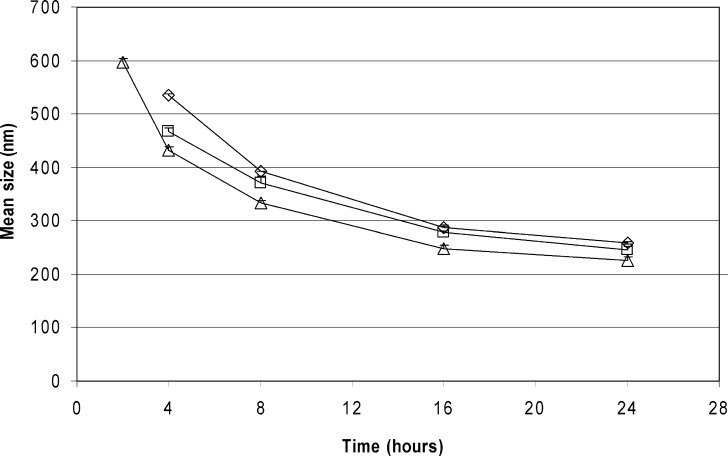
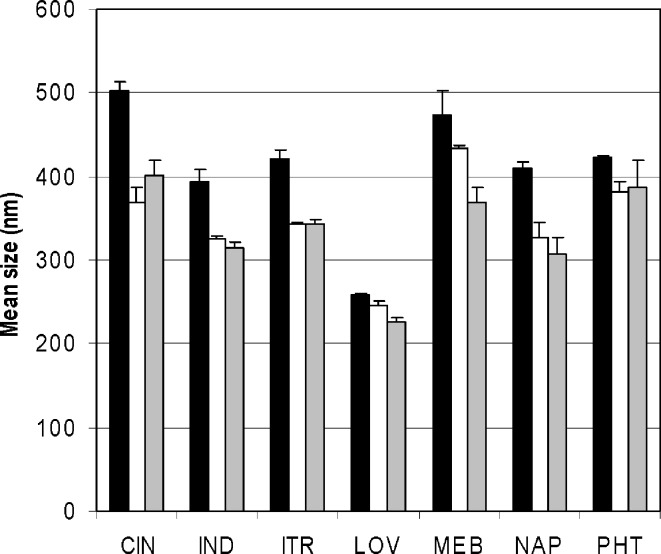
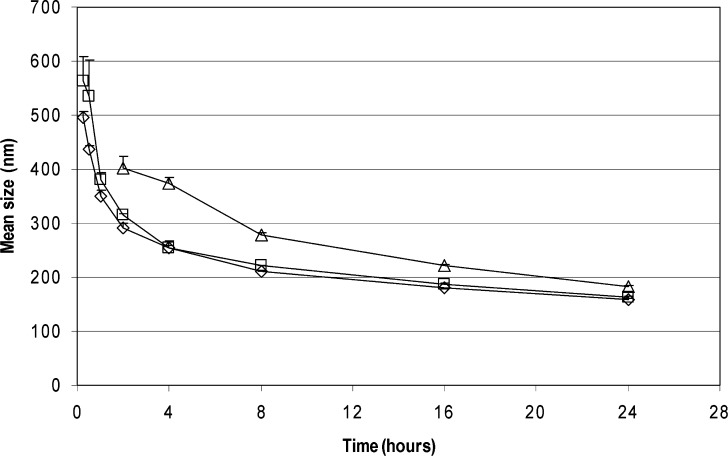
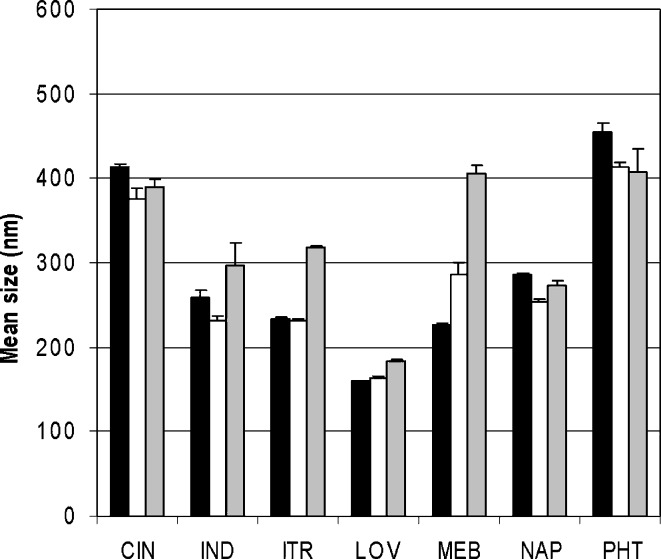
Particle size reduction results of loviride are depicted in Fig. 1. Nanosuspensions are successfully obtained in all of the cases. Using lower amounts of loviride results in smaller particles. Also, for the other model compounds, nanosuspensions are obtained after 24 h of milling (Fig. 2). Although better milling efficiency for smaller amounts could be observed for some of the compounds, this observation could not be generalized [significantly (p < 0.05) smaller mean particle sizes were obtained for CIN, IND, and ITR (20 vs. 30 and 10 vs. 30 mg) and LOV and NAP (10 vs. 30 mg)].
Fig. 1.
Loviride particle size reduction as a function of milling time in 96-well plates. The amount of drug milled is 30 mg of drug compound (diamonds), 20 mg of drug compound (squares), or 10 mg of drug compound (triangles)
Fig. 2.
Average particle size results (and range) of the different compounds after 24 h of milling in 96-well plates. The amount of drug milled is 30 mg of drug compound (black bars), 20 mg of drug compound (white bars), or 10 mg of drug compound (gray bars)
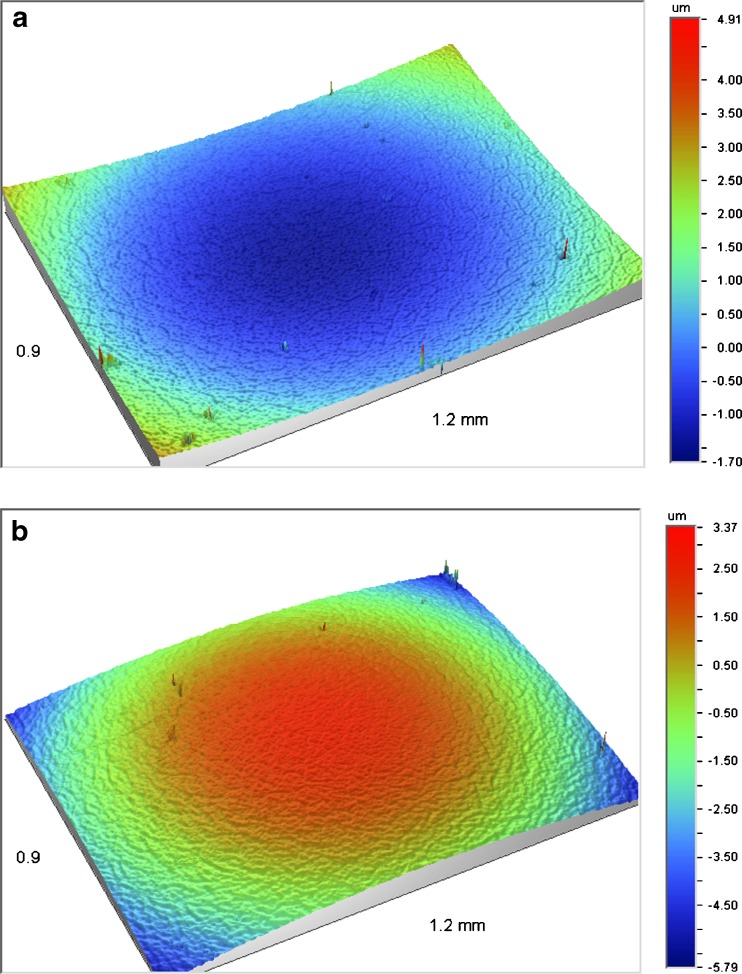
Since the 96-well plate is a standardized format that can be easily integrated into a high-throughput setting, these results are very encouraging. However, one should keep in mind that typical applications for well plates are analytical in nature and the plates are not designed for milling purposes. Wear and deformation of the well plates can occur due to the milling process. To evaluate this, white-light interferometry was performed on the bottom of wells prior to and after milling. Typical images obtained are provided in Fig. 3. The curvature of the well bottom has switched after milling. Furthermore, upon looking closer to the microscopic structure, the characteristic pattern that can be observed prior to milling disappears after milling. Although it is difficult to differentiate between wear and deformation, the results clearly show that there is an influence of milling on the well plate integrity. This is undesirable since it might lead to contamination of the nanosuspension and/or well plate failure upon milling for prolonged periods. By using milling devices that have a more solid design or are constructed of harder materials, this might be prevented or minimized.
Fig. 3.
Optical profilometry of the bottom of a well prior to a and after b media milling for 24 h
Media Milling in the Ball Mill Design
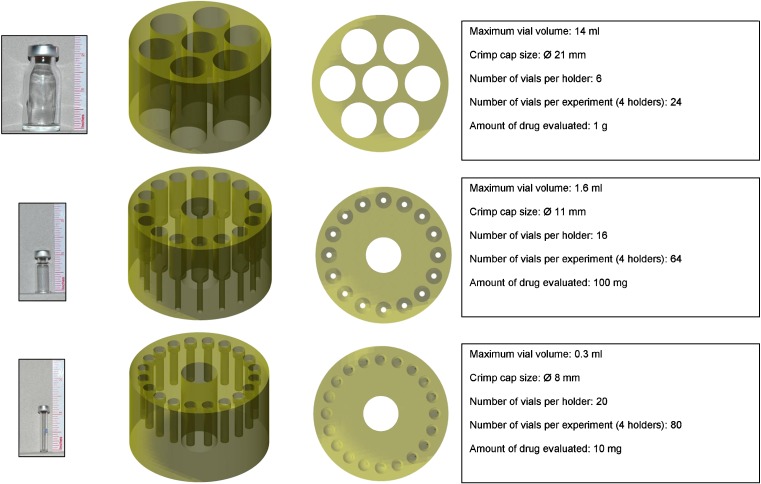
Using crimp cap sealed glass vials as a more robust device, we investigated media milling in the ball mill as an alternative method to downscale the media milling process. Media milling using ball mills has been reported previously for the production of nanosuspensions [e.g., (15–20)]. For the purpose of downscaling, three different sizes of vials were evaluated, allowing milling of 1 g, 100, and 10 mg of drug compound. For each type of vial, nylon holders were designed in which the vials could be fixed. The holders fit into the mixing bowls of the planetary mill. As the planetary mill allows simultaneous milling of four mixing bowls, the total number of vials that can be milled in one experiment is 24 (1 g), 64 (100 mg), or 80 (10 mg). These relatively high numbers make the system interesting for formulation screening purposes. The different vials and holders used, the number of vials per holder, and total number of vials per experiment are given in Fig. 4.
Fig. 4.
Different designs for media milling in the ball mill. Vials used, side and top view of the vial holders, and key characteristics of the different designs
Size reduction of loviride as a function of processing time in the planetary mill for 1 g, 100, and 10 mg of drug is provided in Fig. 5. Nanosuspensions were successfully prepared in all cases. Milling 10 mg of drug compound resulted in a mean particle size of 184 ± 2 nm after 24 h of milling, slightly lower than when using the 96-well plate design (227 ± 6 nm). Upon milling higher amounts of drug, particle size reduction efficiency increased slightly, with mean particle sizes of 164 ± 1 and 160 ± 1 nm after 24 h for 100 mg and 1 g of drug compound, respectively. Results for the different compounds after 24 h of milling are depicted in Fig. 6. Again, nanosuspension production was successful in all of the cases. No clear trend in milling efficiency could be observed upon milling higher amounts of drug [significantly (p < 0.05) smaller mean particle sizes were obtained for LOV (1 g vs. 100 mg, 1 g vs. 10 mg, and 100 vs. 10 mg), ITR and MEB (1 g vs. 10 mg and 100 vs. 10 mg), and NAP (100 mg vs. 1 g)]. The particle size results obtained upon milling 10 mg of compound in the ball mill design tended to be comparable to those of the 96-well plate design (the mean particle size obtained in the ball mill design relative to that obtained in the well plate design was 96 ± 10%, on average for the different compounds).
Fig. 5.
Loviride particle size reduction as a function of milling time in the ball mill. The amount of drug milled is 1 g of drug compound (diamonds), 100 mg of drug compound (squares), or 10 mg of drug compound (triangles)
Fig. 6.
Average particle size results (and range) of the different compounds after 24 h of milling in the ball mill. The amount of drug milled is 1 g of drug compound (black bars), 100 mg of drug compound (white bars), or 10 mg of drug compound (gray bars)
Miniaturization of Nanosuspension Evaluation
The above discussed results prove that scaling down of nanosuspension production is feasible for 10 mg of drug compound using the 96-well plate design or, alternatively, the ball mill design. However, a thorough evaluation of the produced nanosuspensions is a necessary item complementary to a fully downscaled system, applicable for screening purposes. Apart from size determination, a complete nanosuspension characterization comprises evaluation of properties such as drug content, particle size, nanoparticle morphology, and solid-state characteristics of the nanoparticles. Therefore, in the remainder of the study, a set of possible nanosuspension evaluation methods are presented, focusing on the ability of analyzing small quantities of product. The available amount of drug compound for a single evaluation test was set at 1 mg of drug compound, making evaluation of up to ten characteristics possible on a nanosuspension containing 10 mg of drug compound. Possible evaluations are discussed based on existing literature and are supplemented with original data, when considered appropriate.
Drug content determination
Drug content is key in nanosuspension evaluation. For the loviride nanosuspension, we found a drug content of 166.8 ± 1.2 mg/ml, the low standard deviation indicating good reproducibility. Furthermore, taking into consideration the density of loviride and an aqueous solution of TPGS with equal concentration such as during nanosuspension production (1.44 ± 0.00 and 1.0042 ± 0.0001 g/ml, respectively), the estimated concentration of the nanosuspension would be 168.8 mg/ml. The measured value lies very close to the expected result, with a relative error of only −1.2 ± 0.7%. Apart from proving that content determination can be performed, these results also demonstrate that transfer of small amounts of nanosuspension is feasible in a precise and accurate manner. For conventional suspensions, transferring minute amounts quantitatively is much more challenging, given the second power by which particle size is related to the limiting settling velocity, as dictated by Stokes’ Law (22). Whereas calculations on a hypothetical 10-μm particle resulted in a settling velocity of 43 μm/s, this was only 0.0043 μm/s for a 100-nm nanoparticle (22). Furthermore, average Brownian displacement, according to Einstein’s fluctuation–dissipation theory, is inversely related to the square root of the particle size, resulting in calculated Brownian displacement values of 0.543 and 5.425 μm/s for 10-μm and 100-nm particles, respectively (22). Whereas Brownian motion is negligible to the settling tendency for the 10-μm particle, it becomes dominant for a 100-nm nanoparticle. Given this less-pronounced settling behavior of nanosuspensions compared to conventional suspensions, the segregation occurring in the timescale of a typical transfer step becomes negligible. From this point of view, the nanosuspension’s behavior can be considered more solution-like than suspension-like. The importance of the latter should not be underestimated since transferring small amounts of nanosuspension quantitatively (e.g., using robotics) is a necessary step for various nanosuspension characterization and/or application purposes.
Size evaluation
From the scaffold of possible techniques for size measurement, the most popular techniques for size evaluation of nanoparticles are laser diffraction (LD) and DLS since they allow rapid size evaluation of particles in diluted suspensions (14). Other possible techniques are more suited for concentrated systems (acoustic methods), lack commercial implementation (turbidimetry, nuclear magnetic resonance), are limited to the evaluation of larger particles (single-particle optical sensing, optical microscopy), are rather suited for morphology evaluation than size measurement (electron microscopy, atomic force microscopy), require complicated methodology (field-low fractionation), are semi-quantitative in nature (filtration), or generate results that are highly influenced by surfactants employed (hydrodynamic chromatography) (14).
Although LD measurements are very useful for particle size evaluation, typically more than 1 mg of drug compound is necessary to perform a measurement. In contrast to laser diffraction, DLS is feasible on a 1-mg quantity of drug compound since measurements are performed on small volumes (a few milliliters) of diluted nanosuspension. Therefore, DLS is certainly the method of choice for the evaluation of nanosuspension particle size in a miniaturized design. Depending on the solubility of the drug in the diluting medium, the use of a saturated solution of the drug might be considered necessary to prevent underestimation of the particle size due to nanoparticle dissolution upon dilution.
Morphology evaluation
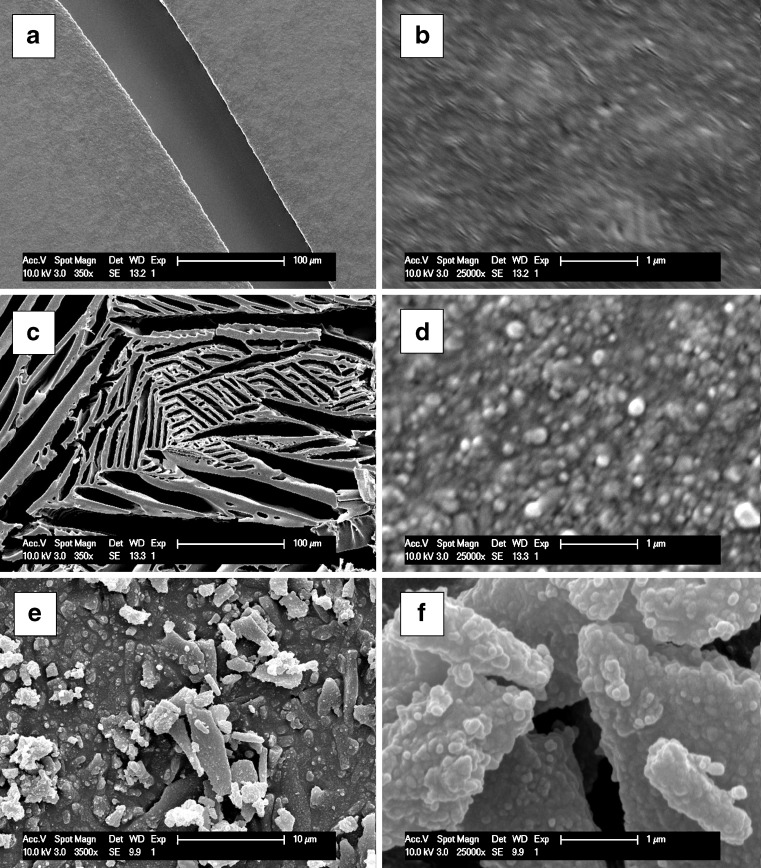
A morphology evaluation of the nanoparticles can be performed by a number of different techniques, such as (environmental) scanning electron microscopy, transmission electron microscopy, and atomic force microscopy (14). All these techniques can be performed on milligram quantities of solid sample. However, sample preparation can have a big influence on the quality of the obtained results. This is illustrated in Fig. 7, where SEM results for loviride nanosuspensions by using different sample preparation approaches are shown: (1) drying in air directly on the sample holder, (2) freeze-drying directly on the sample holder, and (3) freeze-drying and subsequent dispersion on the sample holder. Using a low magnification (Fig. 7a), it can be seen that, for the product dried in air, a flat structure is formed that shows broad cracks. Morphology evaluation at higher magnifications is impossible in this case, presumably because the nanoparticles at the air interface are embedded into a TPGS-rich layer. For the product that was freeze-dried on the sample holder, a typical freeze-drying matrix structure can be observed in a low magnification (Fig. 7c). Although the result obtained upon further magnification is better than for the nanosuspension dried in air (Fig. 7d), morphology evaluation is still not straightforward. Finally, by dispersing the freeze-dried powder on the sample holder, the matrix structure is broken up (Fig. 7e). As a result, a much more valuable evaluation of nanoparticle morphology can be obtained (Fig. 7f).
Fig. 7.
SEM pictures of loviride nanoparticles using different sample preparation approaches: drying in air directly on the sample holder (a magnification ×350; b magnification ×25,000), freeze-drying directly on the sample holder (c magnification ×350, d magnification ×25,000), and dispersion of the freeze-dried product on the sample holder (e magnification ×3,500; f magnification ×25,000)
Differential scanning calorimetry
DSC can provide important information on the solid-state characteristics of both the nanoparticles and stabilizer(s) (14). The technique allows for the evaluation of milligram amounts of drug compound (23). As for the morphology evaluation described above, drying of the nanosuspension prior to analysis is a necessity. Using the DSC pan as a drying reservoir, we evaluated the effect of sample drying of a loviride nanosuspension on the obtained results. Both drying in air and freeze-drying were evaluated. Results obtained with a freeze-dried large amount of nanosuspension were used as a reference.
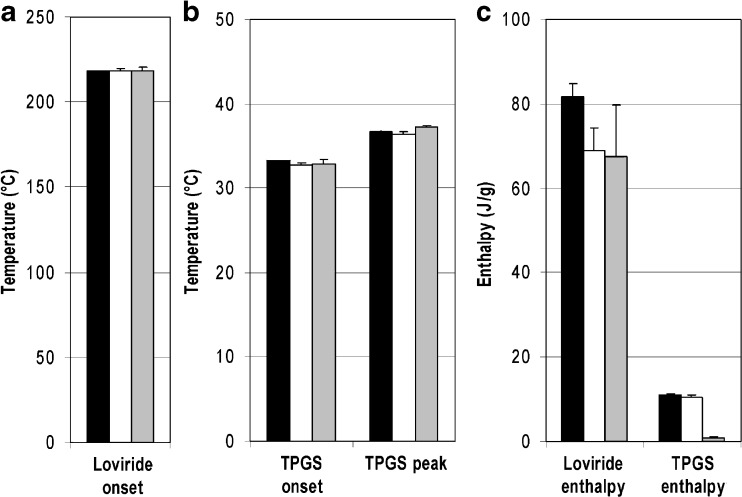
Figure 8 summarizes the results. Onset melting temperatures of loviride (Fig. 8a) and onset and peak temperatures of the TPGS melting peaks (Fig. 8b) are reproducible for both samples dried in air (loviride: Tonset = 218.6 ± 1.0°C; TPGS 32.7 ± 0.3°C Tpeak = 36.4 ± 0.3°C) and prepared by freeze-drying (loviride: Tonset = 218.7 ± 1.8°C; TPGS 32.8 ± 0.7°C Tpeak = 37.3 ± 0.2°C) and comparable to the reference bulk sample (loviride: Tonset = 218.1 ± 0.4°C; TPGS 33.3 ± 0.0°C Tpeak = 36.7 ± 0.1°C). For loviride, enthalpy-of-fusion values obtained in the downscaled approaches (drying in air 68.9 ± 5.3 J/g; freeze-drying 67.4 ± 12.2 J/g) are somewhat lower and more variable compared to the reference (81.6 ± 3.2 J/g). The reason why remains unclear. For TPGS, the product dried in air results in enthalpy-of-fusion values (10.4 ± 0.7 J/g) that are very similar to those obtained for the reference (11.1 ± 0.2 J/g). For the freeze-dried product, on the other hand, enthalpy-of-fusion values are very low (0.8 ± 0.4 J/g). In view of the latter result, it can be expected that freezing of the nanosuspension occurs very fast upon placing the sample in the freezer, given the good thermal conductivity of the DSC pan and the small nanosuspension volume. As a result, dissolved TPGS molecules can be kinetically trapped in the frozen product, thereby limiting TPGS crystallization. This mechanism is suggested to be the underlying reason for the small melting peak observed. Apparently, the kinetics of water removal by drying the sample in air and the freezing rates upon using larger volumes of nanosuspension are slow enough to enable TPGS crystallization. These results stress the influence that sample preparation can have on the results of the analysis.
Fig. 8.
DSC results: onset temperatures of the melting endotherm of loviride a, onset and peak temperatures of the TPGS melting endotherm b, and enthalpy of fusion of both peaks c. Key: reference formulation (black bars), miniaturized and dried in air (white bars), and miniaturized and freeze-dried (gray bars)
X-ray powder diffraction
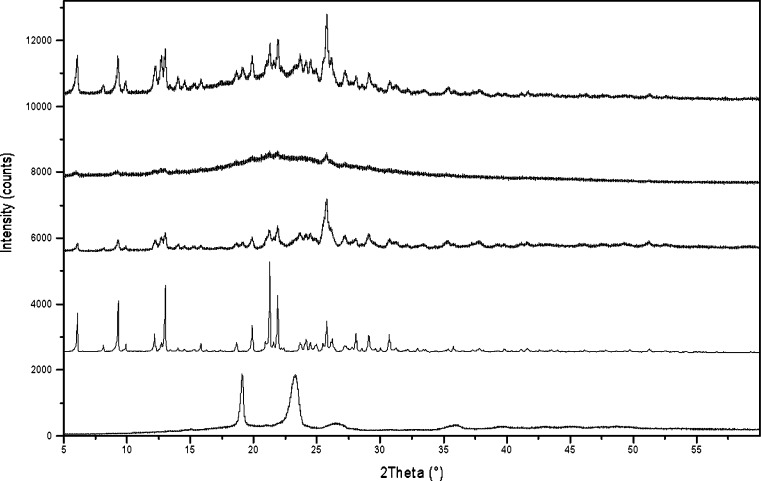
As a technique complementary to DSC, XRPD is important for the characterization of the solid state of the drug and stabilizer (14). For the evaluation of small sample amounts, a capillary setup is preferred, in contrast to bulk powders, for which Bragg–Brentano geometry is typically used. We evaluated capillary measurements of the loviride nanosuspension, both as the native nanosuspension and after freeze-drying in the capillary. As reference measurements, a larger amount of freeze-dried nanosuspension, pure loviride, and pure TPGS were recorded in Bragg–Brentano geometry.
Results for the loviride nanosuspension are summarized in Fig. 9. In the diffractogram of the nanosuspension that was freeze-dried in the capillary, diffraction peaks can be observed for loviride and TPGS, the latter being most clear at 19.1° 2θ, as there is no overlap with the peaks from loviride in this region. Apart from a more pronounced halo, the diffractogram is very similar to that of the freeze-dried nanosuspension recorded in Bragg–Brentano geometry. The intensity of the diffraction peaks is greatly reduced when measuring directly in the suspended state. At 2θ values corresponding to the major loviride diffraction peaks in the freeze-dried product, small diffraction peaks can be distinguished. By using the diffraction peaks as a fingerprint of the crystal lattice, useful information can be obtained directly from the nanosuspension on polymorphic transitions and or amorphization due to milling. These phenomena can have an influence on the energy of the material which might result in (1) altered dissolution profiles due to the influence of the altered (kinetic) solubility of the material on the dissolution velocity and (2) physical instability issues resulting from the tendency of the material to evolve to its lowest possible energy state. As product performance and stability can be influenced by the solid state of the material, this is an important characterization.
Fig. 9.
XRPD results. From top to bottom: freeze-dried nanosuspension in a capillary, nanosuspension in a capillary, freeze-dried nanosuspension in Bragg–Brentano geometry, pure loviride in Bragg–Brentano geometry, and pure TPGS in Bragg–Brentano geometry
Conclusions
Scaling down of the nanosuspension production process by media milling quantities as low as 10 mg of drug compound was feasible in using a 96-well plate design. Although the 96-well plate can easily be integrated into high-throughput settings, well deformation or wear might limit its practical use. To circumvent this problem, milling in glass vials in a ball mill was evaluated as an alternative. Again, scaling down was feasible for 10 mg of drug compound and results obtained were comparable to those obtained in the 96-well plate design.
As a miniaturization of nanosuspension characterization goes hand in hand with a downscaled production process, feasibility of performing evaluations on amounts of nanosuspension corresponding to 1 mg was investigated. Drug content evaluation was precise and accurate, enabling transfer of minute amounts in a quantitative manner. For size measurement in a miniaturized way, dynamic light scattering was identified as the method of choice. Sample preparation was essential for morphology evaluation (SEM), spreading the freeze-dried powder on the sample holder yielding the most valuable results. Thermal analysis (DSC) was feasible by different sample preparation techniques, although the latter was found to impact the melting behavior of the stabilizer. Further solid-state characterization of the nanoparticles by X-ray powder diffraction in capillaries was possible. Measuring freeze-dried nanosuspension yielded superior results, compared to directly measuring the nanosuspension in the capillary. The latter, however, can be used as a fingerprint for solid-state identification of the drug compound after milling.
In summary, both production and a thorough physicochemical characterization of amounts of nanosuspension as low as 10 mg of drug compound were found to be feasible. The approach presented can be used for nanosuspension formulation screening studies in parallel designs, a valuable tool in preclinical development settings.
Acknowledgements
The authors would like to thank Patrick Rombaut for designing and making the vial holders, Louis Kockaerts for his assistance with the milling experiments, and Rudy De Vos for his help with the electron microscope. The work was carried out within the framework of an interdisciplinary research project sponsored by K.U. Leuven (IDO-project IDO/04/009). The authors acknowledge financial support from FWO-Vlaanderen (G.0614.07).
References
- 1.Lipinski C. A. Poor aqueous solubility—An industry wide problem in drug discovery. Am. Pharm. Rev. 2002;5:82–85. [Google Scholar]
- 2.Brewster M. E., Loftsson T. Cyclodextrins as pharmaceutical solubilizers. Adv. Drug Deliv. Rev. 2007;59:645–666. doi: 10.1016/j.addr.2007.05.012. [DOI] [PubMed] [Google Scholar]
- 3.Leuner C., Dressman J. Improving drug solubility for oral delivery using solid dispersions. Eur. J. Pharm. Biopharm. 2004;50:47–60. doi: 10.1016/S0939-6411(00)00076-X. [DOI] [PubMed] [Google Scholar]
- 4.Porter C. J. H., Trevaskis N. L., Charman W. N. Lipids and lipid-based formulations: Optimizing the oral delivery of lipophilic drugs. Nat. Rev. Drug Discov. 2007;6:231–248. doi: 10.1038/nrd2197. [DOI] [PubMed] [Google Scholar]
- 5.Rabinow B. E. Nanosuspensions in drug delivery. Nat. Rev. Drug Discov. 2004;3:785–796. doi: 10.1038/nrd1494. [DOI] [PubMed] [Google Scholar]
- 6.Kesisoglou F., Panmai S., Wu Y. Nanosizing—Oral formulation development and biopharmaceutical evaluation. Adv. Drug Deliv. Rev. 2007;59:631–644. doi: 10.1016/j.addr.2007.05.003. [DOI] [PubMed] [Google Scholar]
- 7.Date A. A., Patravale V. B. Current strategies for engineering drug nanoparticles. Curr. Opin. Colloid Interface Sci. 2004;9:222–235. doi: 10.1016/j.cocis.2004.06.009. [DOI] [Google Scholar]
- 8.Chen H., Zhang Z., McNulty C., Olbert C., Yoon H. J., Lee J. W., Kim S. C., Seo M. H., Oh H. S., Lemmo A. V., Ellis S. J., Heimlich K. A high-throughput combinatorial approach for the discovery of a Cremophor EL-free paclitaxel formulation. Pharm. Res. 2003;20:1302–1308. doi: 10.1023/A:1025021603288. [DOI] [PubMed] [Google Scholar]
- 9.Gardner C. R., Almarsson O., Chen H., Morissette S., Peterson M., Zhang Z., Wang S., Lemmo A., Gonzalez-Zugasti J., Monagle J., Marchionna J., Ellis S., McNulty C., Johnson A., Levinson D., Cima M. Application of high throughput technologies to drug substance and drug product development. Comput. Chem. Eng. 2004;28:943–953. doi: 10.1016/j.compchemeng.2003.09.028. [DOI] [Google Scholar]
- 10.Gardner C. R., Walsh C. T., Almarsson O. Drugs as materials: Valuing physical form in drug discovery. Nat. Rev. Drug Discov. 2004;3:926–934. doi: 10.1038/nrd1550. [DOI] [PubMed] [Google Scholar]
- 11.Dai W. G., Dong L. C., Li S., Pollock-Dove C., Chen J., Mansky P., Eichenbaum G. Parallel screening approach to identify solubility-enhancing formulations for improved bioavailability of a poorly water-soluble compound using milligram quantities of material. Int. J. Pharm. 2007;336:1–11. doi: 10.1016/j.ijpharm.2006.11.034. [DOI] [PubMed] [Google Scholar]
- 12.Mansky P., Dai W. G., Li S., Pollock-Dove C., Daehne K., Dong L., Eichenbaum G. Screening method to identify preclinical liquid and semi-solid formulations for low solubility compounds: Miniaturization and automation of solvent casting and dissolution testing. J. Pharm. Sci. 2007;96:1548–1563. doi: 10.1002/jps.20799. [DOI] [PubMed] [Google Scholar]
- 13.J. Cunningham, E. Merisko-Liversidge, E. R. Cooper, G. G. Liversidge. Milling microgram quantities of nanoparticulate candidate compounds. World Patent WO 2004/058216 A2, 15 July 2004.
- 14.Haskell R. J. Physical Characterization of Nanoparticles. In: Gupta R. B., Kompella U. B., editors. Nanoparticle Technology for Drug Delivery, Drugs and the Pharmaceutical Sciences, vol. 159. New York: Taylor & Francis Group, LLC; 2006. pp. 103–138. [Google Scholar]
- 15.Liversidge G. G., Conzentino P. Drug particle size reduction for decreasing gastric irritancy and enhancing absorption of naproxen in rats. Int. J. Pharm. 1995;125:309–313. doi: 10.1016/0378-5173(95)00148-C. [DOI] [Google Scholar]
- 16.Liversidge G. G., Cundy K. C. Particle size reduction for improvement of oral bioavailability of hydrophobic drugs: I. Absolute oral bioavailability of nanocrystalline danazol in beagle dogs. Int. J. Pharm. 1995;125:91–97. doi: 10.1016/0378-5173(95)00122-Y. [DOI] [Google Scholar]
- 17.Merisko-Liversidge E., Sarpotdar P., Bruno J., Hajj S., Wei L., Peltier N., Rake J., Shaw J.M., Pugh S., Polin L., Jones J., Corbett T., Cooper E., Liversidge G. G. Formulation and antitumor activity evaluation of nanocrystalline suspensions of poorly soluble anticancer drugs. Pharm. Res. 1996;13:272–278. doi: 10.1023/A:1016051316815. [DOI] [PubMed] [Google Scholar]
- 18.Lee J. Drug nano- and microparticles processed into solid dosage forms: Physical properties. J. Pharm. Sci. 2004;92:2057–2068. doi: 10.1002/jps.10471. [DOI] [PubMed] [Google Scholar]
- 19.Lee J., Cheng Y. Critical freezing rate in freeze drying nanocrystal dispersions. J. Control. Release. 2006;111:185–192. doi: 10.1016/j.jconrel.2005.12.003. [DOI] [PubMed] [Google Scholar]
- 20.Van Eerdenbrugh B., Froyen F., Martens J. A., Blaton N., Augustijns P., Brewster M., Van den Mooter G. Characterization of physico-chemical properties and pharmaceutical performance of sucrose co-freeze-dried solid nanoparticulate powders of the anti-HIV agent loviride prepared by media milling. Int. J. Pharm. 2007;338:198–206. doi: 10.1016/j.ijpharm.2007.02.005. [DOI] [PubMed] [Google Scholar]
- 21.Patravale V. B., Date A. A., Kulkarni R. M. Nanosuspensions: A promising drug delivery strategy. J. Pharm. Pharmacol. 2004;56:827–840. doi: 10.1211/0022357023691. [DOI] [PubMed] [Google Scholar]
- 22.Gupta R. B. Fundamentals of Drug Nanoparticles. In: Gupta R. B., Kompella U. B., editors. Nanoparticle Technology for Drug Delivery, Drugs and the Pharmaceutical Sciences, vol. 159. New York: Taylor & Francis Group, LLC; 2006. pp. 1–19. [Google Scholar]
- 23.Giron D. Thermal analysis, microcalorimetry and combined techniques for the study of pharmaceuticals. J. Therm. Anal. Calorim. 1999;3:1285–1304. doi: 10.1023/A:1010194020563. [DOI] [Google Scholar]


