

Abstract
Small animal imaging has a critical role in phenotyping, drug discovery, and in providing a basic understanding of mechanisms of disease. Translating imaging methods from humans to small animals is not an easy task. The purpose of this work is to review in vivo X-ray based small animal imaging, with a focus on in vivo micro-computed tomography (micro-CT) and digital subtraction angiography (DSA). We present the principles, technologies, image quality parameters and types of applications. We show that both methods can be used not only to provide morphological, but also functional information, such as cardiac function estimation or perfusion. Compared to other modalities, x-ray based imaging is usually regarded as being able to provide higher throughput at lower cost and adequate resolution. The limitations are usually associated with the relatively poor contrast mechanisms and potential radiation damage due to ionizing radiation, although the use of contrast agents and careful design of studies can address these limitations. We hope that the information will effectively address how x-ray based imaging can be exploited for successful in vivo preclinical imaging.
Keywords: micro-CT, DSA, x-ray, rodents, heart, tumors, lung, bone
1. Introduction
Genetic manipulations in mice and rats are increasingly being used as models of human disease. These models have become critical elements in the study of specific pathways for disease, potential therapies, and safety for new pharmaceuticals. Modern imaging modalities – CT, MRI, PET, SPECT and ultrasound – have revolutionized clinical medicine. It is clear that the extension of imaging to preclinical models can provide a similar revolution for the basic scientist where traditional imaging techniques are based on autoradiography and histological techniques in which the studied animals are sacrificed, fixed and sliced. Such approaches are very invasive, labor intensive and do not permit longitudinal studies. These problems can be overcome by modern in vivo imaging technology. However, in vivo imaging in small animals is not easy due to the requirements for high spatial and temporal resolution. Extension of clinical methods from human to rodents presents several formidable scaling challenges for all modalities including the modality addressed explicitly in this review, i.e. xray based imaging. For example, acquiring CT images of the mouse heart with the organ definition and temporal resolution comparable to that which can be achieved in humans requires an increase in volumetric spatial resolution by a factor of about 3000 and a ten-fold increase in frame rate. Consequently, high spatial and temporal resolution are fundamental requirements for anatomical and functional x-ray based imaging, i.e. micro-CT and digital subtraction angiography (DSA) imaging. We present here a review of these two x-ray based techniques and describe the current state-of-the-art to address these requirements for in-vivo small animal imaging.
2. Micro-CT: Design and Performance
A micro-CT scanner is based on the same underlying physical principle as a clinical CT scanner, but it is designed for higher resolution imaging. It produces 3D tomographic data at microscopic resolution (voxel size ≤ (100 μm)3(Holdsworth and Thornton, 2002)) by taking hundreds of 2D projections from multiple angles around the animal. The x-ray source produces a cone-shaped beam, which is projected through the specimen with the resultant radiographic density of the specimen projected onto a 2D detector. The multiple projections are combined using a reconstruction method that is generally based on the filtered backprojection algorithm. The resultant micro-CT scan is a 3D matrix of voxels with values proportional to the mean linear attenuation coefficient of the material within each voxel; the 3D matrix can be sliced in any orientation to reveal different views of the anatomy.
2.1 Historical perspective
Hounsfield’s pioneering demonstration of computed tomography employed a relatively simple experimental arrangement consisting of a single collimated beam of x rays, a single stationary detector, and a mechanical stage to translate and rotate the specimen so that radiographic projections of the beam through the specimen could be taken at multiple angles around the specimen. That same geometry was employed by Kujoory et al. in 1980 (Kujoory et al., 1980) to construct the earliest small animal images. These investigators replaced the single photomultiplier used by Hounsfield with radiographic film, thereby providing much finer sampling of the projection data allowing a spatial resolution of 147×147×1000 μm. Feldkamp et al. (Feldkamp et al., 1984) took a major step by introducing an area detector capturing 2D projections at multiple angles. The divergence of the cone of radiation was elegantly addressed in Feldkamp’s cone beam algorithm, which is the basis for many of the present reconstruction methods in micro-CT. The acquisition of multiple 2D projections introduced the possibility of three dimensional volumetric imaging. Using geometric magnification, the system resolution was extended over a very limited field of view to scan tissue specimens at 30×30×30 μm spatial resolution. The geometry required the use of a very small radiographic focal spot (5 μm) with the associated low radiation flux. Since the focus of the work was on 3D structural measurements in specimens, protocols with long integration time were quite acceptable. In parallel with this effort, Flannery et al. (Flannery et al., 1987) developed a similar system for specimen studies. They used a synchrotron source, which provided substantially greater flux and used novel x-ray optics to produce a parallel beam, again over a very small field of view. This work also contributed some valuable understanding to the fundamental limits of resolution in micro-CT, i.e. the fact that “ dose and exposure time become important considerations.”
The growing interest in small animal models and development of new electronic detectors stimulated considerable development of dedicated small animal scanners in the 1990s. These systems diverged from the simpler geometries of the earlier decade, patterning their development after the successful rotating x-ray tube and detector systems of the clinical environment. While the mechanical design was considerably more challenging, the application to small animal models was considerably enhanced as these geometries allow the animal to lie stationary on a bed, as is common for clinical system. Holdsworth et al. (Holdsworth et al., 1993) and Boone et al. (Boone et al., 1993) both described dedicated systems in 1993 followed by an early commercial prototype developed by Paulus et al. (Paulus et al., 1999).
2.2 Design considerations
A typical micro-CT scanner will employ an x-ray source and a high-resolution digital x-ray detector(Paulus et al., 2000, Paulus et al., 2001). Multiple design factors such as geometry, the characteristics of the x-ray source and the detector technology will influence the final characteristics of the system. Some of the crucial performance parameters include the scan time, field of view, spatial and temporal resolution, low contrast detectability, and noise. We present next a review of the design considerations, the major components used in micro-CT scanner and their impact on image quality.
There are two possible design geometries: i) rotating gantry (tube and detector) and ii) rotating specimen (Figures 1A and B). All of the current commercial systems for in vivo scanning use the rotating gantry geometry, i.e. they are scaled versions of the clinical CT scanners (Figure 1A). Using this design, the x-ray tube and detector, which are mounted on a gantry, rotate around a central axis while the animal lies stationary on a table between the tube and detector. For most of these systems, the source to object distance (sod) is less or comparable to the object to detector distance (odd). A geometrical representation of these distances is shown in figures 1C and D. Positioning the object closer to the x-ray source and odd farther from the detector allows for an increase in magnification, defined as , which in turns allows for an increase in resolution (provided that the system is based on the use of a small focal spot x-ray source in order to compensate for the penumbra blurring effect). The term penumbra blurring is often used to describe the unsharpness produced by x-ray tube focal spots.
Figure 1.

The two possible design geometries for micro-CT are based on rotating gantry (A) or rotating specimen (B). The effect of penumbra blurring: for the same focal spot size (fs) of the x-ray source the penumbra blurring b is larger when the object is closer to the source (C) than when the object is closer to the detector (D). sod and odd refer to the source-object-distance and object-detector-distance.
The resolution limit due to penumbral blurring (b) in the projection plane is related to the focal spot diameter (fs), odd, and sod by Eq. (1):
| (1) |
Figure 1 shows graphically what happens when the scanning is performed with the object closer to the source (Figure 1C) or to the detector (Figure 1D). According to Eq. (1), if odd and sod are comparable, as in most of the rotating gantry systems, the penumbra blurring b becomes comparable or larger than the size of the focal spot and could compromise the spatial resolution, if the system uses a large focal spot tube.
In case of systems with rotating specimen (see Figure 1B), the x-ray source and detector are stationary. Such system design is more flexible in changing the magnification by changing the position of the specimen. The specimen could be also placed closer to detector, i.e. odd < sod, resulting in the reduction of penumbra blurring to less than the focal spot size. In this configuration, larger–focal-spot tubes that provide greater x-ray fluence, and therefore enable shorter exposure times, can be used. Despite these benefits of the rotating specimen design, this type of system has not gained popularity for in vivo imaging primarily because the animal must be mounted in the vertical position. Combining the benefits of a object magnification and rotating gantry design, commercial systems with odd <sod (M= 1.3) have recently become available (Ross et al., 2006, Du et al., 2007) to allow rapid 3D micro-CT, albeit at the price of reduced resolution.
2.3 X-ray Source
Most of the commercial micro-CT scanners use micro-focus x-ray tubes with focal spot sizes between 5–50 μm (Wang and Vannier, 2001) in a rotating gantry design. The photon fluence rate from a given focal spot is proportional to the focal spot size (~fsn) where n ranges between 1 and 2 (Badea et al., 2004). The fluence rate from an x-ray tube is linearly related to the current and the maximum current is limited by the thermal capacity of the focal spot. Thus, systems with a micro-focus x-ray source require longer exposure times to achieve comparable fluence to the large focal spot x-ray tubes. An increase in the number of photons is required to provide a higher signal to noise ratio, leading to improved low contrast resolution. Micro-focus x-ray tubes can yield very high-resolution imaging for ex-vivo samples or in vivo specimens associated with minimal biological motion. For example, micro-CT has been used to image isolated, fixed specimens such as a rodent heart with 25 μm spatial resolution (Jorgensen et al., 1998) resulting in a 3D reconstruction of the heart with superb anatomical detail.
In vivo small animal imaging of moving organs becomes very challenging for systems using a small size focal spot. While some physiologic motions (e.g. breathing) may not require extremely short exposure times, cardiac imaging places stringent constraints, requiring exposure times on the order of 10 ms. Short exposure times are required to minimize the blurring caused by the motion of the heart, but this is not possible with micro-focus x-ray tubes.
A solution for cardiopulmonary micro-CT imaging was proposed by (Badea et al., 2004) using a clinical angiographic X-ray tube with a rotating anode tube and large focal spot sizes (fs=0.3 and 1mm) capable of achieving high fluence rates. Thus, it is possible to achieve isotropic reconstructions with voxel size around 100 μm with a fluence rate at the detector 250-times that of a conventional cone beam micro-CT system with rotating detector and microfocal x-ray tube. The system was built with the rotating specimen geometry which was optimized to match focal spot blur with detector pitch and the resolution limits imposed by the reproducibility of gating, i.e. 100 μm.
Recently, commercial systems with a rotating gantry design have also adopted the use of large focal spot x-ray sources (Bartling et al., 2007b, Ross et al., 2006, Kiessling et al., 2004, Du et al., 2007). These systems use diagnostic x-ray tubes incorporating rotating anodes with focal spot sizes of 0.7 mm (Ross et al., 2006) or 0.5 mm (Gupta et al., 2006), achieved by shortening the filament.
2.4 Detectors
A detailed look at x-ray detector technology is given by (Yaffe and Rowlands, 1997) and a comparison of different x-ray detectors for mouse CT imaging was done by Goertzen et al. (Goertzen et al., 2004).
Together with the focal spot size of the x-ray source and the geometry of the system, the detector’s pixel size has a significant impact on the final resolution. Detectors must be optimized for high quantum efficiency, be free of geometric distortions, have a linear and uniform response over a range of scanning energies as well as consistency throughout the scan. Spatial non-uniformity of the detector response creates ring artifacts in the micro-CT images, which are typically corrected through the acquisition of a bright field. The detector should ideally have the highest dynamic range for good low contrast detectability and high dose efficiency, whereas its noise and dark current should be as low as possible. A high readout rate is required for specific applications in high-temporal resolution imaging, and in general, to reduce scanning time. The area of the detector should be large enough to ensure that the object (animal) is covered at all magnifications and no truncated projections are obtained.
Early 3D micro-CT scanners used x-ray image intensifiers (XRII) coupled to a video readout (Holdsworth et al., 1993, Feldkamp et al., 1989). Most current cone beam micro-CT scanners use 2D detectors consisting of scintillator screens made of GdO2SO4 or CSI(TI), which are optically coupled to cooled charge-coupled detectors (CCD) arrays via an optical lens or a fiber optic taper. The optical coupling via fiber optic tapers is generally more efficient and therefore these types of detectors are now most popular (Ritman, 2004).
Although the fabrication of these types of detectors is technically demanding, they continue to be the most sensitive and have a very good stability as a function of exposure history. Recently, flat-panel area detectors have been introduced (Ross et al., 2006, Gupta et al., 2006, Lee et al., 2003, Kiessling et al., 2004, Drangova et al., 2007) for small animal CT systems. These detectors use indirect conversion i.e. x-rays are converted to light by a scintillating layer and then the light is detected by a photodiode array that can be: i) amorphous silicon (a-Si) (Ross et al., 2006, Kalender, 2003) or ii) a complementary metal-oxide semiconductor (CMOS) process (Lee et al., 2003). The a-Si material has the advantage that it can be deposited over very large areas at relatively low temperatures (200–250°C) and does not age through exposures (Volk et al., 2004). On the other hand, these aSi flat panels have several drawbacks: the pixel size of around 200 μm is large compared to pixel sizes of as low as a few μm achievable with the CCD- based detectors. They have a low fill-factor of 45–70% (Lee et al., 2003) which is an important parameter governing the sensitivity (and ultimately dose) and they also may be affected by image lag (i.e. ghost images of the previously acquired images caused by charges trapped in the a-Si layer) affecting the spatial, low contrast and temporal resolution (Siewerdsen and Jaffray, 1999a, Siewerdsen and Jaffray, 1999b). Furthermore, flat panels also need frequent recalibration for offset and pixel gain factors (Gupta et al., 2006). Nevertheless, flat panels offer very high geometric stability and represent an important advancement in CT detector technology development.
2.5 Reconstruction algorithms
An overview of the underlying principles of image reconstruction in micro-CT can be found in (Paulus et al., 2001). The image reconstruction solves an inverse problem and essentially involves the conversion, via a reconstruction algorithm, of projection (or Radon) data into a 3D matrix corresponding to the tomographic representation of the specimen. There are two major types of algorithms: i) filtered back projection based algorithms and ii) iterative algorithms (Kak and Slaney, 1988). The most commonly used reconstruction algorithms in CT and micro-CT are part of the first category, i.e. based on filtered back projection (FBP). In filtered back projection, the acquired 2D projections are filtered, using a convolution kernel that reduces the blurring inherent to the back-projection process, then are back-projected through the sample space at the appropriate angle to generate an image. While first developed for 2D imaging (parallel or fan beam), convolution back projection was adapted by Feldkamp (Feldkamp et al., 1984) to compensate for the cone-beam geometry; this method forms the basis for the reconstruction algorithms used inmost current in vivo micro-CT system. While Feldkamp’s algorithm is considered to be an approximation, since the circular sampling trajectory does not satisfy Tuy’s data sufficiency condition (Tuy, 1983), the image quality of the reconstructed images is acceptable if the cone angle is less than about 10° (Holdsworth and Thornton, 2002), except for very unusual object configurations (Defrise and Clack, 1995).
When the number of projections is limited, iterative and statistical reconstruction algorithms can provide better image quality. An iterative algorithm such as algebraic reconstruction technique (ART) (Gordon et al., 1970), casts the problem as an algebraic system of equations. Reduction in the number of views translates directly to reduced radiation dose to the animal. However, when applied for high resolution imaging (such as in micro-CT), the iterative algorithms pose difficulties due to the associated computational requirements (Benson and Gregor, 2005). To reduce the computational and the time requirements, ordered subsets (OS) strategies to reduce the number of iterations were used (Hudson and Larkin, 1994). Alternatively, the amount of projection or image data can be reduced by strategies such as focus of attention (FOA) reconstruction (Benson and Gregor, 2006).
Statistical image reconstruction is another class of iterative reconstruction algorithms, first introduced for transmission imaging in nuclear medicine, but also applied for CT reconstruction (Elbakri and Fessler, 2002). In essence, these algorithms treat the reconstruction as a statistical estimation problem and have the advantage that they can take into account the Poisson model noise in projection data. This results in lower noise levels with statistical reconstruction for the same data when compared with FBP reconstruction.
We believe that with the advances in computing power and hardware developments such as the use of graphics hardware (Kole and Beekman, 2006) or the cell broadband engines (Kachelriess et al., 2007), the iterative and statistical reconstruction algorithms will become more and more researched and used with micro-CT imaging. In general, they can cope with fewer, and more noisy, projections while providing adequate reconstruction image quality and dose reduction.
2.6 Image Quality
There is no single micro-CT system optimized for all imaging quality characteristics (spatial, low contrast, and temporal resolution, noise, scan time, FOV) at the same time. High image quality and reproducible quantitative micro-CT-based image values are required and towards this goal, a quality assurance phantom was recently introduced (Du et al., 2007). We discuss here some of the image quality parameters of current systems and show that in many cases, the systems are optimized for some characteristics while compromising others.
Spatial resolution refers essentially to the smallest distance between two structures that can be distinguished in an image. We note that spatial resolution is not equivalent to the spacing or size of the reconstructed voxels. These are usually smaller than the true resolution power of a system given by the modulation transfer function (MTF). For in vitro imaging the spatial resolution can be close to that of histologic microscopy, allowing scans at almost cellular resolution e.g. 5–10 μm (Holdsworth and Thornton, 2002).
For in vivo imaging of small animals, spatial resolution is sometimes sacrificed to allow faster scanning and lower radiation dose. As shown by Ritman (Ritman, 2007), for whole-body micro-CT images of rodents an isotropic voxel size of at least 100 μm is needed for scale equivalence to the highest resolution currently achieved in humans with clinical CT scanners. Such a resolution is sufficient to detect what Ritman describes as “basic functional units”, i.e. the collection of cells with specific purpose, such as the lobules of the liver or glomeruli in the kidney.
The recent flat-panel based small animal scanners (Du et al., 2007, Gupta et al., 2006) can optimize scan time at the cost of spatial resolution. Both systems were designed for dynamic imaging and allow very high speed data collection due to rotation times of few seconds: 1–16 sec for the General Electric Locus Ultra micro-CT scanner (Ross et al., 2006, Du et al., 2007) and 3–20 sec for the fpVCT system described in (Gupta et al., 2006). The rapid acquisition times come at the expense of spatial resolution (150 μm or 200 μm voxels), which is justifiable for applications that require the faster scan times; these include perfusion imaging, lung imaging, cardiac imaging and high through-put imaging.
Contrast Resolution is another important image quality characteristic and refers to the ability to resolve small differences between structures, based on contrast difference. Contrast arises from differences in the energy-dependent linear attenuation coefficient of different tissues.
As in clinical CT, the contrast mechanism in micro-CT is based on the attenuation of the X-rays and is proportional to the electron density. The grayscale values in the reconstructed voxels are therefore a quantitative description of the density of the material; different tissue types (e.g. bone, lung, soft tissue) appear with different gray scale values. In CT imaging the reconstructed values are given in Hounsfield units (HU) or CT numbers, which serve as a normalized description of a material relative to water. Typically air is reconstructed with a value of −1000 HU, water has a value of 0 HU and the bones are above 1000 HU. Contrast decreases with higher energies. X-ray photons with energy less than 25 keV interact mainly via the photoelectric effect, and their attenuation varies approximately as E−3, whereas at higher photon energies, where Compton scatter is the main mechanism of X-ray interaction with matter, the attenuation varies as E−0.5. These relationships suggest that higher contrast can be achieved at low photon energies, but the optimal energy is dependent on a number of additional factors beyond the interaction of the photons with the tissues, e.g. energy dependence of the detector and efficiency of photon production (Spanne, 1989). According to Grodzins (Grodzins, 1983) the X-ray photon energy should be selected to achieve an optimal, energy-dependent attenuation for each specimen diameter in order to maximizes CT image signal-to-noise ratio. For the case of a 3-cm diameter mouse, the highest contrast resolution is achieved at approximately 25 keV (monoenergetic) (Paulus et al., 2000).
Contrast resolution can be quantified using the contrast to noise ratio (CNR). CNR between structure A and the background B is computed as: where μA and μB are the mean values and σA and σB are the standard deviations in selected regions of interest in A and B. The ability to resolve structures is directly dependent on the noise level which in turn depends on the x-ray dose; CNR is proportional to the square root of applied dose (Kalender, 2000). In a practical system, CNR may be enhanced through reduction in image noise that may result from the selection of tube potential higher than 25 keV mean energy. The components of the imaging system also influence the contrast resolution. First of all, the x-ray tube must generate sufficient flux, as was indicated previously. Secondly, if the detector has higher quantum efficiency, fewer photons are required to provide an adequate signal. Similarly, the greater the detector’s dynamic range, the smaller would be the difference in photon flux that would be detectable.
Most of the commercial micro-CT scanners are not used in a mode that provides high contrast resolution, because of the inherent dose limitations associated with small voxel size. In many applications, contrast resolution is traded for increased spatial resolution, such as in the study of high contrast structures like calcified bones (Lee et al., 2003).
2.7 Contrast Agents
One of the major challenges for in vivo micro-CT is the low contrast between soft tissues. For example, the difference in absorption coefficient for gray matter and white matter in the brain is < 1% (i.e. < 10 HU). By comparison, the difference between the physical parameter T1 (the spin lattice relaxation time) that determines contrast in a T1-weighted magnetic resonance (MR) image is nearly 60%, hence the much higher contrast between grey matter and white matter in MR vs. CT.
To increase the contrast resolution with CT imaging, exogenous contrast agents, containing iodine-based non-ionic extracellular water-soluble compounds, are used. They are rapidly cleared from the blood within seconds after intravenous injections. Clinical slip-ring CT systems are fast enough to perform imaging during this first pass of the contrast agent occurring in only a few heart beats. However, due also to the higher heart rate of rodents (at least 10 times faster for mice than humans) most of micro-CT systems are not able acquire a sufficient number of projection images during the first pass of an extracellular contrast agent. In some selected applications however, such readily diffusible contrast agents may be used if they are given as a constant infusion (Badea et al., 2005) and have been shown particularly useful for delayed hyper enhancement in myocardial infarction imaging (Nahrendorf et al., 2007).
Alternatively, a new class of blood-pool contrast agent is now available for micro-CT in small animals. To achieve the blood pool effects i.e. the long retention in the vascular circulation, the size of the molecules in these contrast agents should be larger than that of capillary fenestrations. Additionally, phagocytosis by the reticuloendothelial system (RES) should be limited by chemical design such as pegylation. Weichert et al. introduced the first blood-pool agent for micro-CT (Weichert et al., 1998), which is now available commercially. Fenestra VC and LC (ART Advanced Research Technologies Inc. Saint-Laurent, Quebec, Canada) are commercial blood pool and hepatobiliary-selective DHOG agents, consisting of iodinated triglycerides formulated in a stable, sub-micron oil-in-water lipid emulsion (Vera and Mattrey, 2002) and containing 50 mg I/ml. Fenestra VC has been shown to reside in the blood pool for many hours and is slowly cleared through the hepatobilliary system, thereby providing an opportunity for selecting optimal time points, post injection, for imaging different organ systems (Ford et al., 2006). Fenestra VC has been used for both cardiac micro-CT (Badea et al., 2005; Drangova et al., 2007) and tumor imaging (Badea et al., 2006), (Graham et al., 2008). Cardiac gating and ventilatory synchronization were used on C57BL/6 mice to compare a conventional agent i.e. Isovue-370 infusion (1 ml/h) and a bolus injection of Fenestra VC to image the mouse heart (Badea et al., 2005). With Isovue a maximum mean enhancement of ~500 HU in the aorta was obtained at 60 min, whereas with Fenestra VC a maximum of ~620 HU was observed in the aorta at 20 min, and remained at ~500 HU during a 3-hour interval, allowing extended scans.
Recently, a liposome-based blood pool contrast agent with a higher iodine concentration (up to 100 mg I/ml) and a long residence time (Mukundan et al., 2006) was described as an alternative to Fenestra VC. Such nanoparticle contrast agents are gaining considerable attention not only in CT but also in MR imaging (Ghaghada et al., 2007) or even as agents containing both iodine and gadolinium for use as multimodality contrast agents for both CT and MR (Zheng et al., 2006).
Fenestra LC contrast agent has been described in (Bakan et al., 2001) and can be used to distinguish between liver parenchyma and liver tumors (Almajdub et al., 2007, Weber et al., 2004). Imaging studies of the spleen have been performed with both the hepatobiliary-selective (LC) and blood pool VC formulations (Almajdub et al., 2007). Recently Suckow et al. (Suckow and Stout, 2008) investigated mouse strain differences in the uptake of Fenestra LC in Nude, C57, and severe-combined immunodeficient (SCID) mice and found significant differences; this was a combined micro-PET/micro-CT study. Fenestra LC did not appear to attenuate 18F-labelled fluorodeoxy glucose (FDG) uptake at 15 ml/kg for most tissues; therefore, it can be also used in conjunction with microPET imaging studies. Recently, nanoparticle contrast agents, based on nanosized bismuth-sulfide with a polymer coating, have been described (Rabin et al., 2006). Interestingly, they were shown to have attenuation characteristics five-times better than Iodine-based agents, with longer residence time in the vasculature and good safety characteristics.
2.8 Gating
Physiological motion (cardiac and respiratory) in many cases poses the resolution limit in micro-CT. In these cases, spatial resolution can be markedly improved through the use of gating methods in which cardiac and/or respiratory states are measured and used to synchronize acquisition of the projection data at the same point in the cardiac and/or respiratory cycle. The precision with which one can control motion, using gating, defines the resolution limit that can be attained in such studies, and the magnitude of motion. Mai et al. (Mai et al., 2005) performed a study in rats to evaluate how reproducibly the heart and lung return to the same position through multiple exposures required for acquisition of a micro-CT study. Radio-opaque beads were surgically glued on the diaphragm of anesthetized, mechanically ventilated rats. Their range of motion (relative to a reference vertebral bead) was evaluated using digital micro-radiography with two specific biological pulse sequences: i) ventilation-synchronous acquisition, and ii) both ventilation-synchronous and cardiac gated acquisition.
The displacement of the diaphragm or the heart through the course of one ventilatory and cardiac cycle can be more than 1 mm. Gating therefore is essential in cardiopulmonary imaging of rodents. In this specific study, using both respiratory synchronization and cardiac gating, the standard deviation of the displacement of the beads from their reference location was less than 100 microns. As shown by Figure 2, with careful control of motion through cardio-respiratory gating, its impact on resolution can be limited. Indeed, with cardio-respiratory gating the blurring caused by the diaphragm or the heart is reduced while the details in the lung parenchyma are almost at the level of ex-vivo imaging. Papillary muscles become visible in the gated acquisition.
Figure 2.

Axial, oblique and coronal micro-CT images of the same C57BL/6 mouse scanned in vivo with 88 μm voxel size without (A,D,G) and with (B,E,H) cardio-respiratory gating using a a liposomal blood pool contrast agent. The images (C,F,I) were acquired ex-vivo. The arrows indicate how the heart wall and the papillary muscles are affected by motion when no gating was used (A,D), while becoming sharp with gating (B,E). The oval region of interest (ROI) shows how the diaphragm is blurred due to respiration motion (G) in comparison with the gated acquisition (H) or the ex-vivo scanning (I). Similarly, the circle ROIs focus on the lung parenchyma and display the clear advantage of gating (E) versus not gating the acquisition (D).
Therefore, gating is essential in cardiopulmonary imaging of rodents and it can be performed prospectively or retrospectively. In prospective gating, the image acquisition is triggered at predefined time points of the physiologic signals (ECG or respiratory signal). In retrospective gating, physiologic signals are recorded simultaneous with imaging data, and then post-acquisition, the projection data is sorted into sets corresponding to specified phases of respiratory or cardiac activity.
To control the respiratory motion, mechanical ventilation can be used (Badea et al., 2004, Namati et al., 2006, Cavanaugh et al., 2004, Cody et al., 2004). Special purpose mechanical systems were designed to ventilate the animals at a controlled rate and to provide the oxygen and anesthetic gas mixture, while also measuring the airway pressure via a pressure transducer in the breathing valve (Hedlund and Johnson, 2002). Gated image acquisition can be performed prospectively when there is minimal respiratory motion, such as in end-expiration or end-inspiration. Imaging the lung at these two physiological states can be performed and used to compute non-invasively the tidal volume and also to estimate such physiologic measures as lung compliance (Shofer et al., 2007, Guerrero et al., 2006). We should note however that endotrachial intubation is required for these procedures and this may be difficult, particularly in mice due to the small size of their trachea. The intubation procedure requires skills to avoid trachea damage. Ford et al. (Ford et al., 2005) have introduced an approach for prospective gating with free-breathing rodents, which does not require intubation, by using an external pressure sensor on the animal’s abdomen to get the respiratory signal. This method removes the drawbacks of intubation and mechanical ventilation, but is sensitive to changes in the breathing pattern of the animal (e.g. deep sighs). Retrospective gating of free-breathing rodents has also been introduced (Ford et al., 2007b). The authors performed dynamic respiratory imaging using a flat-panel detector based system with slip ring technology that allowed very fast acquisition i.e. less than 50 sec. Reconstructed images with 150 μm isotropic voxel size enabled quantitative measurements of both morphological and functional parameters such as tidal volumes and functional residual capacity (Ford et al., 2007a).
With respect to cardiac micro-CT imaging, both prospective and retrospective gating have been applied successfully. In fact, in vivo imaging of the mouse heart using micro-CT was considered, until not too long ago, to be “illusive” (Lazebnik and Wilson, 2001) or “impossible with the state of the art technology” (Yea et al., 2004).
4D micro-CT was first demonstrated using a prospective gating approach (Badea et al., 2005) for both respiration and cardiac activity and involved scanning mechanically ventilated animals. Prospective gating using breathing and cardiac events ensures uniform and sufficient angular sampling but can involve rather long acquisition times due to the fact that the images are triggered by the coincidence of two events – end-expiration in the breath cycle and the imaging time point (e.g. systole, diastole) in the cardiac cycle. 4D datasets with an isotropic voxel of 94 μm and a temporal resolution of 10 ms have been reported (Badea et al., 2007b).
Drangova et. al. (Drangova et al., 2007) described retrospective gating for cardiac micro-CT of free-breathing mice that provided very fast imaging (less than 1 minute) with 150 μm isotropic voxels and a temporal resolution of 12 ms. Recently, Bartling et al. (Bartling et al., 2007) have also applied retrospective gating for cardiac imaging in mice and rats, achieving a reconstructed voxel size of 200 μm. Both papers use very fast scanning, which is possible with flat-panel based detectors and rotating gantry systems. In retrospective gating, the projections are sampled at equal angular intervals but at specified points in the cardiac and breathing cycle. Both ECG and a respiration signal are recorded and used in post-processing to cluster the projections in sets corresponding to the cardiac and respiratory phases to be reconstructed. For each of the cardiac phases, the corresponding projections have an irregular angular distribution, since many views may be missing. The number of projections for each phase may be further limited when many cardiac phases are to be reconstructed from a limited number of projections. Because of this irregular and undersampled pattern, the reconstructed images are affected by noise and streaking artifacts, when analytical reconstruction algorithms such as Feldkamp’s (Feldkamp et al., 1984) are used (Drangova et al., 2007).
A sparseness prior based iterative reconstruction was proposed as an alternative reconstruction algorithm, able to deal with view undersampling problems (Song et al., 2007). Another solution was provided via registration and a combination of prospective and retrospective gating (Badea et al., 2008a). The retrospective gating technique is amenable to the simultaneous imaging of multiple mice and therefore to higher throughput, as has been shown with MR microscopy (Bishop et al., 2006). This option might be difficult with prospective gating without intubation because the cardiac and respiratory motions in different animals are completely asynchronous. However, the time saving benefits in an implementation of multiple-mouse CT microscopy might not be as substantial as with MRI, because the retrospectively gated CT scan protocols currently implemented are inherently much faster than the MRI protocols.
2.9 Radiation Dose
Dose is a special concern for in vivo micro-CT, especially if longitudinal studies are required. The dose is a function of the energy deposited through photon absorption and energy loss via Compton scattering interactions. The smaller voxels of micro-CT (relative to clinical CT) require much higher dose, since any voxel – independent of its size – needs to interact with a certain number of x-ray photons for adequate image quality (Faulkner and Moores, 1984; Brooks and Di Chiro, 1976). Therefore, in order to compensate for the reduction of the voxel size, the photon fluence must be much larger in micro-CT to achieve a signal-to-noise ratio comparable to clinical CT. If the photon noise (measured by its variance) is kept constant and the linear dimension of the voxel is reduced by 2 (i.e. a reduction of voxel volume by 8) the dose must be increased by up to 16 times (Ford et al., 2003; Kalender, 2000). Thus, although desirable, an increase in resolution for in-vivo micro-CT imaging is difficult to achieve, due to the associated increase in radiation dose risk. For example, in the case of an ideal micro-CT scanner, a coefficient of variation (defined as the ratio between the mean value and noise) with values of 1% can be obtained with images at 135 μm resolution and a dose of 0.25Gy. However if the resolution becomes 65 μm, the associated dose for the same COV values would be nearly 5Gy (Beckmann et al., 2007; Ford et al., 2003).
The effect of this ionizing radiation dose has been studied both numerically and experimentally for micro-CT (Taschereau et al., 2006, Boone et al., 2004). Boone et al. have shown that, at higher x-ray energies of 80–100 kVp, the absorbed dose to a rat or mouse is about 90–100% of the measured air kerma at the isocenter (Boone et al., 2004). Thus, the dose to an animal resulting from a specific micro-CT protocol can be easily estimated from the air kerma (measured with an ionization chamber and typically reported as Gy mAs−1). Dose limitations for small animals are typically expressed in terms of lethal dose (LD) for a population, i.e. LD50/30 refers to the whole-body radiation dose that would kill the 50% of the exposed animals within 30 days. The LD50/30 in mice is reported to range between 5–7.6 Gy (Ford et al., 2003, Taschereau et al., 2006). Typical x-ray whole body radiation dose for a 3D micro-CT scan reported in the literature ranges from a 0.017 Gy to 0.78Gy, depending on the diagnostic demand and the contrast resolution required (Carlson et al., 2007). Even higher doses e.g 1.5 Gy, were reported in initial studies for cine cardiac micro-CT, where as many as 10 datasets corresponding to ten phases in the cardiac cycle were required (Badea et al., 2005). The thorax and abdomen are the most radiosensitive regions of an animal, and the most important immediate deterministic effect of high-dose micro-CT would be radiation-induced pneumonitis, which can arise as a lethal complication when the thorax is exposed to over 1.9 Gy (Lehnert and Rybka, 1985). Fortunately, rodents have the ability to repair sub-lethal doses of radiation over periods of a few hours, so that repeated exposures of about 30 cGy have not compromised the survival of mice in previous studies (Parkins et al., 1985). Taschereau et al. have reported that the average whole-body dose for longitudinal micro-CT exams is likely to be less than 16 cGy (Taschereau et al., 2006), making it unlikely that radiation exposure will be a limiting factor for longitudinal studies using in vivo micro-CT. This exposure may be reduced even further in applications where higher noise can be tolerated – including bone imaging or contrast-enhanced imaging – and in studies where only a small portion of the animal must be irradiated.
3. In vivo Micro-CT Applications
3. 1 Bone Imaging
Micro-CT has been used to investigate the structure and density of rodent bone for decades (Feldkamp et al., 1989, Kinney et al., 1995), due to its high spatial resolution and high contrast in imaging mineralized tissues. In fact, the study of bone architecture and density drove the early developments of micro-CT systems (Ruegsegger et al., 1996). When applied to in vitro studies, the spatial resolution of dedicated bench-top systems approaches that provided by synchrotron sources (Chappard et al., 2006, Boyd et al., 2006). For in vivo applications, the acquisition protocol is constrained by dose to the animal (Ford et al., 2003), leading to a reduction in spatial resolution. Figure 3 demonstrates this effect, where we show ex vivo images of an excised rat femur, acquired with a bench-top micro-CT system operating at two nominal resolutions: 16 μm and 48 μm isotropic spacing. While it is possible to see much finer detail in the 16 μm image, the relative dose to the specimen (500 cGy versus 30 cGy for the high- and low-resolution images, respectively) indicates that longitudinal in vivo studies will typically be performed with reduced resolution.
Figure 3.

Example of the effect of reduced spatial resolution in ex vivo micro-CT imaging of rodent bones. In this case, an excised rat femur has been imaged for 3.5 hours (80 kVp, 740 mAs, 720 views), with nominal spatial resolution of 16 μm (A,C) and 48 μm (B,D). The magnified images (C,D) illustrate some loss in ability to discriminate small structures in the femoral head with reduced resolution.
Nonetheless, a nominal spatial resolution of about 50 μm has been shown to be effective in following live rats during studies of osteoarthritis (Appleton et al., 2007, McErlain et al., 2008) and bone remodeling (Cowan et al., 2007). Figure 4 shows how sequential images of the same animal – before and after surgery to induce osteoarthritis – can be used to quantify changes to boney anatomy and joint confirmation. The ability to apply micro-CT for longitudinal studies in orthopedic applications has also been demonstrated in the study of bone architecture changes over time (Waarsing et al., 2005, David et al., 2003), where parameters such as volumetric bone mineral density, bone volume ratio, bone surface ratio, and trabecular thickness etc. are reported.
Figure 4.

Longitudinal in vivo imaging of the progression of osteoarthritis (OA) in a rat model. The acquisition protocol (80 kVp, 190 mAs, 210 views) was designed to provide an appropriate entrance exposure (36 cGy) for repeated imaging. The same limb has been imaged before surgery (a,c) and two months following surgery (anterior cruciate ligament transection and partial meniscectomy) to induce OA (b,d). Post-surgery images demonstrate significant reduction in joint space (JS) in the medial compartment, remodeling of subchondral bone (SB), and pathological calcification of the patellar tendon (PT). 3D surface models of the joint (a,b) demonstrate the striking derangement of the joint over a period of 2 months; note the change in alignment of the femur (F) and tibia (T). Images courtesy of David McErlain, Robarts Research Institute, University of Western Ontario.
Some applications, such as studies of skeletal development (Guldberg et al., 2004), may accept lower resolution but require larger field of view, i.e. imaging the whole mouse or rat using the larger field-of-view offered by flat-panel based systems (Bartling et al., 2007b, Drangova et al., 2007, Missbach-Guentner et al., 2007). A prototype flat panel based volumetric CT (fpVCT) system was compared with clinical multislice CT (MSCT) systems for imaging small animals (Obenauer et al., 2007). Today’s MSCT spatial resolution is about 0.5 mm, making clinical systems sub-optimal for small-animal imaging (Obenauer et al., 2007). As expected, fpvCT outperformed MSCT and was able to provide anatomical data (200 μm voxel size) adequate for longitudinal studies involving skeletal structure in small animals.
3.2 Lung Imaging
Although CT is the method of choice for lung imaging, due to the inherent contrast provided at air/tissue interfaces, micro-CT in small animals has been challenging, due to the small size and rapid respiratory motion. As shown by (Ritman, 2005) a micro-CT voxel size on the order of 75 μm is required to provide anatomic resolution in the mouse comparable to that obtained in human CT. Nonetheless, micro-CT can be used successfully to study various lung-disease models, such as emphysema and fibrosis. An emphysema model was created in mice by using intra tracheal instillation of pancreatic elastase and imaged with micro-CT (Postnov et al., 2005). Emphysemic regions have shown lower HU values than the normal lung while the lung volume in these diseased animals was increased. Fibrosis models have also been created in mice, by instillation of bleomycin, and studied longitudinally with micro-CT during diseases progression (Shofer et al., 2007). The fibrotic lung regions are identified in micro-CT images by the resulting increase in HU. Furthermore, some studies have also shown that lung compliance can be measured in small animals using micro-CT, by implementing breath-holding over a range of specified pressures and calculating lung volumes from the corresponding images to produce a pressure-volume curve (Guerrero et al., 2006, Shofer et al., 2007). Micro-CT imaging-based compliance measurements were validated against the gold standard provided by quasi-static compliance measurements using a commercially available small animal ventilator (Shofer et al., 2007). The loss of pulmonary compliance was investigated in a study of irradiated mice (Guerrero et al., 2007). Lung tumor analysis is generally performed without the administration of a contrast agent. However in some lung disease models, the use of contrast agents may be beneficial since it may allow the assessment of the vascular density of the lung.
In vivo micro-CT also provides the capability for contrast-enhanced imaging of the rodent lung using stable xenon gas as an inhaled contrast agent. This procedure has been described in a study with adult rats (Lam et al., 2007). In this investigation, ventilated animals were scanned continuously for 40 s using a slip-ring based conebeam CT scanner, with the scan rate of 1Hz synchronized to the ventilation rate. By switching the ventilation supply from oxygen to a xenon gas mixture during the continuous scan, it was possible to create subtraction images, which indicated the xenon ventilation into the lung. This scanning protocol can also be implemented with breath-hold scanning (illustrated in Figure 5), where the animal is scanned after a prescribed numbers of breaths of xenon gas. This approach provides a number of different types of image data simultaneously, including anatomical sections, minimum intensity projections of lung and airway anatomy, xenon subtraction projections, and 3D characterization of lung geometry.
Figure 5.

Example data from in vivo xenon-enhanced contrast imaging of the rat lung. Breath-hold 3D CT image acquisition (8s scans with 0.152 mm isotropic spacing) provides both multi-planar reformatted (A) and minimum intensity projection (B) images of the air-filled lung, as well as images derived from subtraction of xenon-filled and air-filled lung images, illustrated by the maximum intensity projection in (C). Isotropic spatial resolution, combined with rapid breath-hold scanning facilitates automated segmentation of the lung and airway boundaries (D). Images courtesy of Dr. Giles Santyr, Robarts Research Institute, University of Western Ontario.
3.3 Cardiac Imaging
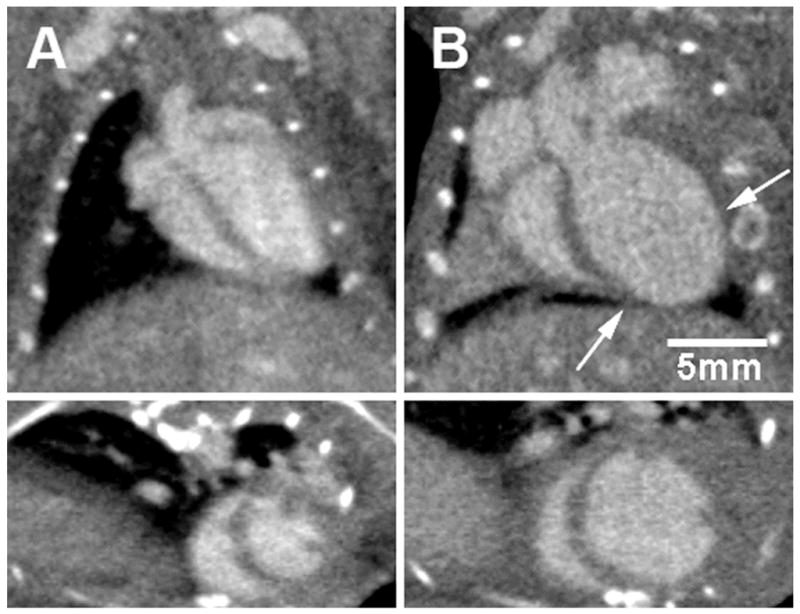
Micro-CT based cardiac morphological and functional imaging in mice and rats has been reported using both prospective and retrospective gating approaches (Badea et al., 2005, Badea et al., 2007b, Nahrendorf et al., 2007, Song et al., 2007, Badea et al., 2008, Drangova et al., 2007, Bartling et al., 2007a, Detombe et al., 2008). Using the prospective gating approach, 3D data are acquired at each desired phase of the cardiac cycle and scan times can be as long as 1 hr (Badea et al., 2005), while with the retrospective approach 3D images are acquired over the entire cycle during the same acquisition, with scan times as short as 50 s (Drangova et al., 2007). Using both approaches, quantitative estimates can be made for ejection fraction, stroke volume, and cardiac output on the basis of left ventricle (LV) volume measurements in the 4D (3D + time) micro-CT datasets. Examples of images acquired in a 4D micro-CT sequence, as well as a segmented and volume rendered LV lumen, are shown by Figure 6. Note how a reconstruction with 94 μm voxel size (Badea et al., 2007b) permits the high resolution visualization of the papillary muscles within the left-ventricular chamber (see Figure 6B). Cardiac micro-CT requires the use of contrast agents to be able to discriminate between the myocardium and blood. In most of the proposed studies blood-pool contrast agents have been used, although with faster scanning available with the flat panel based systems (Drangova et al., 2007, Bartling et al., 2007a) this may become optional in the future. Methods and software tools that allow the analysis of these 4D cardiac micro-CT image volumes to provide measures of cardiac function, such as ejection fraction and cardiac output, have also been proposed. The accuracy of these measurements was recently studied as a function of the volume of contrast agent and the number of projections used for reconstruction (Badea et al., 2008b). Reduction of the volume of contrast agent reduces hypervolimia effects on the hemodynamics, while the reduction in the number of projections translates directly into reduced radiation dose. It was determined that if 5% error in LV volumetric estimation is acceptable, as suggested for human cardiac CT (Haraokawa T et al., 2004), then sufficient cardiac micro-CT image quality could be provided with 126 projections and with a contrast dose of 0.25 ml Fenestra VC. Cardiac imaging with low-contrast-agent dose injection (0.1 ml Fenestra VC per g body weight) was successfully used to evaluate cardiac function in a longitudinal study of myocardial infarction in mice as shown in Figure 7. Detombe et al. used retrospective cardiac gating to scan mice weekly following a sham or coronary-ligation surgery to monitor LV remodeling post-infraction (Detombe et al., 2008). Assessment of cardiac function and infract size were also demonstrated by prospectively gated 4D micro-CT, where myocardial infract size was assessed using delayed contrast enhancement by combining the blood pool contrast agent Fenestra VC and an extracellular contrast agent (Nahrendorf et al., 2007).
Figure 6.

(A) Micro-CT images in the coronal orientation during 12 time points in the cardiac cycle (temporal resolution 10 ms). The spatial resolution is 0.1 mm and isotropic. (B) The 4D data is visualized and can be analyzed with semi-automatic tools (Badea et al., 2008b) to segment and measure the volume of blood in the left ventricle, based on which the cardiac function measures such as ejection fraction, stroke volume and cardiac output can be computed.
Figure 7.
Retrospectively gated cardiac micro-CT applied to the study of ventricular remodeling post myocardial infarction in C57Bl6 mice. Coronal long axis (top) and short-axis (bottom) images are shown of a mouse heart prior to (A) and 4 weeks following (B) myocardial infarction induced by ligation of the left anterior descending coronary artery. The arrows indicate the infarcted region near the apex of the left ventricle. 4D images were acquired in 50 seconds with isotropic voxel spacing of 150 μm and using a low-dose injection of Fenestra VC. Images courtesy of Sarah Detombe, Robarts Research Institute, University of Western Ontario.
Cardiac micro-CT also shows considerable promise as a tool for routine structural and functional phenotyping of transgenic and knock-out mouse models, as was demonstrated by Badea et al. who imaged transgenic muscle LIM protein–null mice to compared the micro-CT measurements with M-mode echocardiography in a model of heart failure (Badea et al., 2007b). Comparisons with other imaging modalities may be further required in order to establish micro-CT for large-scale use in cardiac research. MR microscopy is considered by some to be the gold standard for in vivo measurement of cardiac morphology function, and new methods, such as three-dimensional echocardiography, are often compared with MR microscopy (Dawson et al., 2004). Although not as flexible with respect to soft-tissue contrast mechanisms, micro-CT may have an advantage over MR microscopy by providing not only faster imaging but also isotropic resolution. This is typically not the case with most MR microscopy studies, in which a number of relatively thick short-axis slices (~ 1 mm) are scanned and the LV volume is estimated by interpolation between slices (Wiesmann et al., 2000). More recently, new echocardiographic systems (VisualSonics Inc. Toronto, Canada) have become available for small animals and are able to provide B-mode measurements in small animals (Cherin et al., 2006, Foster et al., 2002). We add, however, that although echocardiography seems to be the method of choice to estimate cardiac function, it still uses some model-based estimations that rely on geometric assumptions that are appropriate only for healthy hearts (Camici, 2003; Hoit and Walsh, 2001).
As with all in vivo micro-CT, the dose delivered to the animal must be considered. When prospectively gated cardiac micro-CT was initially proposed, it involved long scan times and a radiation dose of up to 1.5Gy. With retrospective gating, the entrance exposure was less than 0.3 Gy to reconstruct scans covering the entire cardiac cycle (Drangova et al., 2007). For prospective acquisitions, the dose can be reduced by scanning only selected phases of the cardiac cycle and with both approaches dose can be reduced by reducing the x-ray fluence at the expense of increased noise, provided that sufficient image quality can still be achieved to accurately extract the required functional parameters (see above).
3.4 Tumor Imaging
Micro-CT has proven useful in tumor detection and in imaging tumor angiogenesis. In terms of detecting lung tumors, micro-CT has been used to detect lung nodules with a minimum volume of 0.63 mm3 (Cody et al., 2005) when using a ventilator and a prospective triggering approach. Li et al. (Li et al., 2006) observed that, although the administration of a contrast agent such as Fenestra-VC was helpful in differentiating lung tumors from the heart and blood vessels, it did not improve the visibility of lung tumors in a nude mouse metastatic lung disease model.
Using Fenestra VC, Kindlmann et al. (Kindlmann et al., 2005) examined the intermediate and large vessels of alveolar rhabdomyosarcomas in a transgenic mouse model. The authors developed optimal scanning acquisition parameters and volume-rendering techniques to differentiate blood vessels from soft tissue and bone. The investigators suggested that micro-CT with Fenestra VC had the best potential for defining vessel diameter, tortuosity, and density for anti-angiogenesis models, but to visualize tumor capillaries it was necessary to develop instruments that had a higher resolution than those used in their study.
Micro-CT imaging studies were performed in nude mice bearing STC-1 tumors 15 and 30 days after grafting (Almajdub et al., 2007). Animals were injected with Fenestra LC and imaged at 2 and 4 h after the injection. The liver and spleen were clearly differentiated after administration of the contrast agent, reaching mean contrast-to-noise ratios of >2.0 for the liver and ~10 for the spleen at the different imaging times. In the spleen, quantification of the tumors with Fenestra-LC was not precise, whereas in the liver tumors (0.3–1.5 mm) were detectable at day 30. Significant amounts of the contrast media were observed to persist in the animals for up to 15 days after a single injection, allowing quantitative follow-up of tumors both in the liver and the spleen, without additional injection of contrast.
Liver tumor volumes have also been quantified in vivo using Fenestra VC mice injected with murine B16F1 melanoma cells; in this case Fenestra VC was used instead of Fenestra LC in order to remove the ambiguity between unopacified liver vessels and tumors in the liver by selecting a time point post contrast injection (8 hrs) when the vessels and liver are equally opacified (Graham et al., 2008). Because many liver metastases grow on the surface of the liver, a combined strategy of Fenestra VC plus an intraperitoneal injection of extracellular contrast agent (Figure 8) was shown to improve the precision and accuracy of tumor volume measurement and enables the quantitation of total tumor burden (Graham et al., 2008). These studies indicate that micro-CT, in combination with both IV and IP injections of contrast agent, is an accurate and precise tool for the longitudinal characterization of total tumor burden in mice.
Figure 8.

A) Liver enhancement 8 hours following the intravenous injection of Fenestra VC enables the clear distinction of liver metastases (black arrows in A) from liver tissue and blood vessels. The addition of intraperitoneal administration of iohexol greatly enhances the delineation of liver tumor borders when the tumors have grown on the surface of the liver (white arrow). The image in (A) is a coronal section from a retrospectively respiratory-gated micro-CT acquisition. B) Volumetric rendering of individual tumors and the entire liver. Images courtesy of Dr. Kevin Graham, University of Western Ontario.
Dynamic micro-CT has also been applied to the direct measure of perfusion in tumors following the injection of extracellular contrast agent (Kan et al., 2005, Phongkitkarun et al., 2004). Acquisition of perfusion information requires rapid scanning and has only become possible with the introduction of slip-ring based micro-CT scanners capable of acquiring 3D image data sets once per second for periods of a minute or longer (Du et al., 2007). To achieve adequate coverage in the longitudinal direction, the rapid scans often require a reduction in spatial resolution in the longitudinal direction. The images in Figure 10 represent an example of tissue perfusion measurements obtained of a tumor in the flank of a rat, 48 days following the injection of LoVo human colon carcinoma cells, as part of a longitudinal study. CT perfusion measurements enable the quantitative evaluation of functional parameters, such as blood flow, blood volume, and permeability-surface area product – a measure of the leakage rate of contrast from the capillaries into the intersticial space.
Figure 10.

Combined micro-SPECT and micro-CT, demonstrating bone imaging in a mouse model. Micro-CT data (A,C) was acquired over 220° during continuous gantry rotation, with acquisition parameters of 70 kVp and 88 mAs during a total CT acquisition interval of 130 s. The CT image was reconstructed using a modified Feldkamp cone beam algorithm with short-scan weighting, producing a volume image with 100 μm voxel spacing. Micro-SPECT data (B,C) was obtained in the same imaging session, using a multi-pinhole collimator consisting of seven, 1 mm diameter apertures placed at a fixed radius of 32 mm. SPECT data was acquired over 360° by rotating the collimator through 51 steps; reconstruction was performed with an energy acceptance window of 141 ±14 keV. Sub-millimeter spatial resolution in the SPECT image allows the distinction of metabolic activity within individual vertebrae; note in particular the elevated MDP uptake within joints (knee, shoulder) and in the mandible, as indicated by arrows in (d). At the same time, bone density and morphology is easily quantified using the micro-CT data (A,C). Note that, for clarity, bladder activity has been suppressed in this presentation of the SPECT data. Images courtesy of Dr. Tim Morgan, GE Healthcare, London, Ontario.
3.5 Multi-modality Imaging
Another way in which micro-CT can be used in the study of both function and anatomy is by combining it with other imaging modalities, such as single-photon emission tomography (SPECT). The use of multiple pinhole collimators has resulted in micro-SPECT systems exhibiting sub-millimeter resolution, which are well suited for in vivo studies of rats and mice (Beekman et al., 2005). It is typically advantageous to combine such a micro-SPECT system with micro-CT, in order to provide high-resolution co-registered images of anatomy (Ritman, 2002, Tai et al., 2008). Figure 10 illustrates the capability to perform co-registered acquisition of micro-SPECT and micro-CT data in a live mouse model. In this experiment, a 28 gm male C57 MDX mouse has been injected with 2 mCi of 99mTc-labelled methylene disphosphonate (MDP), 1.5 hours prior to imaging. Both SPECT and CT data were acquired with a dedicated small-animal scanner (eXplore speCZT Vision, GE Healthcare Bioscience, London ON). SPECT data was acquired using a full ring (10 heads) of pixelated cadmium zinc telluride (CZT) detector elements, where each detector consists of a 32 × 32 element array, with element spacing of 2.5 mm. A multi-pinhole collimator is used to collect data over an axial field of view of 30 mm (diameter). Following SPECT acquisition, the mouse was moved into the CT section of the scanner for a low-dose, anatomical micro-CT scan of the entire anatomy. Because the co-axial SPECT and CT scanners are mechanically co-registered, the CT anatomical data is inherently co-registered to the SPECT data. The example illustrates the potential for SPECT-CT acquisitions to provide both functional and anatomical information about bone growth and remodeling during longitudinal studies in a murine model.
4. Digital Subtraction Angiography
In many vascular studies, adequate information can be obtained from a 2D projection image. In this case, functional perfusion imaging, and angiographic imaging in general, can be addressed particularly well in small animal models using digital subtraction angiography (DSA). First suggested by Mistretta et al. (Mistretta et al., 1973), DSA is now a routine clinical exam. To date, there have been only limited studies using DSA in small animals (Lin et al., 2006, Kobayashi et al., 2004, Badea et al., 2006). Yet, potential exists for this modality given its ease of use, potential speed, and relatively low cost. Indeed, as shown by a number of publications (Badea et al., 2006, Lin et al., 2006, Badea et al., 2007a) DSA can be used successfully in small animals as a functional imaging method to assess perfusion using a mask subtraction approach. K-edge subtraction may also be used; however this technique may require a synchrotron source, which is not widely available (Schültke et al., 2005). We refer here mostly to the mask subtraction approach. DSA imaging involves the injection of a extracellular contrast agent and acquisition of images before and after the contrast injection. The images acquired before contrast injections are used to create a mask, which is subtracted from the post-contrast images, therefore displaying the local distribution of the contrast agent concentration in the subtracted image.
4.1 Instrumentation and Applications
In earlier work in mice and rats, the injections were given manually at low or varying flow rates (Kobayashi et al., 2004) and also not synchronized with the cardiac or ventilatory cycles. Similar to a power injector used in the clinical arena, a micro-injector is needed in designing an optimal system for small-animal digital subtraction angiography. The same micro-injector can be beneficial also in micro-CT based perfusion studies. Such a custom-built power micro-injector was recently described by (Lin et al., 2008) and consists of a computer-controlled solenoid valve attached to the contrast injection catheter, a heated contrast agent reservoir, and power from compressed N2 (90 PSI). For DSA studies, a diffusible contrast agent such as Isovue 370 mg I/mL (Bracco Diagnostics Inc., Princeton, NJ) was used. The micro-injector, which controls the volume of contrast agent via the injection time, was integrated with an imaging system based on a clinical X-ray angiography tube with a large focal spot, able to deliver sufficient flux with exposures times less than 10 ms (Badea et al., 2004). In fact, for DSA imaging we believe that only such types of large focal spots X-ray tubes are to be used due to the requirements for fast sampling. The micro-injector was integrated with imaging as well as with monitoring and gating applications. Dedicated biological pulse sequences were described that synchronized the timing of injections and imaging relative to the biological signals such as ECG or respiration(Badea et al., 2006; Badea et al., 2007a; Lin et al., 2008). The concept is analogous to the imaging pulse sequences common in MRI where a series of radio frequency pulses and gradients are applied, usually repetitively, to excite spins and sample the Fourier space that represents the object under study. In our analogy, the biological pulse sequence is executed by a LabVIEW program that samples varied physiologic inputs (e.g. airway pressure and ECG) and executes physiologic control, contrast injection, x-ray exposure and camera read out in a sequential fashion. In a typical pulse sequence for lung perfusion, an intubated rodent is put in suspended respiration for 5–10 secs and images are acquired synchronized on the R peak every ECG cycle. Consequently respiratory motion artifacts do not affect the DSA images. As an example of perfusion imaging of the lung, we present a time series of dynamic image from a DSA study of a rat before (top row) and after (bottom row) using a vasoconstrictor drug, i.e. phenylephrine (see Figure 11)(Lin et al., 2006). The reported spatial resolution was 92 μm and the temporal resolution 140 ms. Note the dramatic effects of the vasoconstrictor on vascular dynamics as seen in the prolonged mean transit time, amount of ventricular filling, and the size of the pulmonary arteries and aorta. The LabVIEW control of the (biological) sequence makes all of the elements of the sequence (respiratory state, injection time, injection volume, exposure time in the R-R interval) very reproducible. This in turn makes quantitative comparisons between blood flow (pre- and post- injection of vasoconstrictor) possible(Lin et al., 2006). Apart from lung perfusion imaging, DSA has also been used to assess tumor perfusion or to visualize the coronary arteries in rats or the vasculature of the liver or kidney at 46 μm resolution (Lin et al., 2008).
Figure 11.

Time series images of dynamic DSA study of a rat before (top row) and after (bottom row) phenylephrine injection. Note the dramatic effects of the vasoconstrictor on vascular dynamics as seen in the prolonged blood flow mean transit time, amount of ventricular filling, and the size of the pulmonary arteries and aorta (reproduced from Lin et al., 2006) [permission requested].
4.2 Tomographic DSA
To overcome the projection nature of DSA, tomosynthesis has been used to recover the depth information. Tomosynthesis, reviewed by Dobbins et al. (Dobbins and Godfrey, 2003), allows the post-acquisition tomographic reconstruction of any desired plane from a finite number of common digitized radiographs taken over a limited sampling arc. Tomographic digital subtraction angiography (TDSA), based on a tomosynthesis algorithm, was recently proposed for perfusion imaging in rodents (Badea et al., 2007a). The TDSA approach is based on the paradigm that the same time-density curves can be reproduced in a number of consecutive injections of contrast agent at a series of different angles of rotation. DSA sequences were obtained at a number of 21 angles on a limited arc of 40°. DSA projection images were clustered in time, based on a similar time attenuation curve, and a tomosynthesis reconstruction was used to create 4D datasets.
A comparison between the DSA and TDSA lung perfusion images is shown in Figure 12. Note how the depth discrimination reveals the pulmonary vessels (arrows) at the z = 4 mm TDSA slice. These vessels are masked by the superposition of other structures such as the right or left ventricle in the DSA sequence. TDSA allows 4D imaging i.e. both time evolution at heartbeat resolution (horizontal rectangle) and depth discrimination (vertical rectangle). While the temporal resolution is determined by the heart rate in rats, as in DSA, TDSA is able to provide the tomographic depth to separate structures that are overlapping in DSA imaging.
Figure 12.

A comparison at four selected heartbeats post-contrast injection i.e. (3rd, 4th, 8th, 15th) between DSA and three TDSA planes at 2 mm interval on z axis. A 40° arc was used for TDSA sampling. Note how the depth discrimination reveals the pulmonary vessels (arrows) at z = −4 mm TDSA slice. These vessels are masked by the superposition of other structures, such as the right or left ventricle in the DSA sequence. TDSA allows 4D imaging i.e. both time evolution at heartbeat resolution (horizontal rectangle) and depth discrimination (vertical rectangle). [reproduced with permission from Badea et al.(Badea et al., 2007a)]
4.3 Combined Micro-CT and DSA
Micro-CT and DSA modalities have been combined into a single system to provide both morphologic and functional data in tumors in a single imaging session (Badea et al., 2006). While micro-CT imaging with a blood pool contrast agent (Fenestra VC) was used to assess the 3D vascular architecture of the tumor, DSA imaging with a conventional contrast agent has been useful in assessing the tumor perfusion. An example of images from a combined study is shown in Figure 13, where micro-CT images through a Fibrosarcoma (FSA) tumor implanted on the flank of the left leg are shown as both a Maximum Intensity Projection (MIP) (figure 13A) and in 3 orthogonal planes (Figure 13 B–D). The relatively low contrast enhancement seen here suggests a poorly vascularized tumor, with predominately peripherally arranged arterial supply. On the other hand, as shown by figure 14 E, DSA with a conventional contrast agent, such as Isovue 370, provides images (spatially coregistered with the 3D micro-CT datasets) that show complementary functional information such as relative blood volume (rBV), relative blood flow (rBF), or relative mean transit time (rMTT). These were obtained using a singular value decomposition approach (Østergaard L et al., 1996).
Figure 13.

A combined micro-CT/DSA study of the fibrosarcoma tumor in a rat. (A) A Maximum Intensity Projection (MIP) of the tumor imaged with Micro-CT and a blood pool contrast agent. (B–D) images are three orthogonal Micro-CT slices through the tumor showing vascular enhancement. (E) Temporal MIP through the DSA data and the 3 perfusion maps i.e. rBV, rBF and rMTT images.
5. Conclusions
X-ray based imaging (micro-CT or DSA) can provide a reliable platform for in vivo small animal imaging that is complementary to other small animal methods. X-ray based methods can be used not only for morphological and but also more challenging functional imaging. While an exhaustive comparison of x-ray based methods to other small animal imaging techniques is beyond the scope of this review, some broad generalizations are possible. X-ray methods are generally faster and cheaper than micro-MRI and micro-PET. Spatial resolution for x-ray methods is certainly greater than micro-PET and usually higher than that of micro-MRI. But the sensitivity of x-ray methods to the presence of specialized probes falls far below of the other methods. New generations of ultrasound systems can provide higher spatial resolution than x-ray methods, are cheaper, and do not suffer the problems related to dose. But in 3D or 4D, micro-CT can provide considerably more accurate and precise measures of volumes than ultrasound. CT provides a particularly enhanced accuracy for cardiac studies where increased accuracy in measures of left ventricular volume promise much more sensitive measure of cardiac function. Radiation dose and the limited contrast available in x-ray methods can be a limitation; at the same time newer contrast agents and novel new acquisition and reconstruction strategies show extraordinary promise. The clinical domain has seen an extraordinary growth in CT technology with the introduction of 32, 64, and now 320 slice detectors (Rybicki et al., 2008). Improved acquisition strategies have opened a number of new clinical applications for cardiac CT. Multimodality (CT/PET and CT/SPECT) systems are now very common in the clinical domain and combined micro-CT/micro-PET or micro-CT/micro-SPECT systems have been reported (Liang et al., 2007, Chang et al., 2007). These developments, and exciting new opportunities in molecular imaging, will surely continue to expand the applications for micro-CT in the small animal.
Figure 9.

CT perfusion images of a rat flank 48 days following the implantation of LoVo human colon carcinoma cells (arrow). A) perfusion weighted map is used as the anatomical roadmap for the functional maps: B) blood flow, C) blood volume and D) permeability-surface area product. The perfusion maps were obtained with 150 μm voxels in plane. The slice thickness was 450 μm, which was required to achieve adequate FOV, acquisition speed, and SNR. One 3D image was acquired every second for one minute. Images courtesy of Dr. Ting Lee, Robarts Research Institute, University of Western Ontario.
Acknowledgments
Duke Center for In vivo Microscopy is an NCRR/NCI National Biomedical Technology Resource Center (P41 RR005959/U24 CA 092656). Also supported by R21 CA124584). Further funding was received from the Canadian Institutes of Health Research (MOP-67018, IMH-67018, MOP-81357), the Heart and Stroke Foundation of Ontario (NA 5578), and the Ontario Research and Development Challenge Fund. M.D. is a Career Investigator with the Heart and Stroke Foundation of Ontario. D.W.H. holds the Dr. Sandy Kirkley Chair in Musculoskeletal Research at the Schulich School of Medicine and Dentistry. The authors thank Dr. Tim Morgan, Sarah Detombe, David McErlain, Dr. Kevin Graham, Dr. Ting Lee, and Dr. Giles Santyr for providing images.
References
- Almajdub M, Nejjari M, Poncet G, Magnier L, Chereul E, Roche C, Janier M. In-vivo high-resolution X-ray microtomography for liver and spleen tumor assessment in mice. Contrast Media Mol Imaging. 2007;2:88–93. doi: 10.1002/cmmi.130. [DOI] [PubMed] [Google Scholar]
- Badea C, Fubara B, Hedlund L, Johnson G. 4D micro-CT of the mouse heart. Molecular Imaging. 2005;4:110–6. doi: 10.1162/15353500200504187. [DOI] [PubMed] [Google Scholar]
- Badea CT, Hedlund LW, Johnson GA. Micro-CT with respiratory and cardiac gating. Medical Physics. 2004;31:3324–9. doi: 10.1118/1.1812604. [DOI] [PMC free article] [PubMed] [Google Scholar]
- Badea CT, Hedlund LW, Lin MD, Boslego JF, Johnson GA. Tumor imaging in small animals with a combined micro-CT/micro-DSA system using iodinated conventional and blood pool contrast agents. Contrast Media and Molecular Imaging. 2006;1:153–64. doi: 10.1002/cmmi.103. [DOI] [PubMed] [Google Scholar]
- Badea CT, Hedlund LW, Lin MD, Mackel JS, Samei E, Johnson GA. Tomographic digital subtraction angiography for lung perfusion estimation in rodents. Medical Physics. 2007a;34:1546–55. doi: 10.1118/1.2717384. [DOI] [PMC free article] [PubMed] [Google Scholar]
- Badea CT, Hedlund LW, Mackel JF, Mao L, Rockman HA, Johnson GA. Cardiac Micro-Computed Tomography for Morphological and Functional Phenotyping of Muscle LIM Protein Null Mice. Mol Imaging. 2007b;6:261–8. [PMC free article] [PubMed] [Google Scholar]
- Badea CT, Schreibmann E, Fox T. A registration-based approach for cardiac micro-CT using combined prospective and retrospective gating. Medical Physics. 2008a;35:1170–9. doi: 10.1118/1.2868778. [DOI] [PMC free article] [PubMed] [Google Scholar]
- Badea CT, Wetzel AW, Mistry N, Pomerantz S, Nave D, Johnson GA. Left ventricle volume measurements in cardiac micro-CT: The impact of radiation dose and contrast agent. Comput Med Imaging Graph. 2008b;32:239–50. doi: 10.1016/j.compmedimag.2007.12.004. [DOI] [PMC free article] [PubMed] [Google Scholar]
- Bakan DA, Doerr-Stevens JK, Weichert JP, Longino MA, Lee FT, Jr, Counsell RE. Imaging efficacy of a hepatocyte-selective polyiodinated triglyceride for contrast-enhanced computed tomography. Am J Ther. 2001;8:359–65. doi: 10.1097/00045391-200109000-00009. [DOI] [PubMed] [Google Scholar]
- Bartling SH, Stiller W, Grasruck M, Schmidt B, Peschke P, Semmler W, Kiessling F. Retrospective motion gating in small animal CT of mice and rats. Invest Radiol. 2007;42:704–14. doi: 10.1097/RLI.0b013e318070dcad. [DOI] [PubMed] [Google Scholar]
- Beckmann N, Kneuer R, Gremlich HU, Karmouty-Quintana H, Ble FX, Muller M. In vivo mouse imaging and spectroscopy in drug discovery. NMR Biomed. 2007;20:154–85. doi: 10.1002/nbm.1153. [DOI] [PubMed] [Google Scholar]
- Beekman FJ, van der Have F, Vastenhouw B, van der Linden AJ, van Rijk PP, Burbach JP, Smidt MP. U-SPECT-I: a novel system for submillimeter-resolution tomography with radiolabeled molecules in mice. J Nucl Med. 2005;46:1194–200. [PubMed] [Google Scholar]
- Benson TM, Gregor J. Framework for Iterative Cone-Beam Micro-CT Reconstruction. IEEE Trans Nucl Sci. 2005;52:1335–40. [Google Scholar]
- Benson TM, Gregor J. Three-dimensional focus of attention for iterative cone-beam micro-CT reconstruction. Phys Med Biol. 2006;51:4533–46. doi: 10.1088/0031-9155/51/18/006. [DOI] [PubMed] [Google Scholar]
- Bishop J, Feintuch A, Bock NA, Nieman B, Dazai J, Davidson L, Henkelman RM. Retrospective gating for mouse cardiac MRI. Magn Reson Med. 2006;55:472–7. doi: 10.1002/mrm.20794. [DOI] [PubMed] [Google Scholar]
- Boone JM, Alexander GM, Seibert JA. A fluoroscopy-based computed tomography scanner for small specimen research. Invest Radiol. 1993;28:539–44. doi: 10.1097/00004424-199306000-00015. [DOI] [PubMed] [Google Scholar]
- Boone JM, Velazquez O, Cherry SR. Small-animal X-ray dose from micro-CT. Mol Imaging. 2004;3:149–58. doi: 10.1162/15353500200404118. [DOI] [PubMed] [Google Scholar]
- Brooks RA, Di Chiro G. Statistical limitations in x-ray reconstructive tomography. Med Phys. 1976;3:237–40. doi: 10.1118/1.594240. [DOI] [PubMed] [Google Scholar]
- Camici PG. Gated PET and ventricular volume. J Nucl Med. 2003;44:1662. [PubMed] [Google Scholar]
- Carlson SK, Classic KL, Bender CE, Russell SJ. Small animal absorbed radiation dose from serial micro-computed tomography imaging. Mol Imaging Biol. 2007;9:78–82. doi: 10.1007/s11307-007-0080-9. [DOI] [PubMed] [Google Scholar]
- Cody DD, Nelson CL, Bradley WM, Wislez M, Juroske D, Price RE, Zhou X, Bekele BN, Kurie JM. Murine lung tumor measurement using respiratory-gated microcomputed tomography. Invest Radiol. 2005;40:263–9. doi: 10.1097/01.rli.0000160070.67270.05. [DOI] [PubMed] [Google Scholar]
- Cowan CM, Aghaloo T, Chou YF, Walder B, Zhang X, Soo C, Ting K, Wu B. MicroCT evaluation of three-dimensional mineralization in response to BMP-2 doses in vitro and in critical sized rat calvarial defects. Tissue Eng. 2007;13:501–12. doi: 10.1089/ten.2006.0141. [DOI] [PubMed] [Google Scholar]
- Dawson D, Lygate CA, Saunders J, Schneider JE, Ye X, Hulbert K, Noble JA, Neubauer S. Quantitative 3-dimensional echocardiography for accurate and rapid cardiac phenotype characterization in mice. Circulation. 2004;110:1632–7. doi: 10.1161/01.CIR.0000142049.14227.AD. [DOI] [PubMed] [Google Scholar]
- Defrise M, Clack R. Filtered backprojection reconstruction of combined parallel beam and cone beam SPECT data. Phys Med Biol. 1995;40:1517–37. doi: 10.1088/0031-9155/40/9/010. [DOI] [PubMed] [Google Scholar]
- Detombe SA, Ford NL, Xiang F, Lu X, Feng Q, Drangova M. Longitudinal follow-up of cardiac structure and functional changes in an infarct mouse model using retrospectively gated micro-computed tomography. Invest Radiol. 2008 doi: 10.1097/RLI.0b013e3181727519. in press. [DOI] [PubMed] [Google Scholar]
- Dobbins JT, 3rd, Godfrey DJ. Digital x-ray tomosynthesis: current state of the art and clinical potential. Phys Med Biol. 2003;48:R65–106. doi: 10.1088/0031-9155/48/19/r01. [DOI] [PubMed] [Google Scholar]
- Drangova M, Ford NL, Detombe SA, Wheatley AR, Holdsworth DW. Fast Retrospectively Gated Quantitative Four-Dimensional (4D) Cardiac Micro Computed Tomography Imaging of Free-Breathing Mice. Invest Radiol. 2007;42:85–94. doi: 10.1097/01.rli.0000251572.56139.a3. [DOI] [PubMed] [Google Scholar]
- Du LY, Umoh J, Nikolov HN, Pollmann SI, Lee TY, Holdsworth DW. A quality assurance phantom for the performance evaluation of volumetric micro-CT systems. Phys Med Biol. 2007;52:7087–108. doi: 10.1088/0031-9155/52/23/021. [DOI] [PubMed] [Google Scholar]
- Elbakri IA, Fessler JA. Statistical image reconstruction for polyenergetic X-ray computed tomography. IEEE Trans Med Imaging. 2002;21:89–99. doi: 10.1109/42.993128. [DOI] [PubMed] [Google Scholar]
- Faulkner K, Moores BM. Noise and contrast detection in computed tomography images. Phys Med Biol. 1984;29:329–39. doi: 10.1088/0031-9155/29/4/003. [DOI] [PubMed] [Google Scholar]
- Feldkamp LA, Davis LC, Kress JW. Practical cone-beam algorithm. J Opt Soc Am. 1984;1:612–19. [Google Scholar]
- Flannery BP, Deckman HW, Roberge WG, D’Amico KL. Three-Dimensional X-ray Microtomography. Science. 1987;237:1439–44. doi: 10.1126/science.237.4821.1439. [DOI] [PubMed] [Google Scholar]
- Ford NL, Graham KC, Groom AC, Macdonald IC, Chambers AF, Holdsworth DW. Time-course characterization of the computed tomography contrast enhancement of an iodinated blood-pool contrast agent in mice using a volumetric flat-panel equipped computed tomography scanner. Invest Radiol. 2006;41:384–90. doi: 10.1097/01.rli.0000197981.66537.48. [DOI] [PubMed] [Google Scholar]
- Ford NL, Martin EL, Lewis JF, Veldhuizen RA, Drangova M, Holdsworth DW. In vivo characterization of lung morphology and function in anesthetized free-breathing mice using micro-computed tomography. J Appl Physiol. 2007a;102:2046–55. doi: 10.1152/japplphysiol.00629.2006. [DOI] [PubMed] [Google Scholar]
- Ford NL, Nikolov HN, Norley CJ, Thornton MM, Foster PJ, Drangova M, Holdsworth DW. Prospective respiratory-gated micro-CT of free breathing rodents. Med Phys. 2005;32:2888–98. doi: 10.1118/1.2013007. [DOI] [PubMed] [Google Scholar]
- Ford NL, Thornton MM, Holdsworth DW. Fundamental image quality limits for microcomputed tomography in small animals. Medical Physics. 2003;30:2869–77. doi: 10.1118/1.1617353. [DOI] [PubMed] [Google Scholar]
- Ford NL, Wheatley AR, Holdsworth DW, Drangova M. Optimization of a retrospective technique for respiratory-gated high speed micro-CT of free-breathing rodents. Phys Med Biol. 2007b;52:5749–69. doi: 10.1088/0031-9155/52/19/002. [DOI] [PubMed] [Google Scholar]
- Ghaghada KB, Bockhorst KH, Mukundan S, Jr, Annapragada AV, Narayana PA. High-resolution vascular imaging of the rat spine using liposomal blood pool MR agent. AJNR Am J Neuroradiol. 2007;28:48–53. [PMC free article] [PubMed] [Google Scholar]
- Goertzen AL, Nagarkar V, Street RA, Paulus MJ, Boone JM, Cherry SR. A comparison of x-ray detectors for mouse CT imaging. Phys Med Biol. 2004;49:5251–65. doi: 10.1088/0031-9155/49/23/004. [DOI] [PubMed] [Google Scholar]
- Gordon R, Bender R, Herman GT. Algebraic reconstruction techniques (ART) for three-dimensional electron microscopy and x-ray photography. J Theor Biol. 1970;29:471–81. doi: 10.1016/0022-5193(70)90109-8. [DOI] [PubMed] [Google Scholar]
- Graham KC, Ford NL, MacKenzie LT, Postenka CO, Groom AC, MacDonald IC, Holdsworth DW, Drangova M, Chambers AF. Noninvasive quantification of tumor volume in preclinical liver metastasis models using contrast-enhanced x-ray computed tomography. Invest Radiol. 2008;43:92–9. doi: 10.1097/RLI.0b013e31815603d7. [DOI] [PubMed] [Google Scholar]
- Grodzins L. Optimum energies for X-ray transmission tomography of small samples. Nucl Instrum Methods. 1983;206:541–5. [Google Scholar]
- Guerrero T, Castillo R, Noyola-Martinez J, Torres M, Zhou X, Guerra R, Cody D, Komaki R, Travis E. Reduction of pulmonary compliance found with high-resolution computed tomography in irradiated mice. Int J Radiat Oncol Biol Phys. 2007;67:879–87. doi: 10.1016/j.ijrobp.2006.10.037. [DOI] [PubMed] [Google Scholar]
- Guldberg RE, Lin AS, Coleman R, Robertson G, Duvall C. Microcomputed tomography imaging of skeletal development and growth. Birth Defects Res C Embryo Today. 2004;72:250–9. doi: 10.1002/bdrc.20016. [DOI] [PubMed] [Google Scholar]
- Gupta R, Grasruck M, Suess C, Bartling SH, Schmidt B, Stierstorfer K, Popescu S, Brady T, Flohr T. Ultra-high resolution flat-panel volume CT: fundamental principles, design architecture, and system characterization. Eur Radiol. 2006;16:1191–205. doi: 10.1007/s00330-006-0156-y. [DOI] [PubMed] [Google Scholar]
- Haraokawa T, Kido T, Higashino H, Mochizuki TYS. Accuracy of LV Volume Assessment Using Cardiac MSCT. RSNA 2004 [Google Scholar]
- Hedlund LW, Johnson GA. Mechanical ventilation for imaging the small animal lung. ILAR J. 2002;43:159–74. doi: 10.1093/ilar.43.3.159. [DOI] [PubMed] [Google Scholar]
- Hoit BD, Walsh RA. Cardiovascular Physiology in the Genetically Engineered Mouse. Kluwer Academic Publishers; 2001 . [Google Scholar]
- Holdsworth DW, Drangova M, Fenster A. A high-resolution XRII-based quantitative volume CT scanner. Med Phys. 1993;20:449–62. doi: 10.1118/1.597038. [DOI] [PubMed] [Google Scholar]
- Holdsworth DW, Thornton M. Micro-CT in small animal and specimen imaging. Trends in Biotechnology. 2002;20:S34–9. [Google Scholar]
- Hudson H, Larkin R. Accelerated image reconstruction using ordered subsets of projection data. IEEE Trans Med Imag. 1994;13:601–9. doi: 10.1109/42.363108. [DOI] [PubMed] [Google Scholar]
- Jorgensen SM, Demirkaya O, Ritman EL. Three-dimensional imaging of vasculature and parenchyma in intact rodent organs with X-ray micro-CT. American Journal of Physiology. 1998;275:H1103–14. doi: 10.1152/ajpheart.1998.275.3.H1103. [DOI] [PubMed] [Google Scholar]
- Kachelriess M, Knaup M, Bockenbach O. Hyperfast parallel-beam and cone-beam backprojection using the cell general purpose hardware. Med Phys. 2007;34:1474–86. doi: 10.1118/1.2710328. [DOI] [PubMed] [Google Scholar]
- Kak AC, Slaney M. Principles of Computerized Tomographic Imaging. New York: IEEE Press; 1988. [Google Scholar]
- Kalender W. Computed Tomography: Fundamentals, System Technology, Image Quality, Applications. Munich: Publicis MCD Verlag; 2000. [Google Scholar]
- Kindlmann GL, Weinstein DM, Jones GM, Johnson CR, Capecchi MR, Keller C. Practical vessel imaging by computed tomography in live transgenic mouse models for human tumors. Mol Imaging. 2005;4:417–24. doi: 10.2310/7290.2005.05166. [DOI] [PubMed] [Google Scholar]
- Kobayashi S, Hori M, Dono K, Nagano H, Umeshita K, Nakamori S, Sakon M, Osuga K, Umetani K, Murakami T, Nakamura H, Monden M. In vivo real-time microangiography of the liver in mice using synchrotron radiation. J Hepatol. 2004;40:405–8. doi: 10.1016/j.jhep.2003.11.029. [DOI] [PubMed] [Google Scholar]
- Kole JS, Beekman FJ. Evaluation of accelerated iterative x-ray CT image reconstruction using floating point graphics hardware. Phys Med Biol. 2006;51:875–89. doi: 10.1088/0031-9155/51/4/008. [DOI] [PubMed] [Google Scholar]
- Kujoory MA, Hillman BJ, Barrett HH. High-resolution computed tomography of the normal rat nephrogram. Invest Radiol. 1980;15:148–54. doi: 10.1097/00004424-198003000-00010. [DOI] [PubMed] [Google Scholar]
- Lam WW, Holdsworth DW, Du LY, Drangova M, McCormack DG, Santyr GE. Micro-CT imaging of rat lung ventilation using continuous image acquisition during xenon gas contrast enhancement. J Appl Physiol. 2007;103:1848–56. doi: 10.1152/japplphysiol.00009.2007. [DOI] [PubMed] [Google Scholar]
- Lazebnik RS, Wilson DL. Cardiovascular physiology in the genetically engineered mice. H B D: Kluwer Academic Publishers; 2001. pp. 377–96. [Google Scholar]
- Lee SC, Kim HK, Chun IK, Cho MH, Lee SY, Cho MH. A flat-panel detector based micro-CT system: performance evaluation for small-animal imaging. Phys Med Biol. 2003;48:4173–85. doi: 10.1088/0031-9155/48/24/014. [DOI] [PubMed] [Google Scholar]
- Lehnert S, Rybka WB. Dose rate dependence of response of mouse lung to irradiation. Br J Radiol. 1985;58:745–9. doi: 10.1259/0007-1285-58-692-745. [DOI] [PubMed] [Google Scholar]
- Li XF, Zanzonico P, Ling CC, O’Donoghue J. Visualization of experimental lung and bone metastases in live nude mice by X-ray micro-computed tomography. Technol Cancer Res Treat. 2006;5:147–55. [PubMed] [Google Scholar]
- Lin MD, Hedlund LW, Johnson GA. Biomedical Imaging: Nano to Macro 3rd IEEE International Symposium on. Arlington, VA: IEEE; 2006. Micro radiography imaging of the rodent with phenylephrine induced vascular hypertension; pp. 610–3. [Google Scholar]
- Lin MD, Ning L, Badea CT, Mistry NN, Qi Y, Johnson GA. A high precision contrast injector for small animal x-ray digital subtraction angiography. IEEE Transactions on Biomedical Engineering. 2008;2008:1082–91. doi: 10.1109/TBME.2007.909541. [DOI] [PMC free article] [PubMed] [Google Scholar]
- Mai W, Badea CT, Wheeler CT, Hedlund LW, Johnson GA. Effects of breathing and cardiac motion on the spatial resolution in microscopic imaging of rodents. Magnetic Resonance in Medicine. 2005;53:858–65. doi: 10.1002/mrm.20400. [DOI] [PubMed] [Google Scholar]
- Mistretta C, Ort M, Cameron J, Crummy A, Moran P. Multiple Image Subtraction Technique for Enhancing Low Contrast Periodic Objects. Investigative Radiology. 1973;8:43–9. doi: 10.1097/00004424-197301000-00007. [DOI] [PubMed] [Google Scholar]
- Mukundan S, Jr, Ghaghada KB, Badea CT, Kao CY, Hedlund LW, Provenzale JM, Johnson GA, Chen E, Bellamkonda RV, Annapragada A. A liposomal nanoscale contrast agent for preclinical CT in mice. AJR Am J Roentgenol. 2006;186:300–7. doi: 10.2214/AJR.05.0523. [DOI] [PubMed] [Google Scholar]
- Nahrendorf M, Badea C, Hedlund LW, Figueiredo JL, Sosnovik DE, Johnson GA, Weissleder R. High-resolution imaging of murine myocardial infarction with delayed-enhancement cine micro-CT. Am J Physiol Heart Circ Physiol. 2007;292:H3172–8. doi: 10.1152/ajpheart.01307.2006. [DOI] [PMC free article] [PubMed] [Google Scholar]
- Obenauer S, Dullin C, Heuser M. Flat panel detector-based volumetric computed tomography (fpVCT): performance evaluation of volumetric methods by using different phantoms in comparison to 64-multislice computed tomography. Invest Radiol. 2007;42:291–6. doi: 10.1097/01.rli.0000258663.13199.bf. [DOI] [PubMed] [Google Scholar]
- Østergaard L, Weisskoff RM, Chesler DA, Rosen CG. High resolution measurement of cerebral blood flow using intravascular tracer bolus passages: Part I. Mathematical approach and statistical analysis. Magn Reson Med. 1996:715–25. doi: 10.1002/mrm.1910360510. [DOI] [PubMed] [Google Scholar]
- Parkins CS, Fowler JF, Maughan RL, Roper MJ. Repair in mouse lung for up to 20 fractions of X rays or neutrons. Br J Radiol. 1985;58:225–41. doi: 10.1259/0007-1285-58-687-225. [DOI] [PubMed] [Google Scholar]
- Paulus M, Sari-Sarraf H, Gleason S, Bobrek M, Hicks JS, Johnson D, Behel J, Thompson L, Allen W. A New X-ray Computed Tomography System for Laboratory Mouse Imaging. IEEE Trans Nucl Sci. 1999;46:558–64. [Google Scholar]
- Paulus MJ, Gleason SS, Easterly ME, Foltz CJ. A review of high-resolution X-ray computed tomography and other imaging modalities for small animal research. Lab Anim (NY) 2001;30:36–45. [PubMed] [Google Scholar]
- Paulus MJ, Gleason SS, Kennel SJ, Hunsicker PR, Johnson DK. High resolution X-ray computed tomography: an emerging tool for small animal cancer research. Neoplasia. 2000;2:62–70. doi: 10.1038/sj.neo.7900069. [DOI] [PMC free article] [PubMed] [Google Scholar]
- Postnov AA, Meurrens K, Weiler H, Van Dyck D, Xu H, Terpstra P, De Clerck NM. In vivo assessment of emphysema in mice by high resolution X-ray microtomography. J Microsc. 2005;220:70–5. doi: 10.1111/j.1365-2818.2005.01510.x. [DOI] [PubMed] [Google Scholar]
- Rabin O, Manuel Perez J, Grimm J, Wojtkiewicz G, Weissleder R. An X-ray computed tomography imaging agent based on long-circulating bismuth sulphide nanoparticles. Nat Mater. 2006;5:118–22. doi: 10.1038/nmat1571. [DOI] [PubMed] [Google Scholar]
- Ritman EL. Micro-computed tomography-current status and developments. Annu Rev Biomed Eng. 2004;6:185–208. doi: 10.1146/annurev.bioeng.6.040803.140130. [DOI] [PubMed] [Google Scholar]
- Ritman EL. Micro-computed tomography of the lungs and pulmonary-vascular system. Proc Am Thorac Soc. 2005;2:477–80. 501. doi: 10.1513/pats.200508-080DS. [DOI] [PMC free article] [PubMed] [Google Scholar]
- Ritman EL. Small-animal CT: Its difference from, and impact on, clinical CT. Nuclear Instruments and Methods in Physics Research A. 2007:A 968–70. doi: 10.1016/j.nima.2007.06.040. [DOI] [PMC free article] [PubMed] [Google Scholar]
- Ross W, Cody DD, Hazle JD. Design and performance characteristics of a digital flat-panel computed tomography system. Med Phys. 2006;33:1888–901. doi: 10.1118/1.2198941. [DOI] [PubMed] [Google Scholar]
- Ruegsegger P, Koller B, Muller R. A microtomographic system for the nondestructive evaluation of bone architecture. Calcif Tissue Int. 1996;58:24–9. doi: 10.1007/BF02509542. [DOI] [PubMed] [Google Scholar]
- Rybicki FJ, Otero HJ, Steigner ML, Vorobiof G, Nallamshetty L, Mitsouras D, Ersoy H, Mather RT, Judy PF, Cai T, Coyner K, Schultz K, Whitmore AG, Di Carli MF. Initial evaluation of coronary images from 320-detector row computed tomography. Int J Cardiovasc Imaging. 2008 doi: 10.1007/s10554-008-9308-2. [DOI] [PubMed] [Google Scholar]
- Schültke E, Fiedler S, Kelly M, Griebel R, Juurlink B, LeDuc G, Estève F, Le Bas J-F, Renier M, Nemoz C, Meguro K. The potential for neurovascular intravenous angiography using K-edge digital subtraction angiography. Proceedings of he 4th International Workshop on Medical Applications of Synchrotron Radiation - MASR 2004. 2005;548:84–7. [Google Scholar]
- Shofer S, Badea C, Auerbach S, Schwartz DA, Johnson GA. A micro-computed tomography-based method for the measurement of pulmonary compliance in healthy and bleomycin-exposed mice. Exp Lung Res. 2007;33:169–83. doi: 10.1080/01902140701364458. [DOI] [PMC free article] [PubMed] [Google Scholar]
- Song J, Liu QH, Johnson GA, Badea CT. Sparseness prior based iterative image reconstruction for retrospectively gated cardiac micro-CT. Med Phys. 2007;34:4476–83. doi: 10.1118/1.2795830. [DOI] [PMC free article] [PubMed] [Google Scholar]
- Spanne P. X-ray energy optimisation in computed microtomography. Phys Med Biol. 1989;34:679–90. doi: 10.1088/0031-9155/34/6/004. [DOI] [PubMed] [Google Scholar]
- Suckow CE, Stout DB. MicroCT Liver Contrast Agent Enhancement Over Time, Dose, and Mouse Strain. Mol Imaging Biol. 2008;10:114–20. doi: 10.1007/s11307-007-0128-x. [DOI] [PubMed] [Google Scholar]
- Taschereau R, Chow PL, Chatziioannou AF. Monte carlo simulations of dose from microCT imaging procedures in a realistic mouse phantom. Med Phys. 2006;33:216–24. doi: 10.1118/1.2148333. [DOI] [PMC free article] [PubMed] [Google Scholar]
- Tuy H. An inversion formula for cone-beam reconstruction. SIAM J Appl Math. 1983;43:546–62. [Google Scholar]
- Vera DR, Mattrey RF. A molecular CT blood pool contrast agent. Acad Radiol. 2002;9:784–92. doi: 10.1016/s1076-6332(03)80348-3. [DOI] [PubMed] [Google Scholar]
- Volk M, Hamer OW, Feuerbach S, Strotzer M. Dose reduction in skeletal and chest radiography using a large-area flat-panel detector based on amorphous silicon and thallium-doped cesium iodide: technical background, basic image quality parameters, and review of the literature. Eur Radiol. 2004;14:827–34. doi: 10.1007/s00330-004-2243-2. [DOI] [PubMed] [Google Scholar]
- Wang G, Vannier M. Micro-CT scanners for biomedical applications: An overview. Advanced Imaging. 2001;16:18–27. [Google Scholar]
- Weichert JP, Lee FTJ, Longino MA, Chosey SG, Counsell RE. Lipid-Based blood pool CT imaging of the liver. Academic Radiol. 1998;5:S16–9. doi: 10.1016/s1076-6332(98)80047-0. [DOI] [PubMed] [Google Scholar]
- Wiesmann F, Ruff J, Hiller KH, Rommel E, Haase A, Neubauer S. Developmental changes of cardiac function and mass assessed with MRI in neonatal, juvenile, and adult mice. Am J Physiol Heart Circ Physiol. 2000;278:H652–7. doi: 10.1152/ajpheart.2000.278.2.H652. [DOI] [PubMed] [Google Scholar]
- Yaffe MJ, Rowlands JA. X-ray detectors for digital radiography. Phys Med Biol. 1997;42:1–39. doi: 10.1088/0031-9155/42/1/001. [DOI] [PubMed] [Google Scholar]
- Yea Y, Zhu J, Wang G. Geometric studies on variable radius spiral cone-beam scanning. Med Phys. 2004;31:1473–80. doi: 10.1118/1.1751251. [DOI] [PubMed] [Google Scholar]
- Zheng J, Perkins G, Kirilova A, Allen C, Jaffray DA. Multimodal contrast agent for combined computed tomography and magnetic resonance imaging applications. Invest Radiol. 2006;41:339–48. doi: 10.1097/01.rli.0000186568.50265.64. [DOI] [PubMed] [Google Scholar]