

Abstract
The existence of multiple nodes in the cortical network that integrate faces and voices suggests that they may be interacting and influencing each other during communication. To test the hypothesis that multisensory responses in auditory cortex are influenced by visual inputs from the superior temporal sulcus (STS), an association area, we recorded local field potentials and single neurons from both structures concurrently in monkeys. The functional interactions between the auditory cortex and the STS, as measured by spectral analyses, increased in strength during presentations of dynamic faces and voices relative to either communication signal alone. These interactions were not solely modulations of response strength, because the phase relationships were significantly less variable in the multisensory condition as well. A similar analysis of functional interactions within the auditory cortex revealed no similar interactions as a function of stimulus condition, nor did a control condition in which the dynamic face was replaced with a dynamic disk mimicking mouth movements. Single neuron data revealed that these intercortical interactions were reflected in the spiking output of auditory cortex and that such spiking output was coordinated with oscillations in the STS. The vast majority of single neurons that were responsive to voices showed integrative responses when faces, but not control stimuli, were presented in conjunction. Our data suggest that the integration of faces and voices is mediated at least in part by neuronal cooperation between auditory cortex and the STS and that interactions between these structures are a fast and efficient way of dealing with the multisensory communication signals.
Keywords: spike-field coherence, multisensory, gamma band, local field potential, cross-modal, lateral belt, TPO, superior temporal polysensory area
Introduction
The neurobiology of speech perception is based on primitives that are not tied to a single sensory modality. In support of this, numerous human functional magnetic resonance imaging and event-related potential studies show that large networks of cortical areas are activated by audiovisual speech, including association areas such as the superior temporal sulcus (STS) and parietal and prefrontal cortex, as well as sensory-specific areas such as the auditory cortex. Indeed, the latter shows integrative effects in response to multisensory speech or other vocal gestures and can even respond to visual speech alone (Sams et al., 1991; Calvert et al., 1997, 1999; Callan et al., 2001; Besle et al., 2004; van Wassenhove et al., 2005; Puce et al., 2007; Reale et al., 2007).
Since the discovery that auditory cortex is influenced by visual and tactile signals (Schroeder and Foxe, 2005; Ghazanfar and Schroeder, 2006; Driver and Noesselt, 2008), there has been much speculation as to the source of such signals to this “sensory-specific” brain region. Hypotheses suggest that association areas could act as “critical gateways” sending information to sensory-specific cortical areas (Calvert et al., 1998) and that multisensory effects seen in sensory-specific cortices like auditory cortex reflect feedback influences from these association areas (Driver and Noesselt, 2008). With reference to multisensory responses in auditory cortex, Campanella and Belin (2007) recently queried whether multisensory effects are mediated by feedback influences from association cortex in the form of coupled oscillations. We tested this hypothesis using a monkey model system.
Vocal communication in monkeys shows several parallels with human speech reading, making them an excellent model system for investigating the neurophysiological bases for face/voice integration. Macaque monkeys match faces to voices based on expression type and indexical cues (Ghazanfar and Logothetis, 2003; Ghazanfar et al., 2007), segregate competing multisensory vocal gestures (Jordan et al., 2005), and use similar eye movement strategies as humans when viewing vocalizing faces (Ghazanfar et al., 2006). Furthermore, such behaviors are mediated by circuits in the monkey neocortex that are similar to those activated by audiovisual speech in the human brain. Single neurons in the monkey STS integrate audiovisual biological motion, including vocalizations (Barraclough et al., 2005), as do neurons in the ventrolateral prefrontal cortex (Sugihara et al., 2006). Surprisingly, auditory cortex integrates faces and voices as well (Ghazanfar et al., 2005). The existence of multiple nodes in the cortical network that integrate faces and voices suggests that these nodes may be interacting with each other during communication.
We hypothesized that for face/voice integration in the monkey auditory cortex, the relevant source of visual input is the STS, based on both the dense connections between these structures (Seltzer and Pandya, 1994) and STS response properties, including sensitivity to faces and biological motion (Harries and Perrett, 1991; Oram and Perrett, 1994) and multisensory inputs (Bruce et al., 1981). One mechanism for establishing functional interactions between the STS and auditory cortex is transient coupling in the form of temporal correlations (Fries, 2005). In the present study, we tested whether the upper bank of the STS and the lateral belt of auditory cortex interact in this manner during face/voice integration by concurrently recording local field potentials (LFPs) and single units from both structures while monkeys viewed and/or listened to vocalizing conspecifics. Our data show that functional interactions between the auditory cortex and STS are not only enhanced during multisensory versus unimodal presentations of faces and voices, but that temporal coordination between these two structures becomes more robust. Finally, we reveal a similar relationship between the spiking activity in auditory cortex and the ongoing oscillatory activity in the STS. These results suggest that multisensory integration of faces and voices is mediated at least in part by functional interactions between the auditory cortex and the STS.
Materials and Methods
Subjects and surgery.
Two adult male rhesus monkeys (Macaca mulatta) were used in the experiments. For each monkey, we used preoperative whole-head magnetic resonance imaging (4.7 T magnet; 500 μm slices) to identify the stereotaxic coordinates of the auditory cortex and to model a three-dimensional skull reconstruction. From these skull models, we constructed custom-designed, form-fitting titanium headposts and recording chambers (Logothetis et al., 2002). The monkeys underwent sterile surgery for the implantation of a scleral search coil, headpost, and recording chamber. The inner diameter of the recording chamber was 19 mm and was vertically oriented to allow an approach to the superior surface of the superior temporal gyrus (Pfingst and O'Connor, 1980; Recanzone et al., 2000). All experiments were performed in compliance with the guidelines of the local authorities (Regierungspraesidium) and the European Community (EU VD 86/609/EEC) for the care and use of laboratory animals. The data reported are pooled across the two monkeys, because they both showed essentially similar results.
Stimuli.
The naturalistic stimuli were digital video clips of vocalizations produced by rhesus monkeys in the same colony as the subject monkeys. The stimuli were filmed while monkeys spontaneously vocalized in a primate restraint chair placed in a sound-attenuated room. This ensured that each video had similar visual and auditory background conditions and that the individuals were in similar postures when vocalizing. Vocalizations were four coos and four grunts. Videos were acquired at 30 frames per second (frame size, 720 × 480 pixels), whereas the audio tracks were acquired at 32 kHz and 16-bit resolution in mono. Across the vocalizations, the audio tracks were matched in average intensity. The clips were cropped to the beginning of the first mouth movement to the mouth closure at the end of vocalization (see Fig. 1 A). The duration of the video clips and auditory onset relative to the initial mouth movement varied according to the vocalization (see Fig. 1 A).
Figure 1.

Exemplars of the multisensory vocalization and control stimuli. A, Example of a coo call with disk control used in the study. The top panel shows frames at five intervals from the start of the video (the onset of mouth movement) until the end of mouth movement. Beneath the face frames are the disk frames used as control visual stimuli. x-axes depict time in milliseconds. The bottom panels display the time waveform and spectrogram of the vocalization, where the blue lines indicate the temporally corresponding video frames. B, Examples of other face- and disk-voice stimuli used in the study.
To test for the possibility that any multisensory integration that we observed was specific to faces and not just any arbitrary visual stimulus paired with the voice, we ran a control condition. Because there are many possible control stimuli for faces (none of which are ideal), we decided to use controls for which there are behavioral data. These were videos that mimicked the dynamics of the mouth movements in our natural video stimuli. These stimuli are similar to those used in human psychophysical studies of human speech reading (Bernstein et al., 2004; Schwartz et al., 2004). Human subjects can enhance their auditory speech detection with such control stimuli but not as well as they can with the face stimuli.
Our artificial mouth-movement videos were generated in Matlab (Mathworks, Natick, MA) using the Psychophysics Toolbox extensions (www.psychtoolbox.org). They consisted of expanding/contracting circular black disks on a gray background and mimicked the dynamics (opening, closing, and displacement) of the mouth in the natural videos. For each frame of each natural video, position and size of the mouth was estimated, and an approximately matching still frame of a disk was generated. This frame was compared with the corresponding frame of the natural video by overlaying the two frames using Adobe Premiere 6.0 software (Adobe Systems, Mountain View, CA). The position and size of the disk was then adjusted until it approximated the diameter of the mouth in the corresponding frame of the natural video (see Fig. 1 A). This procedure was repeated frame by frame, and movies were generated by adding sequences of frames for each movie.
Behavioral apparatus and paradigm.
Experiments were conducted in a double-walled, sound-attenuating booth lined with echo-attenuating foam. The monkey sat in a primate restraint chair in front of a 21-inch color monitor at a distance of 94 cm. On either side of the monitor were two speakers placed at the same level as the vocalizing faces that appeared on the screen. This reduced the spatial mismatch between the visual signals and the auditory signals.
The monkeys performed in a darkened booth, and a trial began with the appearance of a central fixation spot. The monkeys were required to fixate on this spot within a 1 or 2° radius for 500 ms. This was followed by either of the following: (1) the appearance of a video sequence with the audio track; (2) the appearance of the video alone (no audio); or (3) the audio track alone (black screen). The videos were displayed centrally at 10 × 6.6°, and the audio track was played at ∼72 dB (as measured by a sound level meter at 94 cm; C-weighted). In the visual conditions, the monkeys were required to view the video for its duration by restricting their eye movements within the video frame (Ghazanfar et al., 2005; Sugihara et al., 2006). Successful completion of a trial resulted in a juice reward. Eye position signals were digitized at a sampling rate of 200 Hz.
Data collection.
Recordings were made from the lateral belt regions of the left auditory cortex and the left upper bank of the STS using standard electrophysiological techniques. We used a custom-made multielectrode drive that allowed us to move up to eight electrodes independently (see below, Cortical distances). Guide tubes were used to penetrate the overlying tissue growth and dura. Electrodes were glass-coated tungsten wire with impedances between 1 and 3 MΩ (measured at 1 kHz). The stainless-steel chamber was used as the reference. Signals were amplified, filtered (1–5000 Hz), and acquired at 20.2 kHz sampling rate. Electrodes were lowered until multiunit cortical responses could be driven by auditory stimuli. Search stimuli included pure tones, frequency-modulated sweeps, noise bursts, clicks, and vocalizations. Using the analog multiunit signal (high-pass filtered at 500 Hz), frequency-tuning curves were collected for each site using 25 pure tone pips (100 Hz to 21 kHz) delivered at a single intensity level (72 dB). Initially, in both monkeys, we discerned a coarse tonotopic map representing high-to-low frequencies in the caudal-to-rostral direction. Such a map is identified as primary auditory cortex (A1); lateral belt areas are collinear with tonotopic areas in the core region (Hackett et al., 1998; Recanzone et al., 2000). The lateral belt area adjacent to A1 is the “middle lateral belt area.” This area was distinguished from A1 by its greater sensitivity to complex sounds than to pure tones, as reported in previous studies in both anesthetized and awake monkeys (Rauschecker et al., 1995; Barbour and Wang, 2003). These physiological criteria serve only as a rough guide, and it is likely that some of our electrodes were placed in rostrally adjacent belt regions. We therefore make reference only to “lateral belt” in this study.
After the identification of auditory cortex, locating the upper bank of the STS is straight-forward; it is the next section of gray matter ventral to the superior temporal plane. Therefore, electrodes would be lowered until auditory cortical activity ceases, followed by a short silent period representing the intervening white matter. The cortical activity after this silent period arises from the STS. Its visual responses were tested with faces and a variety of visual motion stimuli (Bruce et al., 1981). Our recordings targeted the TPO region of STS (also known as the superior temporal polysensory area), an area known to have robust responses to faces and multimodal stimuli (Bruce et al., 1981; Barraclough et al., 2005). TPO extends across almost the entire length of the STS and is face responsive (relative to scrambled face images) throughout its length (Hoffman et al., 2007). We did not fully characterize the response specificity of our STS cortical sites by testing faces versus other visual categories, nor would the diameter of recording chamber allow for a full mapping of the length of the TPO region. Therefore, we do not know which of our STS cortical sites were in the face-selective patches found along the length of this region (Harries and Perrett, 1991).
Cortical distances.
Recordings were made with two, staggered parallel arrays of four electrodes. The distance between the arrays was 2.0 mm, whereas the distance between electrodes within an array was 3.0 mm. Auditory cortical and STS recordings were always made such that if one electrode was in auditory cortex, the next closest electrode (the one in the adjacent array) would be placed in STS. Put another way, all the electrodes from one array would be placed in auditory cortex, whereas the electrodes in the adjacent array were placed in STS. Under these conditions, the auditory cortical sites were always 3.0 mm from each other, whereas the spacing between auditory cortical sites and STS were 2.0 mm away from each other, plus the additional difference in depth between the superior temporal plane and the upper bank of the STS. This difference increases as one moves in the posterior to anterior direction. Because we identified auditory cortex at all sites before moving a subset of electrodes deeper to the STS, we could calculate this distance. For example, across three recording sessions (and using the Pythagorean theorem), the nearest distance between an auditory cortical site and an STS site could range from ∼3 to ∼6 mm. In all our analyses, pair-wise interactions were only measured between the nearest adjacent cortical sites.
Data processing.
Single units were extracted from the raw neural signal using principle component-based off-line spike-sorting in combination with time–voltage window thresholds. Only well-isolated neurons were included in the analyses (a minimum 6:1 signal-to-noise ratio). The time series of spikes was averaged across trials and then convolved with a Gaussian kernel of a particular width to produce a spike density function (Richmond et al., 1990; Szucs, 1998). For our data, spike density functions were calculated by averaging spike trains and filtering with a 10 ms Gaussian kernel.
LFPs (the low-frequency range of the mean extracellular field potential) were extracted off-line by bandpass filtering the signal between 1 and 300 Hz using a four-pole, bidirectional Butterworth filter. LFPs were examined to ensure that the signal was not contaminated by 50 Hz line noise or other ambient noise.
Data analysis.
Basic response properties to each stimulus condition (Face+Voice, Voice alone, and Face alone) were assessed based on firing rates (single units) or with cross-spectra analyses (LFPs). In the single unit analyses, after subtracting baseline activity (300 ms before video onset), we used a point-wise “running” ANOVA to determine whether and when any significant differences are apparent between the three conditions. For example, for a spike density function, the first time point where the statistical test exceeds the 0.05 α criterion for at least 21 consecutive data points (>20 ms at a 1 kHz sampling rate) was considered the onset of a multisensory response (Guthrie and Buchwald, 1991; Murray et al., 2004).
Spectral analyses.
Spike trains and LFPs are rich signals, and it is readily apparent that analyzing data solely in terms of response magnitude (e.g., mean firing rates) is to ignore the information potentially embedded in the temporal structure of neural responses and the relationships between signals from the same or different locations. With this in mind, we used frequency-domain analytical techniques, which have been applied recently to neural data with great success. The frequency domain has several advantages over the time domain (Jarvis and Mitra, 2001).
We implemented these analyses using modified scripts based on the Chronux suite of Matlab routines (www.chronux.org) and Matlab scripts provided to us courtesy of Daeyeol Lee (Department of Neurobiology, Yale University School of Medicine, New Haven, CT). The Chronux suite provided the statistical and conceptual framework for analyzing these neural signals in the frequency domain, whereas the Lee scripts allowed us to incorporate the use of Morlet wavelet functions instead of the multitaper technique. Wavelet spectral analyses are widely used in the EEG, and more recently in the monkey LFP literature (Tallon-Baudry et al., 2004; Lakatos et al., 2007), and the use of wavelets allows us to circumvent some of the limitations of the traditional fast Fourier transform.
To identify the time–frequency relationships between two signals, we calculated the cross-spectrum between two LFP signals, which allowed us to (1) measure correlations between the two signals based on both amplitude and phase relationships; (2) measure the cross-spectra between a spike train and an LFP signal; and (3) calculate coherence between two signals by dividing the cross-spectra by the amplitudes of the original signals. We were also able to calculate a phase concentration (or Rayleigh) statistic, which identifies the degree of phase locking between two signals independently of amplitude information.
All the spectral analyses were based on wavelet spectra. This was computed by convolving the raw time series with a Morlet wavelet. The details of its implementation have been published previously (Mallat, 1999). We choose the wavelet width to be six. We choose frequencies according to the equation f = 2x /(8), xε(12, 12.5,13… 61), which gave us 99 frequencies ranging from 2.8284 to 197.403 Hz. The cross-spectra between two signals are a measure of the relationships between the amplitudes and phases of the two signals. Our cross-spectra analyses closely followed those outlined by Lee (2002). If there were no consistent phase relationships between the recording sites across trials, then the amplitude of the cross-spectrum would be very close to zero. This is because opposite phases across trials would be cancelled by each other in the complex plane. We defined wavelet coherence as the ratio of the cross-spectra to the product of the individual power spectra (Zhan et al., 2006). Coherence is not a perfect measure, because it mixes amplitude and phase information (Varela et al., 2001; Womelsdorf et al., 2007); however, it does normalize for amplitude.
Once we obtain the cross-spectra, we can look independently at the phase relationships between two structures using a phase concentration measure also called the mean resultant length (Varela et al., 2001; Lakatos et al., 2007). The phase concentration ranges from zero to one. Values closer to zero suggest that the phase values are uniformly distributed. Values closer to one suggest that the phase is highly concentrated at a particular angle. Phase concentration provides a measure of how close the phase values are to each other across trials. In the case of the cross-spectra, the phase concentration identifies whether there is a consistent phase difference between local field potentials from cortical sites in auditory cortex and cortical sites in the STS. Phase concentration is particularly useful because it removes amplitude information from the cross-spectra. This measure of phase concentration is very similar to the “phase synchrony” measure used by Lachaux et al. (1999), except that we did not use narrow bandpassed signals as our inputs. We averaged the concentration parameter across all cortical sites and calls to compute statistics for the phase concentration.
Once we identified relevant frequency bands by wavelet methods, we used a bandpass filter to compute signals in a given frequency band. This allowed us to independently verify whether the signals we observed using wavelet analysis were also reflected in the time domain.
Normalization.
For most analyses, data during stimulus conditions were normalized to individual baselines by the mean of the wavelet estimates for the baseline period.
Statistics.
Parametric and nonparametric tests were performed, and 95% confidence intervals were used to identify whether significant differences were present between conditions. We used a bootstrap method to calculate the confidence intervals for the cross-spectra. Data for each pair of cortical sites and across all calls were pooled, and the mean wavelet cross-spectrum was estimated. Resampled cross-spectra were generated by selecting a subset of the original set of trials and generating estimates of the cross-spectrum. Four hundred resampled cross-spectra were used to compute the SE of the wavelet cross-spectrum. Bootstrap t tests were used to test for significant differences in single exemplars.
The difference masks were computed by comparing the 95% confidence intervals. This mask was then multiplied by the actual difference between the conditions to obtain the difference plots. We used these difference masks to obtain statistics about the number of sites, which showed significant differences between conditions, and to highlight differences between a condition and baseline. SEs for the population were obtained by computing SDs for the absolute cross-spectra across all calls and pairs after computing average cross-spectra for each pair of cortical sites. These SEs were converted to 95% confidence intervals and used to compute the difference masks between conditions for the population response. Variance obtained across cortical sites and calls was used to compute F and T tests for comparing across conditions.
A combination of parametric and nonparametric statistics was used, because cross-spectra are calculated across trials. Therefore, to arrive at SEs for the single exemplars, we used nonparametric bootstrap methods. Similarly, our difference masks serve to highlight regions that are significantly different from each other. We use 1.96 times the SE as a confidence interval to identify significant differences. Our results are unchanged if we use parametric t tests to create difference masks between conditions. This is because p < 0.05 corresponds to 1.96 times the SE for normal variables. Finally, when we were satisfied that across cortical sites there was no gross deviation from normality, we used the parametric tests (ANOVAs and t tests).
Peak-triggered averaging.
To identify the contribution of STS responses to multisensory events in auditory cortex, we identified for each responsive neuron the first time point at which the multisensory response was significantly different from the auditory response. We took this time point as reference and epoched the STS local field response 200 ms before and 100 ms after the event. This epoched LFP response represents a short time segment around a significant multisensory response, which we can analyze to identify the events in STS that could potentially influence auditory neurons. We then computed the wavelet spectrum of this signal to identify whether there was any activity in different frequency bands in STS related to the multisensory effect. To ensure that we were not confusing increased power in STS with the phase of STS LFP responses, we also computed the phase concentration in the gamma band after bandpass filtering in the 55–95 Hz band to identify that the multisensory responses are influenced by activity in STS.
Results
We made parallel recordings of single units and LFPs from auditory cortex and the STS in two monkeys while they performed a viewing task. During the task, subjects watched and/or heard conspecifics producing two types of affiliative vocalizations, coos and grunts. We used affiliative calls to reduce the possibility that changes in neural activity could be attributed to increased arousal or fear that might be induced by other calls such as screams, threats, or alarm calls. Both coos and grunts have unique auditory and visual components (Fig. 1 A) and are frequently produced by captive monkeys; therefore, they had considerable experience with them as opposed to other calls in the vocal repertoire. Coos are long duration, tonal calls produced with the lips protruded. Grunts are short duration, noisy calls produced with a more subtle mouth opening and no lip protrusion.
The stimulus set was based on eight vocalizations: four coos and four grunts from different monkeys. We chose to focus on multiple exemplars of two calls as opposed to single exemplars of multiple calls, because by using multiple exemplars, we could investigate whether neural responses were biased toward one call type and because an increasing amount of ethological evidence from monkeys suggests that who is producing a call is often more salient than what event the call might signify (Cheney and Seyfarth, 2007). It should be noted, however, that the faces and voices of other call types, such as alarm calls or screams, may be integrated differently, because they may activate different or additional neural regions and/or the salience of the auditory or visual components of the calls may vary relative to other call types (Ghazanfar and Logothetis, 2003; Parr, 2004). There were four stimulus conditions: (1) Face+Voice, (2) Voice alone, (3) Face alone, and (4) Disk+Voice (Fig. 1 A,B). The latter condition, Disk+Voice, was a control condition in which a dynamic black disk on a light gray background mimicked the diameter of mouth opening and mouth position of the face, on a frame-by-frame basis. Human subjects can use nearly identical visual stimuli to enhance speech perception, but not to the same degree as the real dynamic face (Bernstein et al., 2004; Schwartz et al., 2004). In essence, the disk stimuli controlled for the onset and offset of a generic visual stimulus and for visual motion in the mouth region. During the presentation of visual conditions, monkeys were required to maintain fixation within the video frame.
Functional interactions between auditory cortex and the STS
We recorded simultaneously from both auditory cortex and the STS to test the idea that they enhanced their functional interactions during multisensory processing of vocal signals. Figure 2 A shows two examples of single units that respond to our face/voice stimuli that confirm we were indeed recording from the STS. Responses were primarily visual, occasionally auditory, and could integrate both types of information, properties consistent with a previous study of the STS (Barraclough et al., 2005). To measure the degree of functional interactions between these two regions during multisensory versus unimodal processing, we focused on meso-scale level activity in the form of LFPs recorded from both structures. Interareal interactions are difficult to discern at the single neuron level (Varela et al., 2001), and LFPs are ideal in that they reflect the coordinated behavior of local populations of neurons (Logothetis, 2002).
Figure 2.
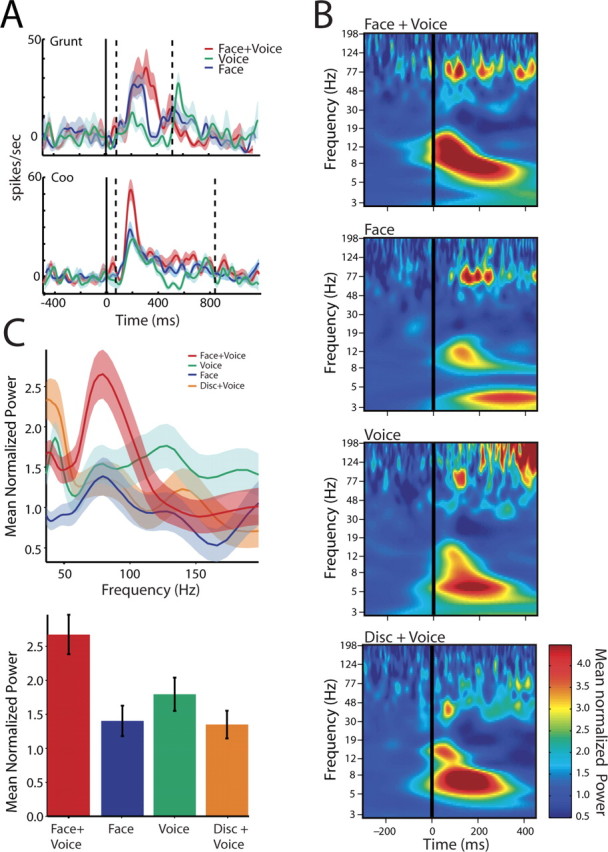
Cross spectra between local field potentials in auditory cortex and the superior temporal sulcus from a single pair of cortical sites. A, Peristimulus time histograms show the response of the neurons in the STS to two different vocalizations, a grunt and a coo. B, Time–frequency plots (cross-spectrograms) show the average phase-locked cross-spectral power for a single pair of cortical sites. Cross-spectra are averages of 80 trials across all calls and aligned to the onset of the auditory signal. x-axes depict the time in milliseconds as a function of onset of the auditory signal (solid black line). y-axes depict the frequency of the oscillations in hertz. The color bar indicates the amplitude of these signals normalized by the baseline mean. C, The top panel shows the normalized cross-spectra as a function of frequency for the corresponding responses shown in B. x-axes depict frequency in hertz. y-axes depict the average baseline mean normalized cross-spectral power from 0 to 200 ms. Shaded regions denote the SEM computed by a bootstrap method. The bottom panel shows the average normalized cross-spectra across all calls and electrode pairs in the gamma band for the four conditions from 0 to 200 ms after auditory onset. All values are normalized by the baseline mean cross-spectra for different frequency bands.
We used cross-spectra as a measure of functional interactions between auditory cortical and STS LFP signals as a function of stimulus condition. The cross-spectrum reveals the frequency band-specific interactions between the LFP signals recorded from the two structures. The power of the cross-spectrum is mediated by coordinated changes in both the response magnitude and the variability in the timing of the two oscillations relative to each other (i.e., their phase relationship). Because neither the raw LFP responses (Ghazanfar et al., 2005) nor the single-unit responses (see below) show differences in the magnitude of multisensory integration for coos versus grunts, hereafter, we pooled together the responses to both call categories. Figure 2 B shows the cross-spectrograms for one pair of recording sites, with one electrode in the auditory cortex and the other in STS, across all eight vocalizations (10 trials per call) and aligned to the onset of the auditory component. All responses were normalized to the mean baseline activity. In addition to the strong transient low-frequency (<24 Hz) modulation seen in the Face+Voice and Voice alone conditions, there was sustained activity in the high-frequency gamma range. Furthermore, gamma band power is stronger and more sustained in the stimulus conditions with Faces than in the Voice alone condition. The cross-spectral power in the gamma range for this electrode pair is plotted in Figure 2 C. Activity in the gamma range was estimated in a 200 ms window starting at the auditory onset. The Face+Voice condition elicits greater gamma band cross-spectral power than in either of the unimodal conditions or the Disk+Voice condition. The responses to the Face+Voice condition was significantly different from the Voice alone condition (t (158) = 2.1375; p = 0.0341), the Face alone condition (t (158) = 3.0921; p = 0.0023), and the Disk+Voice condition (t (158) = 3.2244; p = 0.0015).
Across the population of auditory-STS pairs (n = 68), the same pattern was observed. Figure 3 A shows the population cross-spectrograms, where clear and sustained gamma band enhancement in the Face+Voice condition is evident relative to either the unimodal conditions or the Disk+Voice condition. This is more apparent in the difference masks shown in Figure 3 B. In these plots, the Face+Voice condition is subtracted from the Voice alone condition and the Disk+Voice condition, revealing only those areas that are significantly different and color coded according to the magnitude of this difference. Positive values indicate a significantly greater response from the Face+Voice condition. Note that the difference masks reveal that there is significant gamma activity before the onset of the voice. This is attributable to the presence of the face, which appears before the voice onset (Fig. 1 A). This time difference is natural in human and monkey vocalizations. The cross-spectral power for each of the stimulus conditions is plotted in Figure 3 C for the 300 ms after auditory onset. An ANOVA on these data reveal a significant interaction (F (3,1760) = 6.9316; p = 3.4 × 10⁻⁵) and significant post hoc differences between the Face+Voice condition and the unimodal conditions (vs Voice alone, t (880) = 2.40, p = 0.022; vs Face alone, t (880) = 3.95, p = 0.0002) and the Disk+Voice condition (t (880) = 2.1436; p = 0.0303). This pattern held true when the data from each monkey were analyzed separately (Monkey 1, F (3,540) = 4.14, p = 0.007 with all post hoc t tests vs Face+Voice, p < 0.05; Monkey 2, F (3,1212) = 3.89, p = 0.009 with all post hoc t tests vs Face+Voice, p < 0.05). Therefore, face/voice inputs enhance gamma band interactions between auditory cortex and the STS. The dynamic disks used as control stimuli simulated biological motion, and the STS is known to be responsive to these and other visual motion cues (Puce and Perrett, 2003). In light of this, the lack of similarity between the Face+Voice and Disk+Voice cross-spectral responses suggests the functional interactions between STS and auditory cortex depend on the behavioral significance of the auditory-visual association.
Figure 3.
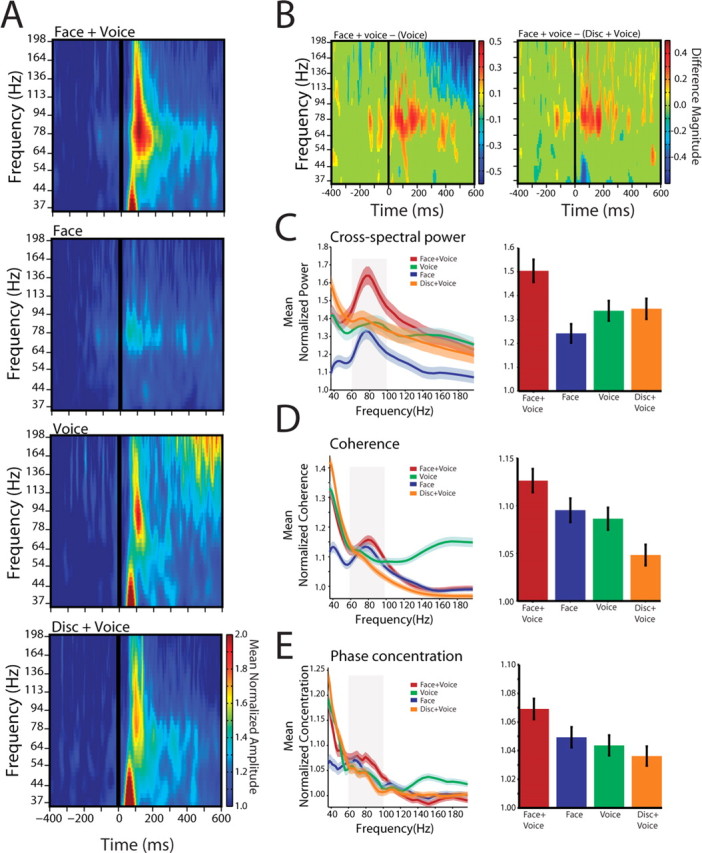
Auditory cortical-STS interactions across the population. A, Population cross-spectrogram for all auditory cortical-STS pairs for the four conditions. Conventions are as in Figure 2 B. B, Difference masks between the cross-spectra for the Face+Voice versus Voice condition and Face+Voice versus Disk+Voice conditions. x-axes depict the time in milliseconds. y-axes depict frequency in hertz. The color bar shows the difference magnitude obtained from the time difference mask. C, Population cross-spectra for different frequencies from 0 to 300 ms after voice onset. x-axes depict frequency in hertz. y-axes depict the average normalized cross-spectral power as a function of time. Shaded regions denote the SEM across all electrode pairs and calls. All values are normalized by the baseline mean for different frequency bands. The right panel shows the average normalized cross-spectra across all calls and electrode pairs in the gamma band (55–95 Hz). D, Population coherence from 0 to 300 ms after voice onset. x-axes depict frequency in hertz. y-axes depict the average normalized coherence. Shaded regions denote the SEM across all electrode pairs and calls. All values are normalized by the baseline mean for different frequency bands. The right panel shows the average normalized coherence across all calls and electrode pairs in the gamma band. E, Population phase concentration from 0 to 300 ms after voice onset. x-axes depict frequency in hertz. y-axes depict the average normalized phase concentration. Shaded regions denote the SEM across all electrode pairs and calls. All values are normalized by the baseline mean for different frequency bands. The right panel shows the phase concentration across all calls and electrode pairs in the gamma band for the four conditions.
The cross-spectra could be influenced by changes in amplitude in only one of the individual cortical structures. To test for this, we measured the coherence by normalizing the cross-spectrum by the product of the power spectra from each cortical structure. This allows one to eliminate the possibility that large power changes in one of the structures was driving the entire response in the cross-spectrum analyses. Coherence between the two structures was significantly different in the gamma band (F (3,1760) = 6.38; p = 0.0003) (Fig. 3 D). Pair-wise comparisons show that the Face+Voice condition was significantly different from the Voice alone condition (t (880) = 2.52; p = 0.0116) and the Disk+Voice condition (t (880) = 4.612; p = 4.44 × 10⁻⁶), with a marginal difference relative to the Face alone condition (t (880) = 1.72; p = 0.08). Overall, the coherence analysis suggests that an overall increase in power did not contribute alone to the multisensory effects seen in the cross-spectra.
To determine whether there is any change in the temporal coordination (independent of power changes) between the auditory cortex and the STS that varies as function of stimulus condition, we measured the phase concentration. The phase concentration is a measure of the variability in the phase relationship between two oscillations in a particular frequency band (gamma band, in our case) (Varela et al., 2001; Womelsdorf et al., 2007). An increase in phase concentration means that, across trials, there is less variability in the phase difference between the two cortical structures (i.e., their temporal coordination is tighter). In our data, the temporal coordination is tighter during the Face+Voice conditions relative to the unimodal conditions and the Disk+Voice condition (F (3,1760) = 3.82; p = 0.0096). Figure 3 E illustrates the population level phase concentration across all calls as a function of frequency for the 300 ms after auditory onset. Phase concentration was significantly higher in the Face+Voice condition than in the Voice alone (t (880) = 2.72; p = 0.007) and Disk+Voice (t (880) = 3.09; p = 0.002) conditions and marginally so compared with the Face alone condition (t (880) = 1.90; p = 0.056).
Incidentally, there is a massive increase of coupling activity in the very high-frequency range (>100 Hz) in the Voice alone condition (Figs. 2, 3). We are not certain what accounts for this, but it is related to the off-response to the vocalizations. What is interesting is that this off-response seems to be suppressed by both the Face and the Disk stimuli.
Functional interactions within the lateral belt auditory cortex
It is possible that the increase in functional interactions between auditory cortex and STS described above is caused by a global or more general increase in functional interactions as a result of increased attention or arousal during the Face+Voice condition. To test for this possibility, we analyzed the cross-spectra between cortical sites within the lateral belt auditory cortex. Although there were strong functional interactions within auditory cortex (Brosch et al., 2002), there were little or no differences between the Face+Voice, Disk+Voice, and Voice alone conditions. Not surprisingly, there was virtually no activity in the Face alone condition. As shown in Figure 4 A, across the population (n = 56 pairs), the overall pattern reveals no difference between the unimodal Voice alone condition and the Face+Voice condition or the Disk+Voice condition. The difference masks (Fig. 4 B) and the cross-spectral power (Fig. 4 C) also show no differences among these conditions. A significant ANOVA (F (3,1600) = 16.95; p = 7.70 × 10⁻¹¹) allowed for post hoc comparisons, which revealed that the Face+Voice, Disk+Voice, and Voice alone conditions were not significantly different from each other (p > 0.37), but all three were significantly different from the Face alone condition. Similarly, measures of the phase concentration revealed no significant differences across conditions for auditory–auditory interactions (Fig. 4 D) (F (3,1600) = 0.22; p = 0.8856). These data suggest that the interactions between the auditory cortex and the STS induced by the Face+Voice condition are specific and not caused by an attention- or arousal-induced response.
Figure 4.

Interactions within auditory cortex for the population of cortical sites. A, Population cross-spectrogram for all auditory–auditory cortical pairs for the four conditions. Conventions are as in Figure 2 B. B, Difference masks between the cross-spectra for the Face+Voice versus Voice condition and Face+Voice versus Disk+Voice conditions. Conventions are as in Figure 3 B. C, Population cross-spectra from 0 to 300 ms after voice onset. Shaded regions denote the SEM across all electrode pairs and calls. D, Population phase concentration. Conventions are as in Figure 3 E.
Multisensory integration in single auditory cortical neurons
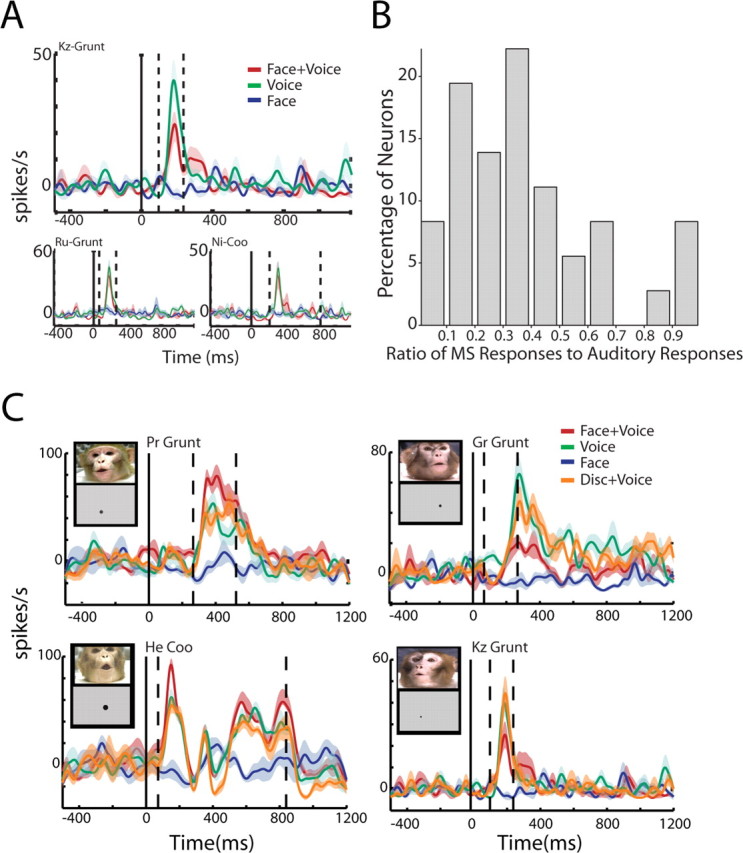
To test whether the auditory cortex and STS functional interactions could lead to changes in the output of spikes in auditory cortex, we isolated 78 single units from the lateral belt. Among those units, 36 (46%) responded to at least one of our eight vocalization stimuli. Surprisingly, 81% of these responsive units were multisensory. Figure 5 A shows three sets of spike density functions and rasters of single neuron responses in auditory cortex; all three neurons have responses that are significantly different from baseline as well as significant unimodal versus multisensory contrasts (as measured by an ANOVA). The neurons in the left and right top panels of Figure 5 A show enhanced multisensory responses to a grunt call and coo call, respectively, relative to the Voice alone condition. The neuron in the bottom left panel (Fig. 5 A) shows a suppressed multisensory response to a grunt call. Across the population of multisensory neurons, we calculated the mean number of enhanced responses and suppressed responses and whether these were responses to coos versus grunts. In contrast to LFP signals (Ghazanfar et al., 2005), there were no significant differences in the frequency of enhanced versus suppressed responses or coos versus grunt responses (two-way repeated-measures ANOVA, enhancement versus suppression, F (1,3) = 1.197, p = 0.354; coos vs grunts, F (1,3) = 1.421, p = 0.319).
Figure 5.

Single neurons integrate faces and voices at different response latencies. A, Examples of multisensory integration in auditory lateral belt neurons. Peristimulus time histograms and rasters to a grunt vocalization (top left panel), coo vocalization (top right panel), and another grunt (bottom left panel) to Face+Voice (F+V), Voice alone (V), and Face alone (F) conditions. x-axes show time aligned to onset of the face (solid line). Dashed lines indicate the onset and offset of the voice signal. y-axes depict the firing rate of the neuron in spikes per second. Shaded regions denote the SEM. The bottom half of each panel shows the spike raster for the three stimulus conditions. B, Auditory belt neurons show a distribution of peak response latencies to multisensory stimuli. Latencies are relative to the onset of the voice signal. Histogram shows the percentage of responses across all calls and neurons (y-axes) as a function of response latency (x-axes).
Note that the timing of visual influences on auditory responses follows wherever that auditory response might occur during the stimulus period. For example, the neuron in the left panel of Figure 5 A has an off-response, whereas the neuron in the middle panel has a response during the late part of the vocalization. This is unlike the consistent multisensory responses seen at ∼90 ms after auditory stimulus in the LFP signal (Ghazanfar et al., 2005). Furthermore, the exemplars suggest a continuum of response profiles reminiscent of those reported for neurons in the primary auditory cortex (A1) and caudomedial belt area (Recanzone, 2000). Figure 5 B shows the distribution of latencies for multisensory responses across these 36 neurons. The median latency was 184 ms from auditory onset. The wide distribution of latencies suggests that the visual influence on auditory cortical neurons is sustained for the duration of the stimuli and is not a simple summing of the onset responses. This sustained visual influence on auditory cortex is supported by the evidence for long-duration gamma band interactions with the STS described above.
Auditory versus multisensory single unit selectivity
In general, neurons were not selective for one of the two categories of vocalizations. For example, if a neuron responded to a coo call, it did not necessarily respond to the other three coo calls in the stimulus set, nor was it necessarily unresponsive to grunt calls. However, our data did reveal that, whereas a single neuron may respond to multiple coos and grunts in the auditory domain, multisensory effects did not occur in every instance of an auditory response. For example, the neuron in Figure 6 A responded in the auditory domain to three different calls: two grunts and a coo. However, a multisensory response (suppression, in this case) was only evident for one of the grunts (Fig. 6 A, top panel). To measure the influence that the dynamic face might have on the selectivity of auditory cortical neurons, we calculated, for a given neuron, the ratio for the number of calls (of the eight possible) that showed a significant multisensory response over the number of calls that were responsive in the Voice alone condition. A ratio of one would indicate that there was no change in selectivity. Any value less than that would indicate that adding the “face signal” increased the selectivity of the neuron. Figure 6 B shows the distribution of selectivity across our population of neurons. The mean ratio was 0.394, and the mean was significantly different from 1 (one-sample t test, t (35) = 13.2; p = 3.04 × 10⁻⁵).
Figure 6.
Visual signals modulate the selectivity of auditory neurons. A, Responses of a single auditory neuron to three different vocalizations. The top panel shows the peristimulus time histogram of the neuron to one of the grunt exemplars in the stimulus set. The Face+Voice response to this grunt is significantly suppressed relative to the Voice alone response. The bottom panels show the response of the same neuron to two other vocalizations, a different grunt and a coo. The auditory response is not significantly different from the multisensory response for these two calls. Figure conventions are the same as in Figure 5 A. B, Visual signals change the selectivity of auditory neurons. The histogram shows the ratio of number of multisensory responses of a neuron to the number of auditory responses from the same neuron. x-axes denotes the ratio of the number of multisensory responses to auditory responses (ranging from 0 to 1). y-axes denote the percentage of neurons. C, Examples of multisensory integration of Face+Voice stimuli compared with Disk+Voice stimuli in auditory neurons. The left panels show enhanced responses when voices are coupled with faces, but no similar modulation when coupled with disks. The right panels show similar effects for suppressed responses. The insets show frames from the Face+Voice stimulus and the temporally corresponding Disk+Voice stimulus. Conventions for the peristimulus time histogram follow Figure 5 A.
Single-neuron visual integration with voices is most robust with a face signal
It is possible that the enhancement and suppression at the single-unit level that we observed could be induced by any visual stimulus and a vocalization. To investigate this, we replaced the dynamic face with a dynamic disk, which mimicked the exact mouth movements of the face for each of the vocalizations. On average, the Disk+Voice condition did not elicit multisensory integration as frequently as the Face+Voice condition. Figure 6 C shows four single unit exemplars, where Face+Voice elicited enhanced responses (left panels) or suppressed responses (right panels) but that were not modulated similarly by the Disk+Voice condition. We calculated the proportion of calls that elicited in multisensory integration in the Face+Voice condition versus the Disk+Voice condition. Although the Disk+Voice condition did elicit integration in neurons, it was significantly less than the Face+Voice condition (0.394 ± 0.05 vs 0.283 ± 0.04; paired t test, t (35) = 5.57; p = 2.78 × 10−06). These data parallel the pattern of psychophysical results seen in humans performing speech-reading tasks under similar stimulus conditions (Bernstein et al., 2004; Schwartz et al., 2004).
Functional interactions between auditory spiking activity and STS oscillations
The influence of visual inputs, either enhancement or suppression, on the spikes of auditory cortical neurons is only apparent in the peaks of their phasic responses but can occur at very long latencies (Fig. 5 A,B). We examined whether there was any relationship between these single-neuron responses and oscillatory activity of the STS. To do so, we first identified all the auditory single-unit responses where the Face+Voice condition was significantly different than the Voice alone condition. We then computed the spike-triggered averages of the STS LFP signal around the time when the spiking response to the multisensory condition was different from the auditory condition. A spectrogram of this signal represents the spike-field cross-spectrum. Because there were no overt differences between enhanced versus suppressed auditory cortical responses in this measure (data not shown), we pooled them together. Figure 7 A shows the spike-field cross-spectra for an STS LFP signal and an auditory cortical neuron, whereas Figure 7 B shows the normalized spectral power for the region outlined by the black box across the three stimulus conditions. The 0 point (Fig. 7, black vertical line) indicates the time at which the multisensory spiking response was significantly different from the auditory condition. Gamma band power is most robust in the Face+Voice condition just before the auditory spiking activity. This pattern held true for the population (n = 57 pairs) of spike-field sites (Fig. 7 C). The difference mask reveals a sustained period of greater gamma band power in the multisensory condition versus both the Face alone and Voice alone conditions (Fig. 7 D). This is also evident in a plot of the normalized power (Fig. 7 E). The increase seen in the Face+Voice condition was significantly different from the unimodal conditions (F (2,500) = 9.44, p = 9.503 × 10⁻⁵; Face+Voice vs Voice alone, t (332) = 4.08, p = 0.00005; vs Face alone, t (332) = 3.07, p = 0.002).
Figure 7.

Relationship between the spiking activity of auditory cortical neurons and the STS local field potential. A, An example spike-field cross-spectrogram between an STS LFP signal and the firing of an auditory neuron for the three stimulus conditions for a single call type. x-axes depict time in milliseconds as a function of the onset of the multisensory response in the auditory neuron (solid black line). y-axes depict the frequency in hertz. The color bar denotes the cross-spectral power normalized by the baseline mean for different frequencies. B, Average cross-spectral power in the local field potential from 40–100 ms before the onset of the multisensory response shown outlined in A. x-axes depict frequency in hertz. y-axes depict the normalized cross-spectral power. C, Population cross-spectrogram for interactions between auditory cortical neurons and the STS LFP signal for three different stimulus conditions plotted as a function of time from the onset of integration. The color bar indicates the power normalized by the baseline mean for different frequency bands. D, Difference masks between the cross-spectra of the Face+Voice condition and the Voice condition and the Face+Voice and Face conditions. Conventions are as in Figure 3 B. E, Population cross-spectra for the three stimulus conditions for the period (outlined by the dotted boxes; 40–100 ms) before the onset of multisensory integration. x-axes depict frequency in hertz. y-axes depict the normalized amplitude of the oscillations in STS. F, Population phase concentration in the gamma band local field potential (by bandpass filtering from 55 to 95 Hz) for the three stimulus conditions. Error bars denote SEM.
We also investigated the phase concentration between auditory spiking and STS oscillations. Figure 7 F reveals that the Face+Voice condition elicits periods of STS local field potential activity phase-locked to the 0 point, which suggests that STS oscillatory activity could influence the firing properties of auditory cortical neurons. Indeed, the phase concentration in the gamma band (55–95 Hz) was greater during Face+Voice versus the unimodal conditions (Fig. 7 D) (F (2,500) = 4.02, p = 0.019; Face+Voice vs Voice alone, t (332) = 2.344, p = 0.019; vs Face alone: t (332) = 2.541, p = 0.012).
Discussion
To investigate the origin of one putative source for the dynamic face signal that could drive multisensory integration in the auditory cortex, we concurrently recorded LFPs and single neurons in the lateral belt of auditory cortex and the upper bank of the STS. The functional interactions, in the form of gamma band activity, between these two regions increased in strength during presentations of Face+Voice stimuli relative to the unimodal conditions (Voice alone or Face alone). Furthermore, these interactions were not solely modulations of response strength, because the phase relationships were significantly less variable (tighter) in the multisensory conditions (Varela et al., 2001). A control condition, in which the face was replaced with a dynamic disk that mimicked mouth movements, revealed that neural responses in general were significantly less robust when compared with the condition with the face. An analysis of functional interactions within the auditory cortex revealed no modulation of intracortical communication by Face+Voice stimuli versus the unimodal conditions. This suggests that the increase in the functional interactions between auditory cortex and the STS during multisensory inputs is not simply attributable to generalized changes in arousal or attention levels.
Our data also indicate that the functional interactions between auditory cortex and the STS may modulate the spiking output in auditory cortex. Visual influences on single neurons were most robust when in the form of dynamic faces and were only apparent when neurons had a significant response to a vocalization (i.e., there were no overt responses to faces alone). These integrative responses were often “face-specific” and had a wide distribution of latencies, which suggested that the face signal was an ongoing signal that modulated the auditory responses. This hypothesis for an ongoing signal is supported by the sustained gamma band activity between auditory cortex and STS and by our analysis of the relationship between auditory cortical spiking activity and gamma band oscillations from the STS. It should be noted, however, that functional interactions between STS and auditory cortex are not likely to occur solely during face/voice integration. Other congruent audiovisual events such as looming signals (Maier et al., 2004) (J. X. Maier and A. A. Ghazanfar, unpublished observations) or other temporally coincident signals may elicit similar functional interactions (Noesselt et al., 2007).
The STS as a source for the dynamic face signal in auditory cortex
Although multiple pathways could provide visual input into auditory cortex, including the intraparietal sulcus (Lewis and Van Essen, 2000), prefrontal cortex (Hackett et al., 1999; Romanski et al., 1999), and even primary and secondary visual cortex (Falchier et al., 2002; Rockland and Ojima, 2003), we, along with Calvert (2001), hypothesized that for face/voice integration, the relevant source of visual input is the STS (Ghazanfar et al., 2005). By showing sustained and increased gamma power and phase concentration between auditory cortex and STS signals during Face+Voice versus unimodal conditions, our data support the hypothesis that STS is at least one source of face signals in auditory cortex (Calvert et al., 1999; Ghazanfar et al., 2005).
Three other characteristics of the multisensory signals in lateral belt auditory cortex also support the “STS feedback” hypothesis. First, the influence of visual signals in general is biased toward the surrounding belt areas relative to the core region (which includes primary auditory cortex) (Ghazanfar et al., 2005; Lehmann et al., 2006; Kayser et al., 2007). Second, the degree of face specificity for multisensory integration was far greater in the lateral belt cortex than in the core region of auditory cortex (Ghazanfar et al., 2005), and this bias is paralleled in the pattern of connections from the STS to the superior temporal plane (Seltzer and Pandya, 1994). Finally, in humans, other lines of evidence suggest that dynamic faces have priority access to the auditory cortex (Campbell, 1992; Munhall et al., 2002; Calvert and Campbell, 2003). Patients with bilateral lesions to the superior temporal lobe have difficulties identifying dynamic speech expressions but no difficulties with static expressions (Campbell, 1992; Campbell et al., 1997; Munhall et al., 2002). Furthermore, dynamic visual speech elicits activations in auditory cortex and much larger portions of the left STS than still images of visual speech (Calvert and Campbell, 2003).
Single auditory cortical neurons integrate faces and voices
Our data reveal that ∼80% of vocally responsive neurons showed multisensory integration when dynamic faces were presented concurrently. This large percentage is surprising when compared with association areas but is consistent with recent single-unit studies in the anesthetized ferret (Bizley et al., 2007) and in the caudal belt areas of the monkey (Kayser et al., 2008). Recent single-unit studies of both STS and the ventrolateral prefrontal cortex (using similar vocalization stimuli, paradigms, and response criteria) found far fewer integrative neurons [23% in STS (Barraclough et al., 2005), 46% in prefrontal cortex (Sugihara et al., 2006)]. The exact reasons for this discrepancy between auditory cortex and these association areas are not known but certainly suggest that each of these nodes may be weighted differently depending on the task at hand. One hypothesis is that neurons in association areas compute veridical and highly specific events in the world independent of modality (von Kriegstein et al., 2005; von Kriegstein and Giraud, 2006), whereas multisensory influences on “lower-order” areas simply reinforce the primary sensory signal (Ghazanfar and Schroeder, 2006; Lakatos et al., 2007).
Gamma band activity and fast, flexible cortical communication
Beyond the routes specified by its anatomical connections, the brain needs a mechanism that allows fast and flexible communication within and between regions. One increasingly influential hypothesis states that such communication is mediated by the degree of phase-locking between oscillating neuronal groups (Fries, 2005). When two populations of neurons are phase locked with each other, they can communicate with each other, but when they are not, communication is ineffective. The ubiquity of gamma oscillations across many species and brain areas, as well as its timescale, suggest that it may be ideal for fast intracortical and intercortical communication (Buzsaki, 2006; Fries et al., 2007). Coherence in the gamma range has been attributed to feature binding in visual cortex (Gray et al., 1989), sensorimotor coordination in motor cortex (Murthy and Fetz, 1992), attention-dependent selection in extrastriate visual cortex (Fries et al., 2001), stimulus selectivity in auditory cortex (Brosch et al., 2002), and working memory in parietal cortex (Pesaran et al., 2002). There are comparatively fewer investigations of gamma band temporal coordination across multiple cortical areas: the middle temporal area (MT) and the lateral intraparietal (LIP) area, as well as LIP and prefrontal cortex, synchronize during selective attention (Buschman and Miller, 2007; Saalmann et al., 2007) and cat areas 18 and 21a during visual stimulation (Salazar et al., 2004; Womelsdorf et al., 2007)
Multisensory integration requires the convergence of information from distinct neuronal populations, and the interactions between these neuronal populations must be fast and flexible, so that signals belonging to the same object or event can be immediately integrated while preventing integration of signals that are unrelated. The gamma band temporal coordination between auditory cortex and the STS that increases in both power and phase concentration during multisensory processing is ideally suited for such integration and is a fast and efficient way of dealing with the continuous stream of multisensory input from the environment. In the single-unit data, the phasic auditory response to the vocalization is delayed relative to the initial STS response to the dynamic faces. Because the visual influence on auditory cortical neurons is only apparent during this phasic response, it suggests that the visual influence from the STS is ongoing and modulatory; it cannot by itself drive auditory neurons to spike. The self-sustaining nature of gamma oscillations and/or the continuous nature of the dynamic face likely contribute to this ongoing visual modulation. With regard to the former, if the auditory cortex and the STS are considered two networks oscillating in the gamma frequency, then a volley of spikes from an excitatory input from one network onto the inhibitory interneurons of the other could cause both networks to synchronize (Traub et al., 1996). This synchrony can be maintained for several gamma cycles without any further synchronizing events. Therefore, in the present case, the phasic excitatory response to the initial face signal could, in theory, cause auditory cortical oscillations to synchronize with STS oscillations. Of course, our current knowledge does not preclude the possibility that a third structure, like the prefrontal cortex, which has connections with both auditory cortex and the STS (Romanski, 2003), could entrain both simultaneously.
Once synchronized oscillations between the auditory cortex and the STS is established by a visual signal, the timing of a subsequent auditory input could determine whether the integrative response is enhanced or suppressed. Because we used natural vocalizations, the timing between visual onset and the voice onset was highly variable across stimulus exemplars (Fig. 1), and thus we could not test this hypothesis. However, recent work on the oscillatory properties of primary auditory cortex revealed that somatosensory inputs reset the phase of ongoing auditory cortical oscillations (Lakatos et al., 2007). When a subsequent auditory signal is timed to fall on the peak of the oscillatory cycle, then an enhanced response is observed, although if it falls in a trough, suppression is the outcome (Lakatos et al., 2007). In our experiments, the dynamic facial expression has many possible events that could reset the phase multiple times during an expression (mouth/eye movements), and during free viewing of vocalizing conspecifics (Ghazanfar and Chandrasekaran, 2007), monkeys will saccade back and forth between the eyes and the mouth (Ghazanfar et al., 2006), again possibly resetting the phase of ongoing auditory cortical oscillations multiple times. It is an open and interesting question whether the integration of highly complex signals like faces and voices operates using this phase-resetting principle.
Footnotes
This work was supported by the Max Planck Society (A.A.G., N.K.L.), National Institutes of Health Grant R01NS054898 (A.A.G.), National Science Foundation BCS-0547760 Career Award (A.A.G.), and the Autism Speaks Foundation (A.A.G.). We gratefully acknowledge Joost Maier for help with data collection, generating the “disk” stimuli, and critical comments. We also thank Christoph Kayser for analytical insights, Kristina Nielsen for sharing Matlab scripts, Daeyeol Lee for sharing Matlab code for spectral analysis, and Ehren Newman for advice on the use of statistics in Wavelet analysis.
References
- Barbour DL, Wang XQ. Contrast tuning in auditory cortex. Science. 2003;299:1073–1075. doi: 10.1126/science.1080425. [DOI] [PMC free article] [PubMed] [Google Scholar]
- Barraclough NE, Xiao DK, Baker CI, Oram MW, Perrett DI. Integration of visual and auditory information by superior temporal sulcus neurons responsive to the sight of actions. J Cogn Neurosci. 2005;17:377–391. doi: 10.1162/0898929053279586. [DOI] [PubMed] [Google Scholar]
- Bernstein LE, Auer ET, Takayanagi S. Auditory speech detection in noise enhanced by lipreading. Speech Commun. 2004;44:5–18. [Google Scholar]
- Besle J, Fort A, Delpuech C, Giard MH. Bimodal speech: early suppressive visual effects in human auditory cortex. Eur J Neurosci. 2004;20:2225–2234. doi: 10.1111/j.1460-9568.2004.03670.x. [DOI] [PMC free article] [PubMed] [Google Scholar]
- Bizley JK, Nodal FR, Bajo VM, Nelken I, King AJ. Physiological and anatomical evidence for multisensory interactions in auditory cortex. Cereb Cortex. 2007;17:2172–2189. doi: 10.1093/cercor/bhl128. [DOI] [PMC free article] [PubMed] [Google Scholar]
- Brosch M, Budinger E, Scheich H. Stimulus-related gamma oscillations in primate auditory cortex. J Neurophysiol. 2002;87:2715–2725. doi: 10.1152/jn.2002.87.6.2715. [DOI] [PubMed] [Google Scholar]
- Bruce C, Desimone R, Gross CG. Visual properties of neurons in a polysensory area in superior temporal sulcus of the macaque. J Neurophysiol. 1981;46:369–384. doi: 10.1152/jn.1981.46.2.369. [DOI] [PubMed] [Google Scholar]
- Buschman TJ, Miller EK. Top-down versus bottom-up control of attention in the prefrontal and posterior parietal cortices. Science. 2007;315:1860–1862. doi: 10.1126/science.1138071. [DOI] [PubMed] [Google Scholar]
- Buzsaki G. New York: Oxford UP; 2006. Rhythms of the brain. [Google Scholar]
- Callan DE, Callan AM, Kroos C, Vatikiotis-Bateson E. Multimodal contribution to speech perception revealed by independent component analysis: a single-sweep EEG case study. Cogn Brain Res. 2001;10:349–353. doi: 10.1016/s0926-6410(00)00054-9. [DOI] [PubMed] [Google Scholar]
- Calvert GA. Crossmodal processing in the human brain: insights from functional neuroimaging studies. Cereb Cortex. 2001;11:1110–1123. doi: 10.1093/cercor/11.12.1110. [DOI] [PubMed] [Google Scholar]
- Calvert GA, Campbell R. Reading speech from still and moving faces: the neural substrates of visible speech. J Cogn Neurosci. 2003;15:57–70. doi: 10.1162/089892903321107828. [DOI] [PubMed] [Google Scholar]
- Calvert GA, Bullmore ET, Brammer MJ, Campbell R, Williams SCR, McGuire PK, Woodruff PWR, Iverson SD, David AS. Activation of auditory cortex during silent lipreading. Science. 1997;276:593–596. doi: 10.1126/science.276.5312.593. [DOI] [PubMed] [Google Scholar]
- Calvert GA, Brammer MJ, Iversen SD. Crossmodal identification. Trends Cogn Sci. 1998;2:247–253. doi: 10.1016/S1364-6613(98)01189-9. [DOI] [PubMed] [Google Scholar]
- Calvert GA, Brammer MJ, Bullmore ET, Campbell R, Iversen SD, David AS. Response amplification in sensory-specific cortices during crossmodal binding. NeuroReport. 1999;10:2619–2623. doi: 10.1097/00001756-199908200-00033. [DOI] [PubMed] [Google Scholar]
- Campanella S, Belin P. Integrating face and voice in person perception. Trends Cogn Sci. 2007;11:535–543. doi: 10.1016/j.tics.2007.10.001. [DOI] [PubMed] [Google Scholar]
- Campbell R. The neuropsychology of lipreading. Philos Trans R Soc Lond B Biol Sci. 1992;335:39–45. doi: 10.1098/rstb.1992.0005. [DOI] [PubMed] [Google Scholar]
- Campbell R, Zihl J, Massaro DW, Munhall K, Cohen MM. Speechreading in the akinetopsic patient, L.M. Brain. 1997;120:1793–1803. doi: 10.1093/brain/120.10.1793. [DOI] [PubMed] [Google Scholar]
- Cheney DL, Seyfarth RM. Baboon metaphysics: the evolution of a social mind. Chicago: University of Chicago; 2007. [Google Scholar]
- Driver J, Noesselt T. Multisensory interplay reveals crossmodal influences on “sensory-specific” brain regions, neural responses, and judgments. Neuron. 2008;57:11–23. doi: 10.1016/j.neuron.2007.12.013. [DOI] [PMC free article] [PubMed] [Google Scholar]
- Falchier A, Clavagnier S, Barone P, Kennedy H. Anatomical evidence of multimodal integration in primate striate cortex. J Neurosci. 2002;22:5749–5759. doi: 10.1523/JNEUROSCI.22-13-05749.2002. [DOI] [PMC free article] [PubMed] [Google Scholar]
- Fries P. A mechanism for cognitive dynamics: neuronal communication through neuronal coherence. Trends Cogn Sci. 2005;9:474–480. doi: 10.1016/j.tics.2005.08.011. [DOI] [PubMed] [Google Scholar]
- Fries P, Reynolds JH, Rorie AE, Desimone R. Modulation of oscillatory neuronal synchronization by selective visual attention. Science. 2001;291:1560–1563. doi: 10.1126/science.1055465. [DOI] [PubMed] [Google Scholar]
- Fries P, Nikolic D, Singer W. The gamma cycle. Trends Neurosci. 2007;30:309–316. doi: 10.1016/j.tins.2007.05.005. [DOI] [PubMed] [Google Scholar]
- Ghazanfar AA, Chandrasekaran CF. Paving the way forward: integrating the senses through phase-resetting of cortical oscillations. Neuron. 2007;53:162–164. doi: 10.1016/j.neuron.2007.01.003. [DOI] [PubMed] [Google Scholar]
- Ghazanfar AA, Logothetis NK. Facial expressions linked to monkey calls. Nature. 2003;423:937–938. doi: 10.1038/423937a. [DOI] [PubMed] [Google Scholar]
- Ghazanfar AA, Schroeder CE. Is neocortex essentially multisensory? Trends Cogn Sci. 2006;10:278–285. doi: 10.1016/j.tics.2006.04.008. [DOI] [PubMed] [Google Scholar]
- Ghazanfar AA, Maier JX, Hoffman KL, Logothetis NK. Multisensory integration of dynamic faces and voices in rhesus monkey auditory cortex. J Neurosci. 2005;25:5004–5012. doi: 10.1523/JNEUROSCI.0799-05.2005. [DOI] [PMC free article] [PubMed] [Google Scholar]
- Ghazanfar AA, Nielsen K, Logothetis NK. Eye movements of monkeys viewing vocalizing conspecifics. Cognition. 2006;101:515–529. doi: 10.1016/j.cognition.2005.12.007. [DOI] [PubMed] [Google Scholar]
- Ghazanfar AA, Turesson HK, Maier JX, van Dinther R, Patterson RD, Logothetis NK. Vocal tract resonances as indexical cues in rhesus monkeys. Curr Biol. 2007;17:425–430. doi: 10.1016/j.cub.2007.01.029. [DOI] [PMC free article] [PubMed] [Google Scholar]
- Gray CM, Konig P, Engel AK, Singer W. Oscillatory responses in cat visual-cortex exhibit inter-columnar synchronization which reflects global stimulus properties. Nature. 1989;338:334–337. doi: 10.1038/338334a0. [DOI] [PubMed] [Google Scholar]
- Guthrie D, Buchwald JS. Significance testing of difference potentials. Psychophysiology. 1991;28:240–244. doi: 10.1111/j.1469-8986.1991.tb00417.x. [DOI] [PubMed] [Google Scholar]
- Hackett TA, Stepniewska I, Kaas JH. Subdivisions of auditory cortex and ipsilateral cortical connections of the parabelt auditory cortex in macaque monkeys. J Comp Neurol. 1998;394:475–495. doi: 10.1002/(sici)1096-9861(19980518)394:4<475::aid-cne6>3.0.co;2-z. [DOI] [PubMed] [Google Scholar]
- Hackett TA, Stepniewska I, Kaas JH. Prefrontal connections of the parabelt auditory cortex in macaque monkeys. Brain Res. 1999;817:45–58. doi: 10.1016/s0006-8993(98)01182-2. [DOI] [PubMed] [Google Scholar]
- Harries MH, Perrett DI. Visual processing of faces in temporal cortex-physiological evidence for a modular organization and possible anatomical correlates. J Cogn Neurosci. 1991;3:9–24. doi: 10.1162/jocn.1991.3.1.9. [DOI] [PubMed] [Google Scholar]
- Hoffman KL, Gothard KM, Schmid MC, Logothetis NK. Facial-expression and gaze-selective responses in the monkey amygdala. Curr Biol. 2007;17:766–772. doi: 10.1016/j.cub.2007.03.040. [DOI] [PubMed] [Google Scholar]
- Jarvis MR, Mitra PP. Sampling properties of the spectrum and coherency of sequences of action potentials. Neural Comput. 2001;13:717–749. doi: 10.1162/089976601300014312. [DOI] [PubMed] [Google Scholar]
- Jordan KE, Brannon EM, Logothetis NK, Ghazanfar AA. Monkeys match the number of voices they hear with the number of faces they see. Curr Biol. 2005;15:1034–1038. doi: 10.1016/j.cub.2005.04.056. [DOI] [PubMed] [Google Scholar]
- Kayser C, Petkov CI, Augath M, Logothetis NK. Functional imaging reveals visual modulation of specific fields in auditory cortex. J Neurosci. 2007;27:1824–1835. doi: 10.1523/JNEUROSCI.4737-06.2007. [DOI] [PMC free article] [PubMed] [Google Scholar]
- Kayser C, Petkov CI, Logothetis NK. Visual modulation of neurons in auditory cortex. Cereb Cortex. 2008 doi: 10.1093/cercor/bhm187. in press. [DOI] [PubMed] [Google Scholar]
- Lachaux JP, Rodriguez E, Martinerie J, Varela FJ. Measuring phase synchrony in brain signals. Hum Brain Mapp. 1999;8:194–208. doi: 10.1002/(SICI)1097-0193(1999)8:4<194::AID-HBM4>3.0.CO;2-C. [DOI] [PMC free article] [PubMed] [Google Scholar]
- Lakatos P, Chen C-M, O'Connell MN, Mills A, Schroeder CE. Neuronal oscillations and multisensory interaction in primary auditory cortex. Neuron. 2007;53:279–292. doi: 10.1016/j.neuron.2006.12.011. [DOI] [PMC free article] [PubMed] [Google Scholar]
- Lee D. Analysis of phase-locked oscillations in multi-channel single-unit spike activity with wavelet cross-spectrum. J Neurosci Methods. 2002;115:67–75. doi: 10.1016/s0165-0270(02)00002-x. [DOI] [PubMed] [Google Scholar]
- Lehmann C, Herdener M, Esposito F, Hubl D, di Salle F, Scheffler K, Bach DR, Federspiel A, Kretz R, Dierks T, Seifritz E. Differential patterns of multisensory interactions in core and belt areas of human auditory cortex. NeuroImage. 2006;31:294–300. doi: 10.1016/j.neuroimage.2005.12.038. [DOI] [PubMed] [Google Scholar]
- Lewis JW, Van Essen DC. Corticocortical connections of visual, sensorimotor, and multimodal processing areas in the parietal lobe of the macaque monkey. J Comp Neurol. 2000;428:112–137. doi: 10.1002/1096-9861(20001204)428:1<112::aid-cne8>3.0.co;2-9. [DOI] [PubMed] [Google Scholar]
- Logothetis NK. The neural basis of the blood-oxygen-level-dependent functional magnetic resonance imaging signal. Philos Trans R Soc Lond B Biol Sci. 2002;357:1003–1037. doi: 10.1098/rstb.2002.1114. [DOI] [PMC free article] [PubMed] [Google Scholar]
- Logothetis NK, Merkle H, Augath M, Trinath T, Ugurbil K. Ultra high-resolution fMRI in monkeys with implanted RF coils. Neuron. 2002;35:227–242. doi: 10.1016/s0896-6273(02)00775-4. [DOI] [PubMed] [Google Scholar]
- Maier JX, Neuhoff JG, Logothetis NK, Ghazanfar AA. Multisensory integration of looming signals by rhesus monkeys. Neuron. 2004;43:177–181. doi: 10.1016/j.neuron.2004.06.027. [DOI] [PubMed] [Google Scholar]
- Mallat SG. Ed 2. San Diego: Academic; 1999. A wavelet tour of signal processing. [Google Scholar]
- Munhall KG, Servos P, Santi A, Goodale MA. Dynamic visual speech perception in a patient with visual form agnosia. NeuroReport. 2002;13:1793–1796. doi: 10.1097/00001756-200210070-00020. [DOI] [PubMed] [Google Scholar]
- Murray MM, Michel CM, de Peralta RG, Ortigue S, Brunet D, Andino SG, Schnider A. Rapid discrimination of visual and multisensory memories revealed by electrical neuroimaging. NeuroImage. 2004;21:125–135. doi: 10.1016/j.neuroimage.2003.09.035. [DOI] [PubMed] [Google Scholar]
- Murthy VN, Fetz EE. Coherent 25-Hz to 35-Hz oscillations in the sensorimotor cortex of awake behaving monkeys. Proc Natl Acad Sci USA. 1992;89:5670–5674. doi: 10.1073/pnas.89.12.5670. [DOI] [PMC free article] [PubMed] [Google Scholar]
- Noesselt T, Rieger JW, Schoenfeld MA, Kanowski M, Hinrichs H, Heinze H-J, Driver J. Audiovisual temporal correspondence modulates human multisensory superior temporal sulcus plus primary sensory cortices. J Neurosci. 2007;27:11431–11441. doi: 10.1523/JNEUROSCI.2252-07.2007. [DOI] [PMC free article] [PubMed] [Google Scholar]
- Oram MW, Perrett DI. Responses of anterior superior temporal polysensory (STPa) neurons to biological motion stimuli. J Cogn Neurosci. 1994;6:99–116. doi: 10.1162/jocn.1994.6.2.99. [DOI] [PubMed] [Google Scholar]
- Parr LA. Perceptual biases for multimodal cues in chimpanzee (Pan troglodytes) affect recognition. Animal Cogn. 2004;7:171–178. doi: 10.1007/s10071-004-0207-1. [DOI] [PubMed] [Google Scholar]
- Pesaran B, Pezaris JS, Sahani M, Mitra PP, Andersen RA. Temporal structure in neuronal activity during working memory in macaque parietal cortex. Nat Neurosci. 2002;5:805–811. doi: 10.1038/nn890. [DOI] [PubMed] [Google Scholar]
- Pfingst BE, O'Connor TA. Vertical stereotaxic approach to auditory-cortex in the unanesthetized monkey. J Neurosci Methods. 1980;2:33–45. doi: 10.1016/0165-0270(80)90043-6. [DOI] [PubMed] [Google Scholar]
- Puce A, Perrett DI. Electrophysiology and brain imaging of biological motion. Philos Trans R Soc Lond B Biol Sci. 2003;358:435–445. doi: 10.1098/rstb.2002.1221. [DOI] [PMC free article] [PubMed] [Google Scholar]
- Puce A, Epling JA, Thompson JC, Carrick OK. Neural responses elicited to face motion and vocalization pairings. Neuropsychologia. 2007;45:93–106. doi: 10.1016/j.neuropsychologia.2006.04.017. [DOI] [PMC free article] [PubMed] [Google Scholar]
- Rauschecker JP, Tian B, Hauser M. Processing of complex sounds in the macaque nonprimary auditory-cortex. Science. 1995;268:111–114. doi: 10.1126/science.7701330. [DOI] [PubMed] [Google Scholar]
- Reale RA, Calvert GA, Thesen T, Jenison RL, Kawasaki H, Oya H, Howard MA, Brugge JF. Auditory-visual processing represented in the human superior temporal gyrus. Neuroscience. 2007;145:162–184. doi: 10.1016/j.neuroscience.2006.11.036. [DOI] [PubMed] [Google Scholar]
- Recanzone GH. Response profiles of auditory cortical neurons to tones and noise in behaving macaque monkeys. Hearing Res. 2000;150:104–118. doi: 10.1016/s0378-5955(00)00194-5. [DOI] [PubMed] [Google Scholar]
- Recanzone GH, Guard DC, Phan ML. Frequency and intensity response properties of single neurons in the auditory cortex of the behaving macaque monkey. J Neurophysiol. 2000;83:2315–2331. doi: 10.1152/jn.2000.83.4.2315. [DOI] [PubMed] [Google Scholar]
- Richmond BJ, Optican LM, Spitzer H. Temporal encoding of two-dimensional patterns by single units in primate primary visual cortex. I. Stimulus response relations. J Neurophysiol. 1990;64:351–369. doi: 10.1152/jn.1990.64.2.351. [DOI] [PubMed] [Google Scholar]
- Rockland KS, Ojima H. Multisensory convergence in calcarine visual areas in macaque monkey. Int J Psychophysiol. 2003;50:19–26. doi: 10.1016/s0167-8760(03)00121-1. [DOI] [PubMed] [Google Scholar]
- Romanski LM. Anatomy and physiology of auditory-prefrontal interactions in non-human primates. In: Ghazanfar AA, editor. Primate audition: ethology and neurobiology. Boca Raton, FL: CRC; 2003. pp. 259–278. [Google Scholar]
- Romanski LM, Bates JF, Goldman-Rakic PS. Auditory belt and parabelt projections to the prefrontal cortex in the rhesus monkey. J Comp Neurol. 1999;403:141–157. doi: 10.1002/(sici)1096-9861(19990111)403:2<141::aid-cne1>3.0.co;2-v. [DOI] [PubMed] [Google Scholar]
- Saalmann YB, Pigarev IN, Vidyasagar TR. Neural mechanisms of visual attention: how top-down feedback highlights relevant locations. Science. 2007;316:1612–1615. doi: 10.1126/science.1139140. [DOI] [PubMed] [Google Scholar]
- Salazar RF, Konig P, Kayser C. Directed interactions between visual areas and their role in processing image structure and expectancy. Eur J Neurosci. 2004;20:1391–1401. doi: 10.1111/j.1460-9568.2004.03579.x. [DOI] [PubMed] [Google Scholar]
- Sams M, Aulanko R, Hamalainen M, Hari R, Lounasmaa OV, Lu ST, Simola J. Seeing speech-visual information from lip movements modifies activity in the human auditory-cortex. Neurosci Lett. 1991;127:141–145. doi: 10.1016/0304-3940(91)90914-f. [DOI] [PubMed] [Google Scholar]
- Schroeder CE, Foxe J. Multisensory contributions to low-level, “unisensory” processing. Curr Opin Neurobiol. 2005;15:454–458. doi: 10.1016/j.conb.2005.06.008. [DOI] [PubMed] [Google Scholar]
- Schwartz J-L, Berthommier F, Savariaux C. Seeing to hear better: evidence for early audio-visual interactions in speech identification. Cognition. 2004;93:B69–B78. doi: 10.1016/j.cognition.2004.01.006. [DOI] [PubMed] [Google Scholar]
- Seltzer B, Pandya DN. Parietal, temporal, and occipital projections to cortex of the superior temporal sulcus in the rhesus monkey: a retrograde tracer study. J Comp Neurol. 1994;343:445–463. doi: 10.1002/cne.903430308. [DOI] [PubMed] [Google Scholar]
- Sugihara T, Diltz M, Averbeck BB, Romanski LM. Integration of auditory and visual communication information in the primate ventrolateral prefrontal cortex. J Neurosci. 2006;26:11138–11147. doi: 10.1523/JNEUROSCI.3550-06.2006. [DOI] [PMC free article] [PubMed] [Google Scholar]
- Szucs A. Applications of spike density function in analysis of neuronal firing patterns. J Neurosci Methods. 1998;81:159–167. doi: 10.1016/s0165-0270(98)00033-8. [DOI] [PubMed] [Google Scholar]
- Tallon-Baudry C, Mandon S, Freiwald WA, Kreiter AK. Oscillatory synchrony in the monkey temporal lobe correlates with performance in a visual short-term memory task. Cereb Cortex. 2004;14:713–720. doi: 10.1093/cercor/bhh031. [DOI] [PubMed] [Google Scholar]
- Traub RD, Whittington MA, Stanford IM, Jefferys JGR. A mechanism for generation of long-range synchronous fast oscillations in the cortex. Nature. 1996;383:621–624. doi: 10.1038/383621a0. [DOI] [PubMed] [Google Scholar]
- van Wassenhove V, Grant KW, Poeppel D. Visual speech speeds up the neural processing of auditory speech. Proc Natl Acad Sci USA. 2005;102:1181–1186. doi: 10.1073/pnas.0408949102. [DOI] [PMC free article] [PubMed] [Google Scholar]
- Varela F, Lachaux J-P, Rodriguez E, Martinerie J. The brainweb: phase synchronization and large-scale integration. Nat Rev Neurosci. 2001;2:229–239. doi: 10.1038/35067550. [DOI] [PubMed] [Google Scholar]
- von Kriegstein K, Giraud AL. Implicit multisensory associations influence voice recognition. PLoS Biol. 2006;4:1809–1820. doi: 10.1371/journal.pbio.0040326. [DOI] [PMC free article] [PubMed] [Google Scholar]
- von Kriegstein K, Kleinschmidt A, Sterzer P, Giraud AL. Interaction of face and voice areas during speaker recognition. J Cogn Neurosci. 2005;17:367–376. doi: 10.1162/0898929053279577. [DOI] [PubMed] [Google Scholar]
- Womelsdorf T, Schoffelen JM, Oostenveld R, Singer W, Desimone R, Engel AK, Fries P. Modulation of neuronal interactions through neuronal synchronization. Science. 2007;316:1609–1612. doi: 10.1126/science.1139597. [DOI] [PubMed] [Google Scholar]
- Zhan Y, Halliday D, Jiang P, Liu X, Feng J. Detecting time-dependent coherence between non-stationary electrophysiological signals–a combined statistical and time-frequency approach. J Neurosci Methods. 2006;156:322–332. doi: 10.1016/j.jneumeth.2006.02.013. [DOI] [PubMed] [Google Scholar]