SYNOPSIS
Transmission of infectious diseases became an immediate public health concern when approximately 27,000 New Orleans-area residents evacuated to Houston's Astrodome and Reliant Park Complex following Hurricane Katrina. This article presents a surveillance system that was rapidly developed and implemented for daily tracking of various symptoms in the evacuee population in the Astrodome “megashelter.” This system successfully confirmed an outbreak of acute gastroenteritis and became a critical tool in monitoring the course of this outbreak.
On August 29, 2005, Hurricane Katrina struck the Gulf Coast. As a result of destruction and flooding, residents of the New Orleans, Louisiana, area were evacuated.1–3 Between September 1 and September 3, 2005, approximately 27,000 evacuees arrived at a megashelter created in Houston's Astrodome and Reliant Park Complex.4 Transmission of communicable infectious diseases became an immediate public health concern. This article describes the surveillance system developed for tracking symptoms in the evacuee population as a means of identifying potential disease outbreaks.
METHODS
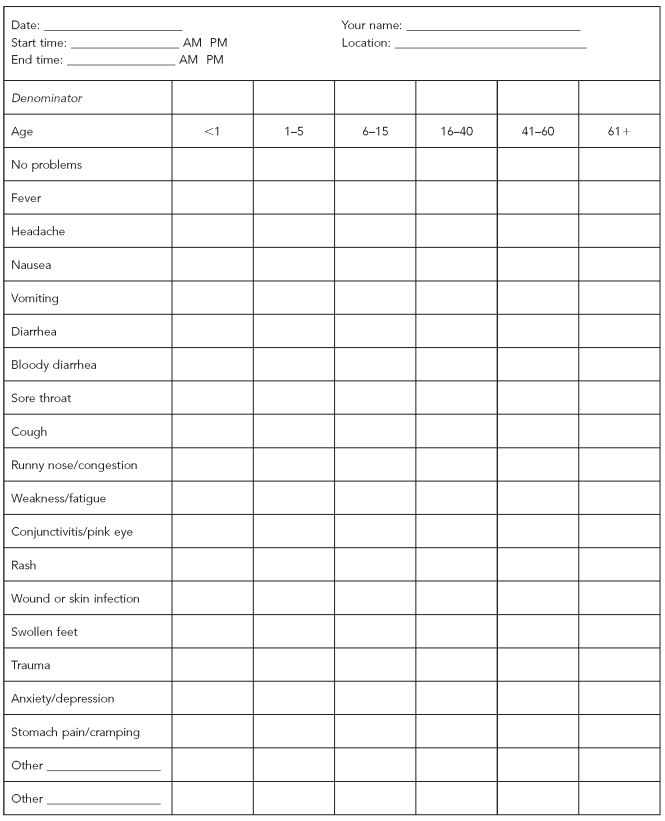
We developed a rapid health assessment tool (Figure 1) to conduct daily assessments of evacuees' health. We initiated the rapid assessments, also known as the “cot surveys,” on September 3 at the megashelter. Volunteers were trained each evening prior to conducting the survey. This training included use of the survey form and methods for referring evacuees to public health, medical, dental, and mental health services. This survey was approved by the Committee for the Protection of Human Subjects at the University of Texas Health Science Center at Houston (HSC-SPH-05-0501).
Figure 1.
The cot survey form used to evaluate Hurricane Katrina evacuees housed in the Astrodome and Reliant Park megashelter in Houston, Texas
The survey began each evening at about 6 p.m., and all evacuees present in the shelter at the time of the survey were interviewed. In total, the surveys took two to three hours per evening to complete. Evacuees were approached and asked their age and if they were experiencing any illness or problems. If ill, the reported symptom(s) were noted with a tick mark on the assessment form in the corresponding row under the appropriate age category column.
Because we felt children, particularly those younger than age 5, and older evacuees were at greater risk for susceptibility to infectious diseases, we divided age into six categories: <1 year, 1–5 years, 6–15 years, 16–40 years, 41–60 years, and ≥61 years. For children younger than 18 years of age, we would only interview them if a parent or guardian were present. If the person reported no symptoms or illness, then a tick mark was made in the “no problems” row. A tick was also marked in the row for denominator, so at the end of the evening, the total number of people interviewed could be determined.
No identifying information was collected. Refusals were rare; if an evacuee refused to answer the question and be part of the survey, then the interviewer was instructed to allow the refusal and continue the survey with the next evacuee. The interviews were completed each night by teams of about 30 volunteers, with more than 300 volunteers contributing overall. Starting on September 6, volunteers counted the number of occupied cots each night to estimate the total number of evacuees using the shelter.
We used the one-page form to cover each row or specified area of cots so that potential health problems could be identified by section within the shelter. Cot areas and rows were established and identified using a letter scheme by the Red Cross, which instituted the shelter. The number of cots in these predesignated areas varied greatly, but had a mean of 100 cots.
Initially, paper forms were used to conduct the surveys. Each evening after the survey was completed, data were first hand-tabulated by the interviewer, then validated by a second volunteer to ensure data quality. Data entry was also double-checked as a means of quality assurance. We analyzed the data nightly to monitor for disease trends. We compiled a daily report that was then e-mailed to health authorities, and the information was presented the following morning during briefings in the incident command center. On the 10th day, a transition was made to handheld personal digital assistants (PDAs), which were programmed with the data collection form using a program written in XML. To ensure data integrity from the PDAs, downloads were reviewed for completeness before analysis. At the end of each evening, we imported the data from each PDA to a Microsoft® Excel® 2003 spreadsheet for analysis and reporting.
Surveillance continued for 17 consecutive nights (September 3–19, 2005) until the shelter was closed for evacuation for Hurricane Rita, which was approaching the Houston area.
RESULTS
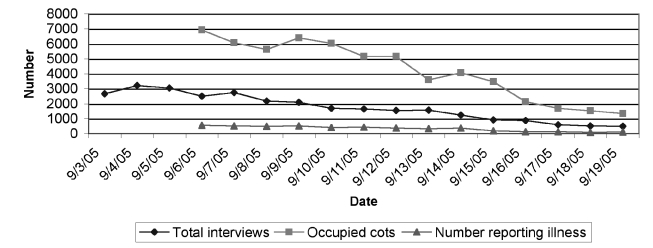
A total of 29,478 evacuee interviews were conducted during the 17 days of surveillance (mean = 1,734 interviews per night; range = 3,203 on September 4 to 487 on September 19) (Figure 2). During the course of the surveillance period, 3.0% of the interviewees were <1 year of age, 11.0% were aged 1–5 years, 23.0% were aged 5–15 years, 32.0% were aged 16–40 years, 23.0% were aged 41–60 years, and 8.0% were ≥61 years of age. A mean of 35.0% of the shelter population was interviewed during the nightly surveys.
Figure 2.
Total number of evacuee interviews and those reporting symptoms in relation to the total number of occupied cots at the Astrodome and Reliant Park megashelter for Hurricane Katrina evacuees
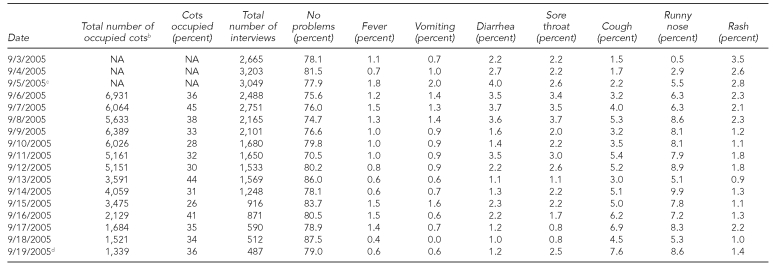
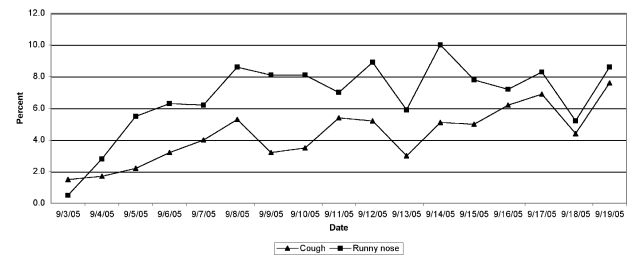
Fever, vomiting, diarrhea, sore throat, cough, runny nose, and rash emerged as the symptoms of primary concern (Table). Cough and runny nose were the most frequently reported symptoms, with increases in both symptoms reported over time (Figure 3). The highest percentage of evacuees reporting cough was 7.6%, noted on September 19. Reports of runny nose peaked at 9.9% on September 14 and were most commonly reported in children ≤5 years of age.
Table.
Prevalence of seven major symptoms and “no problems” from nightly monitoring of Hurricane Katrina evacuees in the Astrodome and Reliant Park megashelter, Houston, Texasa
aPercentage is based on the total number of interviews conducted each night.
bData not collected until September 6
cIncrease in vomiting and diarrhea noted; isolation ward established; norovirus first isolated
dOn the final night the shelter was in operation, evacuees were then evacuated in anticipation of the arrival of Hurricane Rita.
NA = not available
Figure 3.
Symptom monitoring during shelter operations in the Astrodome and Reliant Park megashelter for Hurricane Katrina evacuees: prevalence of cough and runny nose
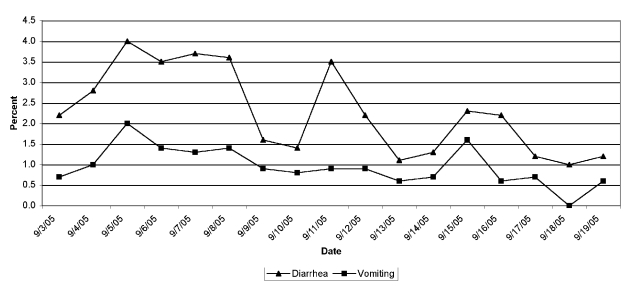
Reports of diarrhea increased and peaked on September 5 (4.0%), followed by a secondary peak on September 11 (3.5%), and a tertiary peak on September 15 (2.3%) (Figure 4). Based upon surveillance using the rapid health assessment tool, reports of vomiting also peaked on September 5 (2.0%), followed by a decline, then a secondary peak on September 15 (1.6%), corresponding to increased reports of diarrhea on the same dates. Clinical and laboratory findings determined this gastroenteritis outbreak was attributed to norovirus,4,5 with the epidemic curves being characteristic of person-to-person transmission. At the peak of the outbreak, infants <1 year of age and children aged 1–5 years had the highest reports of vomiting (4.3% and 3.2%, respectively) and diarrhea (6.5% and 4.5%, respectively). During the outbreak, we were able to identify specific cot areas that had higher percentages of diarrhea and vomiting. These areas were sanitized and monitored closely, and ill evacuees were moved to the isolation area.
Figure 4.
Symptom monitoring during shelter operations in the Astrodome and Reliant Park megashelter for Hurricane Katrina evacuees: prevalence of diarrhea and vomiting
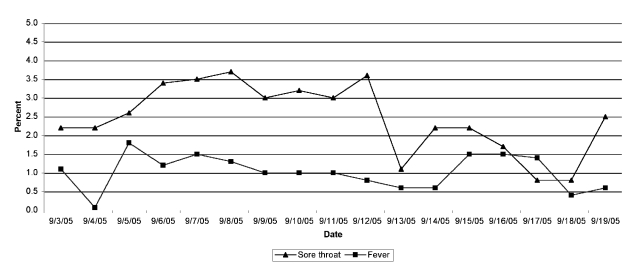
The percentage of evacuees reporting fever ranged from 0.4% on September 18 to nearly 1.8% on September 5, with a mean of 1.1%. The September 5 peak corresponded to similar peaks seen in reported vomiting and diarrhea. Reports of sore throat peaked between September 6 and 8 (3.4% to 3.7%), and then declined to a low of 0.8% on September 18 (Figure 5). Reports of rash were common during the initial days of the shelter; clinic personnel suspected that these rashes were associated with floodwater exposure. The highest percentage (3.5%) of rash was reported on the first day of the survey.
Figure 5.
Symptom monitoring during shelter operations in the Astrodome and Reliant Park megashelter for Hurricane Katrina evacuees: prevalence of sore throat and fever
DISCUSSION
The cot survey quickly became of immense value to public health authorities. An increase in reported vomiting and diarrhea among evacuees being evaluated in the clinics gave an immediate warning to the beginning of a gastroenteritis outbreak.4,5 The cot survey data were used to confirm and monitor the course of the outbreak and gauge the success or -failure of implemented control measures, which included hand-washing campaigns, distribution of alcohol-based instant hand sanitizer, and isolation of sick and exposed evacuees.5 Additionally, volunteers conducting the survey instructed and in some cases assisted sick evacuees to report to the medical clinic for evaluation and possible isolation. The cot survey allowed for daily outreach and interface with the population, permitting quick detection of public health concerns.
On September 8, we noticed a decrease in reports of vomiting and diarrhea. This decrease could have represented a true decline in reported symptoms. However, during this time, interviewers were told that rumors were circulating among the evacuees regarding some individuals not reporting illness because of fear of being placed in isolation and being separated from their family members. False-negative reports became a concern for public health officials. Future events should take these possible outcomes into consideration.
Based on surveillance of gastroenteritis in the mobile medical clinic, more than 1,000 evacuees were treated for gastroenteritis in 11 days,4,5 accounting for 17% of all clinic visits. Using reverse transcriptase polymerase chain reaction, norovirus was isolated from vomitus and stool specimens in 35 (45%) of 78 ill patients. Incidence of gastroenteritis was 4.6 visits per 1,000 people per day, with an estimate of 4% of the population becoming ill during the nine-day course of the outbreak. Both the clinic visit surveillance and the cot survey showed a peak in reporting of symptoms on September 5.
When the shelter was established, there was immediate concern regarding the potential for diseases to occur. Crowding, poor sanitation, and compromised health of the evacuees could facilitate norovirus transmission, resulting in high attack rates of gastroenteritis. Norovirus (family Caliciviridae) is the leading cause of outbreaks of gastroenteritis,6 particularly on cruise ships, where similar risk factors (e.g., group contact and close living quarters) exist. Federal regulations require formal investigations for any cruise ship that has more than 3% of its passengers reporting acute gastroenteritis.7 In a previous study, one cruise ship had repeated norovirus outbreaks with attack rates as high as 8%, despite aggressive sanitation and control measures.8 During 2002, the Centers for Disease Control and Prevention confirmed nine noro-virus outbreaks on cruise ships, with one vessel reporting 41% of gastroenteritis among passengers.9 Based on these reports, the outbreak among the evacuees could have been worse and resulted in a significantly greater number of individuals becoming ill.
Communicable respiratory diseases, such as influenza or the common cold, were also of great concern in this population. During the survey, cough and runny nose were frequently reported, with a steady increase during the course of the surveillance period. Toward the end of the surveillance period, health authorities were becoming concerned about the rising percentage of reported respiratory symptoms. Clinic staff believed this was not related to influenza, and the decision was made to continue monitoring the population through the survey and through the clinics, and to continue to encourage the population to practice proper hand washing.
This simple survey took a mean of less than one minute to administer per evacuee, allowing all evacuees present in the cot areas to be assessed every evening. When the survey moved from paper forms to PDAs, data acquisition was less complicated, and nightly tabulation of data was completed in minutes rather than hours.
CONCLUSION
The events in late summer of 2005 were unprecedented and required an immediate public health response. By implementing a symptom monitoring tool in a large-scale evacuee situation, we were able to successfully confirm and monitor an outbreak of acute gastroenteritis. Additionally, during the course of the surveillance period, we were able to identify and monitor a steady increase in reporting of respiratory symptoms. We believe the combined symptom monitoring and outreach could have helped detect other infectious diseases of concern for emergence in this population. These results can be useful for planning future responses to natural disasters or other public health emergencies.
Acknowledgments
The authors thank the numerous faculty, staff, and students at the University of Texas Health Science Center at Houston for their volunteer efforts, including Jennifer Woodward, Larry Dybala, Monica Sierra, Melissa Resnick, Scott Lillibridge, Kim Lockhart, Corinne Aragaki, Larry Whitehead, Jenna Harper, April Clark, Joey Nichols, and Bob Joyce. The authors also thank the Harris County Public Health & Environmental Services and volunteers from Tulane University School of Public Health, Texas A&M University School of Rural Public Health, University of Texas Medical Branch, St. Louis University School of Public Health, University of California at Los Angeles School of Public Health, University of Oklahoma School of Public Health, University of South Florida, the Texas Medical Rangers, and the Centers for Disease Control and Prevention.
Footnotes
The contents of this article were presented in part by Kristy Murray at the 2006 International Conference on Emerging Infectious Diseases in Atlanta, Georgia.
REFERENCES
- 1.Straif-Bourgeois S, Sokol TM, Balsamo G, Hall S, Weed N, Krishna N, et al. Hurricane Katrina's impact on infectious disease surveillance. J La State Med Soc. 2006;158:136–40. [PubMed] [Google Scholar]
- 2.Surveillance for illness and injury after Hurricane Katrina—New Orleans, Louisiana, September 8–25, 2005. MMWR Morb Mortal Wkly Rep. 2005;54(40):1018–21. [PubMed] [Google Scholar]
- 3.Illness surveillance and rapid needs assessment among Hurricane Katrina evacuees—Colorado, September 1–23, 2005. MMWR Morb Mortal Wkly Rep. 2006;55(9):244–7. [PubMed] [Google Scholar]
- 4.Yee EL, Palacio H, Atmar RL, Shah U, Kilborn C, Faul M, et al. Widespread outbreak of norovirus gastroenteritis among evacuees of Hurricane Katrina residing in a large “megashelter” in Houston, Texas: lessons learned for prevention. Clin Infect Dis. 2007;44:1032–9. doi: 10.1086/512195. [DOI] [PubMed] [Google Scholar]
- 5.Norovirus outbreak among evacuees from Hurricane Katrina—Houston, Texas, September 2005. MMWR Morb Mortal Wkly Rep. 2005;54(40):1016–8. [PubMed] [Google Scholar]
- 6.Mead PS, Slutsker L, Dietz V, McCaig LF, Bresee JS, Shapiro C, et al. Food-related illness and death in the United States. Emerg Infect Dis. 1999;5:607–25. doi: 10.3201/eid0505.990502. [DOI] [PMC free article] [PubMed] [Google Scholar]
- 7.Cramer EH, Gu DX, Durbin RE. Diarrheal disease on cruise ships, 1990–2000: the impact of environmental health programs. Am J Prev Med. 2003;24:227–33. doi: 10.1016/s0749-3797(02)00644-x. [DOI] [PubMed] [Google Scholar]
- 8.Isakbaeva ET, Widdowson MA, Beard RS, Bulens SN, Mullins J, Monroe SS, et al. Norovirus transmission on cruise ships. Emerg Infect Dis. 2005;11:154–8. doi: 10.3201/eid1101.040434. [DOI] [PMC free article] [PubMed] [Google Scholar]
- 9.Outbreaks of gastroenteritis associated with norovirus on cruise ships—United States, 2002. MMWR Morb Mortal Wkly Rep. 2002;51(49):1112–5. [PubMed] [Google Scholar]


