

Abstract
Objective
Our aim was to evaluate the reproducibility of a food frequency questionnaire (FFQ) developed in a French population, and its validity against four 24-hour dietary recalls (24-HR).
Methods
57 adults (aged 18 to 63), 17 adolescents (aged 14 to 18), and 20 children (aged 10 to 14) completed four 24-HRs (one per season) and two FFQs over a 1-year interval. Reproducibility of the FFQ was estimated by intraclass correlation coefficients (ICCs). The validity of FFQ was assessed by comparison with the four 24-HRs.
Results
For most nutrients, the first FFQ measurements gave higher mean values than the second FFQ. The ICCs for nutrients ranged from 0.39 for total protein to 0.83 for alcohol. The ICCs were higher for food items consumed daily such as milk (0.80) or sugars and confectionnery (0.65), and lower for rarely eaten food such as inner organs (0.11). Nutrient intakes as assessed by FFQs were higher than those from the 24-HRs, except for alcohol. The de-attenuated Pearson’s correlation coefficient for nutrients varied from 0.25 (dietary fiber) to 0.90 (alcohol), but the adjustment for energy did not improve these coefficients. When nutrient intakes were categorized into quintiles, FFQ and 24-HRs produced agreement rates (same or adjacent quintile) between 55% (for PUFA) and 95% (for alcohol), while misclassification to an extreme quintile was rare (<5%).
Conclusion
The FFQ developed for the FLVS II Study can be used to classify adults or adolescents according to their nutrients and food intakes over a one-year period.
Keywords: validation, food frequency questionnaire, adult, adolescent
INTRODUCTION
The Fleurbaix Laventie Ville Santé Study II (FLVS II) is a longitudinal epidemiologic study, which started in 1999 with the aim of studying the determinants of weight and adiposity changes in children and adults in the general population. One specific aspect was to study the relationships between usual diet and the development of overweight among children, adolescents and adults. Among the various available instruments to evaluate food intake, food frequency questionnaires (FFQ) and dietary history are used to estimate individual perception of usual food intake over a defined period of time (Pietinen et al, 1988; Willett, 1998). To assess long-term usual food intake by 24-hour records or recalls (24-HR), multiple days must be collected and the number of days required increase with the day-to-day variability in the daily intake of the food components. For cost and feasibility reasons, when relative ranking of food and nutrient intake are sufficient for determination of relative risks, FFQs may be advantageous, even if they provide cruder information (Pietinen et al, 1988; Willett, 1998). There are few published French self-administered FFQs (Bonifacj et al, 1997; van Liere et al, 1997). The FFQ published by Bonifacj et al (Bonifacj et al, 1997) was developed in a specific population of Southern France, and the other was not validated for use in young children (van Liere et al, 1997). We developed a new FFQ for the French population with the specific aim of selecting food groups, which have a major contribution to energy and fat intake. The present report describes the reproducibility of this specific FFQ and its validity against four 24-HRs, in adults and adolescents as in children.
METHODS
Food-Frequency Questionnaire
The FFQ was developed according to the methodology proposed by Willett (Willett, 1998) and its construction is presented in the Appendix. The FFQ consists of 124 items: 106 single foods or mixed dishes and 18 soft or alcoholic beverages. They were classified in 24 groups: Inners organs, Processed pork meat products (“charcuterie” in French), Eggs, Meat, Cooked dishes (including a range of dishes from salted pies, pizzas to more complex dishes such as “cassoulet” “paella”), Fish, Cheese, Yogurt, Dairy desserts, Sugars and confectionery, Fats, Milk, Bread, Cereals/pasta/rice, Potatoes, Cakes/pastries/biscuits, Oleaginous fruits (e.g. peanuts), Fruit, Vegetables, Pulses, Sweet beverages and sodas, Water, Alcoholic beverages, Fat reduced foods.
The frequency of consumption inquired about usual food consumption during the previous year through a graded scale of 7 levels ranging in most cases from never to ≥ 3 times a day. For seasonal fruit and vegetables, subjects were asked to declare usual intake during seasons of maximal consumption.
For 45 food items, the subject was referred to a set of colored photographs, each showing three different portion sizes (low, medium, high) of a known weight (estimated from FLVS I Study data, (Lafay et al, 1997)) for the type of food illustrated. The same set of photographs could be used for related food (i.e. a photograph of roast beef for all types of red meat) and there were all together 12 sets of photographs. For the other 61 food items, an average portion size was estimated from the FLVS I Study data for children < 14 years and for adults or adolescents ≥ 14 years. Photographs of cups and glasses were proposed for each beverage.
24-hour dietary recalls
A dietician visited each subject four times to complete a 24-HR. The interviews were meal-sequence based and involved a detailed assessment and description of the food consumed. Subjects had to describe all foods consumed during the previous day, qualitatively and quantitatively using household measures, to allow the dietician to estimate food and beverage intake.
Reproducibility and validity study
Protocol
Volunteers were recruited in families of two small towns from the same region of Fleurbaix and Laventie who had participated in the FLVS I study (Lafay et al, 1997). They were visited at their homes by a dietician on the day they were due to begin their dietary assessment: the whole protocol was explained, the first FFQ delivered and height and weight in light clothes were measured. The dietician returned on day 2 to collect the first FFQ and to complete the first 24-HR. At month 4 and at month 8, the dietician visited each subject to complete respectively the second and the third 24-HR. At month 12, the dietician visited all subjects to give the second FFQ, and came back on the following day to collect the second FFQ and to complete the last 24-HR. Four 24-HRs, namely one per season, were therefore completed over a 1-year period for each subject. These four 24-HRs and the second FFQ inquired about diet over the same time-period.
Subjects
The data collection was carried out from December 1999 to December 2000. One hundred and twenty volunteers were contacted to participate in the FFQ validation study. Thirteen subjects refused because of the constraints of the protocol and 13 returned incomplete recalls. Ninety-four volunteers followed the complete protocol: 57 adults aged 18 to 63 years (29 women and 28 men, mean BMI 24.2 kg/m2, range: 18.9–36.9), 17 adolescents aged 14 to 18 years (9 girls and 8 boys, mean BMI 19.4 kg/m2, range: 14.7–26.8) and 20 children aged 10 to 14 years (11 girls and 9 boys, mean BMI 19.6 kg/m2, range: 13.3–27.3). Because of the small sample of children and the difference in the analysis of validity in this group compared with adolescents and adults (see result section), most results are presented only for the adults and adolescents subgroup (n=74).
Nutrient intake
Estimation of energy and macronutrient intakes for the 24-HRs was obtained using the French REGAL food composition table (Feinberg et al, 1991; Paul & Southgate, 1978). For the FFQs, frequencies were converted into a number of servings per day and multiplied by the portion size. Daily nutrient intakes were obtained using the same food composition table as for 24-h recalls.
Statistical analysis
Reproducibility
Means and standard deviations for food consumption and nutrient intake were calculated for both FFQs. Intraclass correlations were used to measure the reproducibility between the first and the second FFQ. A high value of this coefficient indicates a low within-person variation.
Validity
Intake in all nutrients was logarithmically transformed to achieve normal distributions, which was obtained for all of them, except alcohol. Means and standard deviations for nutrient and food intakes were determined for both FFQs on the one hand and for the average of the four 24-HRs on the other hand. We examined the correlation between estimated intakes for both FFQs and 24-HRs, assuming that the diet recalls represented actual intake. Within-person ( ) and between-person ( ) daily variances were computed for each nutrient and food item in 24-HRs. Pearson correlation coefficients were computed for nutrients and food items after log-transformation of the data and in further steps after de-attenuation (Rimm et al, 1992) and adjustment for energy intake. The second procedure was used because day-to-day within-person variance tends to attenuate the correlation between FFQ and 24-HRs. De-attenuated Pearson correlation coefficients were then obtained from crude coefficients after correction by the factor: , as 24-HRs were repeated four times (Beaton et al, 1979). Nutrient and food intake data were adjusted for energy by using the residual method (Willett & Stampfer, 1986). Study subjects were classified into quintile categories of energy, macronutrient and food intakes based on the distribution of data for both FFQs and the average of four 24-HRs. Proportions of subjects classified into the same or adjacent and extreme quintiles by the two methods were derived for crude variables.
Comparison of estimation of energy intake with minimal energy requirements was performed by calculation of the ratio Energy Intake/Bassal Metaolic Rate (EI/BMR) for the FFQ and the 24-HRs by age group. Basal metabolic rate was calculated using weight (measured by the dietician, according to the equation of Schofield (Schofield, 1985).
Statistical analysis was performed by using SAS software (release 8.2; SAS Institute Inc, Cary, NC).
RESULTS
Reproducibility
Daily intakes of each nutrient obtained using the different dietary assessment methods (two FFQs and four 24-HRs over a 1-y period) are presented in table 1 for adults and adolescents. The intraclass correlation coefficients for the two FFQs ranged from 0.40 to 0.60 for most nutrients and to 0.83 for alcohol.
Table 1.
Nutrients. Comparison of mean daily intake of 74 persons (adults and adolescents) estimated by different dietary assessment methods (two FFQs filled one year apart and the average of four 24 hr recalls over the same year) and FFQ’s reproducibility: ratio of mean daily consumption (%) estimated by the two FFQ and intraclass correlation coefficients (ICC).
| Daily intake of nutrients |
Reproducibility |
||||
|---|---|---|---|---|---|
| 24-HR | FFQ1 | FFQ2 | FFQ2 (%FFQ1) | ICC | |
| Energy (kcal) | 2025 (513) | 2753 (1071)* | 2626 (1047)* | 95 | 0.60 |
| Proteins (g) | 80 (20) | 106 (36)* | 103 (40)* | 97 | 0.39 |
| Total fat (g) | 91 (25) | 119 (48)* | 114 (52)* | 96 | 0.55 |
| SFA (g) | 39 (12) | 50 (21)* | 47 (22)* | 94 | 0.55 |
| MUFA (g) | 30 (9) | 39 (15)* | 38 (17)* | 97 | 0.45 |
| PUFA(g) | 12 (4) | 17 (9)* | 16 (8)* | 96 | 0.57 |
| Cholesterol (g) | 394 (115) | 489 (184)* | 477 (185)* | 97 | 0.48 |
| Carbohydrates (g) | 222 (71) | 309 (139)* | 290 (129)* | 94 | 0.70 |
| Simple sugars (g) | 92 (42) | 118 (68)* | 110 (68)* | 92 | 0.77 |
| Dietary fiber (g) | 12 (4) | 18 (7)* | 18 (6)* | 95 | 0.51 |
| Alcohol (g) | 16 (20) | 13 (19)* | 13 (23) | 105 | 0.83 |
Mean (SD).
Significantly different from the value of the 24-HR: Student’s paired t-test on log transformed values, p<0.05
No significant difference was observed between FFQ1 and FFQ2
Daily intakes of each food group obtained using the different dietary assessment methods are presented in table 2. The most noticeable differences (≥ ±25 percent) between the first and the second FFQs were for inner organs and cheese, but these differences remained not significant. The intraclass correlation coefficients between FFQs ranged between 0.35 to 0.60 for most food items. The coefficients were lowest for rarely eaten foods such as inner organs (0.11).
Table 2.
Food groups. Comparison of mean daily intake (g) of 74 persons (adults and adolescents) estimated by different dietary assessment methods (two FFQs filled one year apart and the average of four 24 hr recalls over the same year) and FFQ’s reproducibility: ratio of mean daily consumption (%) estimated by the two FFQ and intraclass correlation coefficients (ICC).
| Daily intake of nutrients |
Reproducibility |
||||
|---|---|---|---|---|---|
| 24-HR | FFQ1 | FFQ2 | FFQ2 (%FFQ1) | ICC | |
| Inner organs | 3 (10) | 3 (3) | 4 (14) | 139 | 0.11 |
| Pork meat products | 43 (33) | 37 (33) | 36 (34) | 99 | 0.64 |
| Eggs | 18 (19) | 21 (14) | 22 (13) | 103 | 0.48 |
| Meat | 86 (55) | 131 (67)* | 138 (91)* | 106 | 0.34 |
| Cooked dishes | 54 (66) | 105 (68)* | 94 (69)* | 90 | 0.51 |
| Fish | 25 (38) | 18 (16) | 20 (17) | 110 | 0.58 |
| Cheese | 39 (31) | 35 (37) | 26 (29)* | 73 | 0.48 |
| Yoghurt | 62 (65) | 73 (82) | 79 (93) | 108 | 0.45 |
| Dairy desserts | 33 (37) | 41 (59) | 36 (47) | 89 | 0.39 |
| Sugars and confectionnery | 44 (33) | 57 (40)* | 58 (39)* | 101 | 0.65 |
| Fats | 31 (25) | 29 (23) | 28 (23) | 98 | 0.48 |
| Milk | 92 (132) | 150 (204)* | 132 (192)* | 88 | 0.80 |
| Bread | 78 (48) | 121 (64)* | 111 (68)* | 92 | 0.46 |
| Cereals, pasta and rice | 75 (54) | 119 (84)* | 112 (78)* | 94 | 0.48 |
| Potatoes | 89 (61) | 168 (105)* | 157 (95)* | 93 | 0.38 |
| Cakes/pastries/biscuits | 67 (45) | 51 (56)* | 48 (44)* | 94 | 0.45 |
| Oleaginous fruits | 6 (11) | 8 (15) | 8 (13) | 107 | 0.73 |
| Fruits | 71 (79) | 133 (127)* | 123 (107)* | 93 | 0.53 |
| Vegetables | 180 (136) | 213 (134)* | 199 (152) | 94 | 0.57 |
| Pulses | 5 (12) | 5 (7) | 5 (5) | 90 | 0.40 |
| Sweet beverage and sodas | 174 (254) | 314 (499)* | 257 (416)* | 82 | 0.80 |
| Water | 1143 (578) | 593 (342)* | 614 (358)* | 104 | 0.54 |
| Alcoholic beverage | 191 (241) | 206 (379) | 206 (417) | 100 | 0.90 |
| Fat reduced foods | 2 (4) | 29 (50)* | 30 (53)* | 104 | 0.63 |
Mean (SD)
Significantly different from the value of the 24-HR: Student’s paired t-test, p=0.05
No significant difference was observed between FFQ1 and FFQ2 (Student’s paired t-test, p=0.05)
Validity
Nutrients in adults and adolescents
Nutrient intakes assessed by both FFQs were significantly higher than those from the 24-Hrs (Table 1). Pearson correlation coefficients were higher between the second FFQ and 24-HRs (that referred to the same 1-y period) than between the first FFQ and 24-HRs (Table 3). Between the second FFQ and 24-HRs, Pearson correlation coefficient for energy was 0.61, with a mean of 0.52 for all nutrients. The crude correlations were closely similar for protein, fats and total carbohydrates. For several nutrients, there was considerably more within-person than between-person variations as indicated by the variance ratio for 24-h dietary recalls data. As expected, de-attenuation improved the Pearson correlation coefficients for energy and nutrient intakes, especially for those with the highest variance ratio such as total carbohydrates and energy. De-attenuated Pearson correlation coefficients between the second FFQ and 24-HRs ranged from 0.45 to 0.70 for most nutrients. Energy adjustment did not improve the correlations. The classification in quintiles (Table 4) gave similar results for both FFQs with on average 73% of subjects classified in the same or adjacent quintiles with FFQ1 and 71% with FFQ2. Misclassification in opposite extreme quintiles between FFQs and 24-HRs exceeded 5% only for PUFA in the second FFQ. On average, 1% of subjects were grossly misclassified into opposite extreme quintiles for nutrient intake in the first FFQ and 4% in the second FFQ.
Table 3.
Validity FFQs vs average of four 24-HR recalls. Nutrients: ratio of mean daily consumption (%) by the two methods and Pearson correlation coefficients (n=74 adults and adolescents).
| FFQ1/24-HR |
FFQ2/24-HR |
||||||||
|---|---|---|---|---|---|---|---|---|---|
| Variance ratioa | FFQ1 (% 24-HR) | rb | rc | rd | FFQ2 (% 24-HR) | rb | rc | rd | |
| Energy (kcal) | 1.3 | 136 | 0.46 | 0.53 | 130 | 0.61 | 0.70 | ||
| Proteins (g) | 0.6 | 133 | 0.26 | 0.27 | 0.33 | 129 | 0.41 | 0.44 | 0.39 |
| Total fat (g) | 0.9 | 130 | 0.40 | 0.44 | 0.42 | 126 | 0.59 | 0.66 | 0.48 |
| SFA (g) | 0.5 | 127 | 0.47 | 0.49 | 0.41 | 119 | 0.63 | 0.67 | 0.42 |
| MUFA (g) | 0.8 | 129 | 0.35 | 0.38 | 0.25 | 125 | 0.54 | 0.60 | 0.40 |
| PUFA(g) | 1.0 | 141 | 0.18 | 0.20 | 0.24 | 135 | 0.25 | 0.28 | 0.23 |
| Cholesterol (g) | 0.9 | 124 | 0.20 | 0.22 | 0.15 | 121 | 0.46 | 0.50 | 0.20 |
| Carbohydrates (g) | 2.1 | 140 | 0.55 | 0.68 | 0.57 | 131 | 0.60 | 0.74 | 0.62 |
| Simple sugars (g) | 0.4 | 129 | 0.57 | 0.60 | 0.36 | 119 | 0.57 | 0.60 | 0.53 |
| Dietary fiber (g) | 0.1 | 152 | 0.33 | 0.34 | 0.44 | 145 | 0.25 | 0.25 | 0.40 |
| Alcohol (g) | 1.0 | 79 | 0.85 | 0.95 | 0.79 | 83 | 0.80 | 0.90 | 0.82 |
ratio between within-person ( ) and between-person ( ) daily variances computed with the four 24-HRs.
FFQ/24-HR Pearson correlation coefficient.
FFQ/24-HR de-attenuated Pearson correlation coefficient (corrected for within-person variation in 24-HRs).
FFQ/24-HR de-attenuated and energy-adjusted Pearson correlation coefficient. Correlation coefficients computed with log transformed values
Table 4.
Validity FFQs vs average of four 24-HR recalls. Nutrients: percentage of subjects classified in the same, adjacent or extreme quintiles of nutrient distribution by the FFQs and the 24 HR recall (n=74 adults and adolescents).
| FFQ1/24-HR |
FFQ2/24-HR |
|||||
|---|---|---|---|---|---|---|
| % in the same quintile | % in adjacent quintiles | % in extreme quintiles | % in the same quintile | % in adjacent quintiles | % in extreme quintiles | |
| Energy (kcal) | 41 | 31 | 0 | 28 | 49 | 5 |
| Proteins (g) | 27 | 50 | 0 | 26 | 38 | 4 |
| Total fat (g) | 28 | 47 | 0 | 28 | 43 | 5 |
| SFA (g) | 38 | 42 | 0 | 32 | 42 | 5 |
| MUFA (g) | 34 | 36 | 0 | 26 | 42 | 4 |
| PUFA (g) | 23 | 34 | 1 | 18 | 38 | 7 |
| Cholesterol (g) | 26 | 43 | 4 | 28 | 31 | 4 |
| Carbohydrates (g) | 38 | 39 | 1 | 36 | 43 | 4 |
| Simple sugars (g) | 36 | 41 | 3 | 31 | 43 | 3 |
| Dietary fiber (g) | 23 | 39 | 5 | 28 | 36 | 5 |
| Alcohol (g) | 42 | 51 | 0 | 46 | 49 | 0 |
Influence of age
If de-attenuated Pearson correlation coefficients for nutrients were in the adolescent subgroup closed to those found in the adult subgroup (Figure 1), except for protein (0.76 in adolescents vs. 0.42 in adults), de-attenuated Pearson correlation coefficients for nutrients were clearly lower in the children subgroup and they were below 0.40 for all nutrients except MUFA.
Figure 1.
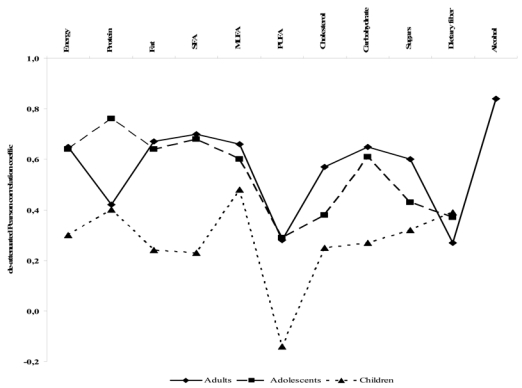
Validity FFQ2 vs the average of four 24-HR. Nutrients: de-attenuated Pearson correlation coefficients among adults (n=57), adolescents (n=17) and children (n=20).
Food items in adults and adolescents
Among 24 food groups, one was underestimated by both FFQs compared with 24-HRs (Cakes/pastries/biscuits) and 13 food groups were overestimated by both FFQs (Table 2). The most noticeable differences (FFQ/24-HR ratio ≥ ±50 percent) between both FFQs and 24-HRs were meat, cooked dishes, cereals, potatoes, fruits and fat-reduced foods. Pearson correlation coefficients for food items were quite similar between the second FFQ and 24-HRs (that referred to the same 1-y period) and between the first FFQ and 24-HRs (Table 5). Between the second FFQ and 24-HRs, Pearson correlation coefficient for foods ranged from 0.02 for eggs to 0.77 for alcoholic beverages, with a mean of 0.37. De-attenuation to correct for intra-individual variability improved the Pearson correlation coefficient and led to the greatest changes for intakes in fats (0.37 to 0.54), cakes/pastries/biscuits (0.56 to 0.73) and inner organs (0.38 to 0.53). Inner organs, cooked dishes, fish, fats ands cereals/pasta/rice presented the highest variance ratios. Energy adjustment did not improve the correlations for food items. The classification in quintiles (Table 6) gave similar results for both FFQs with on average 66 % of subjects classified in the same or adjacent quintiles. On average, 3 percent of subjects were grossly misclassified into opposite extreme quintiles for food intake in both FFQs.
Table 5.
Validity FFQs vs average of four 24-HR recalls. Food groups: ratio of mean daily consumption (%) by the two methods and Pearson correlation coefficients (n=74 adults and adolescents).
| FFQ1/24-HR |
FFQ2/24-HR |
||||||||
|---|---|---|---|---|---|---|---|---|---|
| Variance ratioa | FFQ1(%24-HR) | rb | rc | rd | FFQ2(% 24-HR) | rb | rc | rd | |
| Inner organs | 3.8 | 81 | 0.47 | 0.65 | 0.64 | 113 | 0.38 | 0.53 | 0.37 |
| Pork meat products | 0.7 | 85 | 0.24 | 0.26 | 0.14 | 84 | 0.38 | 0.41 | 0.21 |
| Eggs | 2.7 | 116 | 0.13 | 0.16 | 0.01 | 120 | 0.02 | 0.02 | 0.01 |
| Meat | 0.5 | 151 | 0.33 | 0.35 | 0.12 | 160 | 0.39 | 0.41 | 0.21 |
| Cooked dishes | 4.6 | 196 | 0.20 | 0.30 | −0.04 | 176 | 0.06 | 0.09 | −0.13 |
| Fish | 5.5 | 72 | 0.09 | 0.13 | −0.06 | 79 | 0.19 | 0.30 | −0.09 |
| Cheese | 1.1 | 91 | 0.25 | 0.28 | 0.32 | 66 | 0.23 | 0.26 | 0.23 |
| Yoghurt | 1.4 | 119 | 0.56 | 0.65 | 0.61 | 128 | 0.38 | 0.44 | 0.42 |
| Dairy desserts | 2.4 | 124 | 0.41 | 0.52 | 0.00 | 110 | 0.44 | 0.55 | 0.24 |
| Sugars and confectionnery | 1.4 | 129 | 0.50 | 0.58 | 0.31 | 130 | 0.59 | 0.68 | 0.49 |
| Fats | 4.3 | 94 | 0.29 | 0.42 | 0.26 | 92 | 0.37 | 0.53 | 0.59 |
| Milk | 0.7 | 162 | 0.66 | 0.71 | 0.49 | 142 | 0.70 | 0.76 | 0.51 |
| Bread | 1.0 | 154 | 0.24 | 0.27 | 0.17 | 142 | 0.38 | 0.42 | 0.27 |
| Cereals, pasta and rice | 6.7 | 159 | −0.06 | −0.09 | 0.04 | 150 | 0.06 | 0.10 | 0.17 |
| Potatoes | 2.5 | 189 | 0.25 | 0.32 | −0.04 | 176 | 0.32 | 0.41 | 0.00 |
| Cakes/pastries/biscuits | 2.8 | 77 | 0.46 | 0.60 | 0.40 | 72 | 0.56 | 0.73 | 0.42 |
| Oleaginous fruits | 3.3 | 129 | 0.15 | 0.20 | 0.25 | 138 | 0.27 | 0.36 | 0.43 |
| Fruits | 0.5 | 188 | 0.29 | 0.31 | 0.26 | 174 | 0.36 | 0.38 | 0.35 |
| Vegetables | 1.8 | 118 | 0.65 | 0.78 | 0.76 | 111 | 0.60 | 0.72 | 0.65 |
| Pulses | 2.4 | 101 | 0.06 | 0.07 | 0.08 | 91 | 0.09 | 0.12 | 0.18 |
| Sweet beverage and sodas | 0.1 | 181 | 0.61 | 0.62 | 0.36 | 148 | 0.67 | 0.68 | 0.26 |
| Water | 0.1 | 52 | 0.38 | 0.39 | 0.32 | 54 | 0.37 | 0.37 | 0.38 |
| Alcoholic beverage | 0.8 | 108 | 0.84 | 0.91 | 0.84 | 108 | 0.77 | 0.84 | 0.78 |
| Fat reduced foods | 1.3 | 1494 | 0.44 | 0.51 | 0.46 | 1549 | 0.34 | 0.40 | 0.33 |
ratio between within-person ( ) and between-person ( ) daily variances computed with the four 24-HRs.
FFQ/24-HR Pearson correlation coefficient.
FFQ/24-HR de-attenuated Pearson correlation coefficient (corrected for within-person variation in 24-HRs).
FFQ/24-HR de-attenuated and energy-adjusted Pearson correlation coefficient.
Table 6.
Validity FFQs vs average of four 24-HR recalls. Food groups: percentage of subjects classified in the same, adjacent or extreme quintiles of food intake distribution by the FFQs and the 24 HR recall (n=74 adults and adolescents).
| FFQ1/24-HR |
FFQ2/24-HR |
|||||
|---|---|---|---|---|---|---|
| % in the same quintile | % in adjacent quintiles | % in extreme quintiles | % in the same quintile | % in adjacent quintiles | % in extreme quintiles | |
| Inner organs | 57 | 0 | 0 | 55 | 0 | 0 |
| Pork meat products | 22 | 34 | 1 | 20 | 34 | 5 |
| Eggs | 16 | 32 | 7 | 22 | 28 | 11 |
| Meat | 32 | 24 | 3 | 28 | 39 | 4 |
| Cooked dishes | 20 | 27 | 7 | 18 | 35 | 4 |
| Fish | 24 | 35 | 3 | 32 | 32 | 5 |
| Cheese | 24 | 34 | 3 | 19 | 32 | 3 |
| Yoghurt | 28 | 36 | 3 | 39 | 36 | 1 |
| Dairy desserts | 34 | 32 | 3 | 35 | 35 | 3 |
| Sugars and confectionnery | 36 | 41 | 3 | 32 | 41 | 4 |
| Fats | 23 | 50 | 4 | 26 | 35 | 4 |
| Milk | 31 | 53 | 0 | 43 | 24 | 1 |
| Bread | 30 | 42 | 3 | 22 | 47 | 3 |
| Cereals, pasta and rice | 23 | 30 | 7 | 19 | 35 | 9 |
| Potatoes | 27 | 30 | 4 | 27 | 35 | 5 |
| Cakes/pastries/biscuits | 36 | 39 | 1 | 32 | 32 | 4 |
| Oleaginous fruits | 28 | 28 | 1 | 18 | 46 | 3 |
| Fruits | 35 | 28 | 4 | 28 | 34 | 4 |
| Vegetables | 30 | 46 | 4 | 45 | 31 | 1 |
| Pulses | 0 | 69 | 1 | 5 | 54 | 1 |
| Sweet beverage and sodas | 36 | 47 | 0 | 45 | 34 | 0 |
| Water | 27 | 38 | 4 | 38 | 35 | 3 |
| Alcoholic beverage | 50 | 42 | 1 | 54 | 41 | 0 |
| Fat reduced foods | 45 | 26 | 0 | 18 | 55 | 3 |
Underestimation
Mean of EI/BMR ratios (Figure 2) reached higher level for both FFQs than for 24-HRs.
Figure 2.
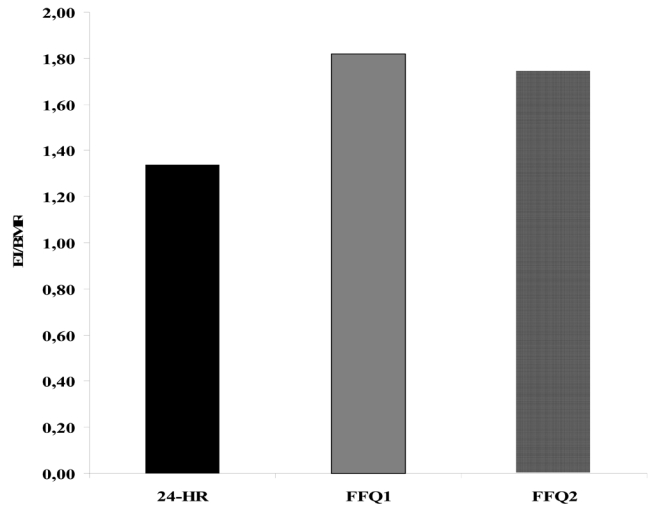
Mean Energy Intake/BMR ratio and error bars according to the dietary assessment methods: two FFQs filled one year aport and the average of four 24 HR recalls over the same year (n=74 adults and adolescents).
DISCUSSION
The aim of this study was to estimate the reproducibility and relative validity of the FFQ designed for the FLVS II Study. This FFQ was developed to study the relationship between diet and the development of overweight among children, adolescents and adults.
FFQ structure
The number of food items listed in food frequency questionnaires tends to vary widely. A review (Cade et al, 2002) found that the number of food items on a questionnaire ranged from 5 to 350. Willet (Willett, 1998), suggested that there is a rapidly decreasing marginal gain in information obtained with increasingly detailed questionnaires. Our FFQ, which was composed of a list of 124 food items, appears therefore to have an optimal length.
Reproducibility
Reproducibility of food frequency questionnaires has been assessed using two measurements with varying time intervals, from 15 days (Vereecken & Maes, 2003) to several years (Shu et al, 2004) but for most studies with two or more measurements over a 1-y period (Gnardellis et al, 1995; Kelemen et al, 2003; Malekshah et al, 2006; Ocke et al, 1997; Ocke et al, 1997; Pietinen et al, 1988; Pietinen et al, 1988; van Liere et al, 1997). In these previous studies, the intraclass correlation coefficients were generally similar to our results and ranged from 0.4 to 0.8 for nutrients intake and from 0.3 to 0.8 for food groups. Overall, the reproducibility of our instrument was slightly lower than the French Dietary History Questionnaire (van Liere et al, 1997), except in terms of alcohol consumption, which was well detailed in our questionnaire. Reproducibility tests are based on the assumption that diet does not change between two questionnaires, so reproducibility may ideally be assessed by two closely administered questionnaires, but in that case subjects would likely remember and repeat their responses (Willett, 1998). Our time interval was long (one year), the observed reproducibility may be lower than the true value as differences in responses may reflect true changes in dietary habits as well as variation in response.
Validity
Reference method
A major component of the validation process is the selection of the appropriate reference method against which to assess the test measurement. There is no gold standard for the measure of dietary intake. However, it is crucial that the errors of both methods be as independent as possible. The major sources of errors in FFQs are memory, interpretation of questions, perception of serving sizes and the restriction imposed by a fixed list of food. Diet records, with their open-ended form and their independency towards memory, are then likely to have the least correlated errors with FFQs (Willett, 1998). Nevertheless, keeping a diet record represents a substantial burden on subjects and it commonly changes respondents' diet (Block et al, 1986; Margetts & Nelson, 1997). Collection of multiple 24-hour recalls is then often considered as an alternative to the use of diet records (Willett, 1998). In a recent review about validation of FFQs, authors showed that 75% of studies validated FFQs against repeated 24-HRs (Cade et al, 2002).
Number of recalls
To estimate long-term usual intake, collection of 3 to 4 days of recalls in each of four seasons of the year is considered as ideal (Willett, 1998). However, several studies enhanced the possibility of using only a small number of replicate measures for the reference method combined with a statistical adjustment to remove the effects of within-person variation. The greatest statistical efficiency is obtained with only two, and at the most five, replicates per subjects (Carroll et al, 1997; Rosner & Willett, 1988; Stram et al, 1995). In that context, to validate our FFQ against four 24-hour recalls appeared as adequate.
Number of subjects
Despite the demonstrated validity of our FFQ, one limitation of our study is the size of the population. The recommended number of cases in validation studies is at least 100 cases, and that number should be enhanced when the age range is large and when the number of replicates per subjects is limited (Cade et al, 2002). Unfortunately, our time and financial resources did not allow us to contact more than 120 individuals, and among them 19% did not fully complete the study. This problem of sample size was crucial among children (n=20) who could not be pooled with adolescents and adults and had to be excluded from our analyses.
Comparison with other studies
The higher correlation between the second FFQ and 24-HRs, which covered the same time period, than between the first FFQ and 24-HRs was previously underlined in similar studies (Pietinen et al, 1988; Shu et al, 2004; Willett, 1998). Pearson correlation coefficients between FFQ and four 24-hour dietary recalls in our study were moderate when compared to other validation studies conducted among adults (Bingham et al, 2001; Chen et al, 2004; Kelemen et al, 2003; Malekshah et al, 2006; McNaughton et al, 2005; Rodriguez et al, 2002; Shu et al, 2004; Verkleij-Hagoort et al, 2006) or adolescents (Lietz et al, 2002; Rockett et al, 1995; Vereecken & Maes, 2003). Except for PUFA, our de-attenuated correlation coefficients, ranging mainly from 0.45 to 0.70 for nutrients, compared favorably with those reported for two French questionnaires, as presented in table 7 (Bonifacj et al, 1997; van Liere et al, 1997) or for questionnaires developed in European countries (Bingham et al, 1994; Decarli et al, 1996; Gnardellis et al, 1995; Martin-Moreno et al, 1993; Ocke et al, 1997; Ocke et al, 1997; Pietinen et al, 1988; Pietinen et al, 1988; Vereecken & Maes, 2003). In our study, adjustment for energy led to a decrease in correlation coefficients for most nutrients, which according to Willet (Willett & Stampfer, 1986) happens when variability is more related to systematic errors of under/overestimation than to energy intake. It could also be a consequence of the FFQ development which focused on food items that contributed substantially to energy intake. This specificity of our FFQ may explain its rather good performance for the assessment of energy and macronutrients compared to others questionnaires. It may also explain its limitations for the assessment of nutrients that contribute little to energy such as PUFA. Indeed, PUFA intake comes mainly from intake of fatty fish, nuts and some oils. In our questionnaire questions on fish consumption were based on preparation (canned fish in oil, breaded fish, smoked or salted fish..) which influences energy intake rather than on the type of fish, which would be important for a more accurate assessment of PUFA intake.
Table 7.
Comparison of de-attenuated Pearson correlation coefficients for various nutrients in two French validation studies comparing dietary records and food frequency questionnaires.
| Bonifacj1 | Van Liere 2 | FLVS study 3 | |
|---|---|---|---|
| (N=98) | (N=119) | (N=74) | |
| 68 women, 30 men | 119 women | 38 women, 36 men | |
| Energy | 0.42 | 0.43 | 0.70 |
| Total protein | 0.31 | 0.35 | 0.44 |
| Total fat | 0.44 | 0.55 | 0.66 |
| Satured fat | 0.30 | - | 0.67 |
| Monounsatured fat | 0.39 | - | 0.60 |
| Polyunsatured fat | 0.70 | - | 0.28 |
| Cholesterol | 0.52 | 0.53 | 0.50 |
| Total carbohydrate | 0.27 | 0.45 | 0.74 |
| Simple sugars | 0.25 | - | 0.60 |
| Dietary fiber | 0.56 | - | 0.25 |
| Alcohol | 0.80 | 0.70 | 0.90 |
FFQ/7 days estimated-diet records in adults;
FFQ/twelve 24-h recalls in adults;
FFQ/four 24-h recalls in adults and adolescents
Despite some difference in estimation of both nutrients and foods, agreement in classification was good. More than 70% of subjects were classified in the same or adjacent quintile for energy and macronutrient intakes by both methods, that is quite similar to other French questionnaires (Bonifacj et al, 1997; van Liere et al, 1997). Misclassification was higher for dietary fibers and PUFA (5% and 7% classified in opposite extreme quintiles among in adults or adolescents compared with 24-HR)..
Underestimation
All dietary assessment methods have their limitations and do not necessarily provide a true absolute estimate of food consumption. Comparison of EI/BMR estimates with minimal energy requirements provides an indirect indication of bias. Energy requirements, as given by WHO (World Health Organisation, 1985), are 1.56*BMR for subjects with light activity level, 1.64*BMR for moderate activity level, and 1.82*BMR for high activity level. EI/BMR as estimated in our study by the 24-hour recalls lies just under the requirements for light activities among adults, whereas the ratio estimated by the FFQ is close to the requirements for high activity among adults. Part of the absolute differences between the 24-hour recalls and FFQ data may then be partially explained by a more severe underestimation with 24-hour recalls than with FFQ or by the overestimation with FFQ as suggested by Bingham (Bingham et al, 2003). Similar differences in EI/BMR ratios calculated from 24-HRs or from FFQ were previously underlined (Bingham et al, 2001; Chen et al, 2004; Kelemen et al, 2003; Malekshah et al, 2006; McNaughton et al, 2005; Rodriguez et al, 2002; Shu et al, 2004; van Liere et al, 1997; Verkleij-Hagoort et al, 2006). Finally, under or overestimation is not necessarily problematic in epidemiological studies if the ranking of the persons according to their dietary intake is valid (Beaton, 1991).
Reproducibility and validity among children
Other investigators have supported experience of difficulty in completing FFQs among young children and they found that validity of food frequency questionnaires increases with age (Field et al, 1999). They suggested that young children might have difficulties in thinking abstractly and in understanding the concept of 'average intake', particularly for seasonal food such as fruit. (Buzzard et al, 2001). However, there is a rapid increase in the ability of children to self-report food intake from the age of 8 years (Livingstone & Robson, 2000). Our results show a good applicability of a FFQ developed among adults to an adolescent population. It has previously been reported in the EPIC study (Lietz et al, 2002).
External validity
Our validation study was performed on young and middle-aged adults and adolescents from the general population in Northern France. Volunteers to a validation study have usually a higher level of education than the average population. However subjects participating in epidemiologic studies whose FFQs are correctly filled in show the same bias.
We conclude that the FFQ questionnaire developed for the FLVS II Study can be used to classify study subjects from the general population according to their nutrients and food intakes over a one-year period among adults and adolescents in epidemiologic studies. However, our results are not sufficient to validate the questionnaire among children (aged 8 to 14 years) and for PUFA intake in all groups.
Acknowledgments
Sources of support: The Fleurbaix-Laventie Ville Santé Study was supported by grants from the CEDUS (Centre for Sugar Research and Information), the CISB (Centre for Beer Scientific Information), Groupe Fournier, Knoll, Lesieur, Nestlé France, and Roche Diagnostics companies. MA Charles was a recipient of grants from the ALFEDIAM (Association de Langue Française pour l’Étude du Diabète et du Métabolisme) and from the Mutuelle Générale de l’Éducation Nationale.
APPENDIX
Development of the food frequency questionnaire
The food frequency questionnaire was developed according to the methodology preposed by Willett (Willett, 1998). The food list was defined on the basis of dietary intake data obtained from the Fleurbaix Laventie Ville Santé I (FLVS I) Study (Lafay et al, 1997). In 1992–93, 549 families, living in Fleurbaix and Laventie, two small towns of Northern France, participated in an epidemiologic study. Dietary intake was assessed using a one-day record (not on a school day) for children under 14 y (1146 children) and a 3-d record (two weekdays and one weekend day) for adolescents and adults (130 adolescents, aged 14 to 18 y, and 1088 adults, aged 18 y or more). The methods and results of this dietary survey were described in a previous paper (Lafay et al, 1998). We used regression analysis to identify the food items contributing substantially to energy and fat intake and with a high between-subjects coefficient of variation. Using this procedure, 124 items were selected. For each item, two series of three portions size were estimated, one for children aged less than 14 years and another for adolescents aged ≥ 14 years and adults: low, medium and high portion sizes (g) were estimated from tertiles of the amount of the FLVS I Study subjects’ consumption for each item.
Footnotes
Nature of the contribution: V Deschamps conceived the paper and led the design, interpretation and preparation of the manuscript. B de Lauzon-Guillain contributed to the data analysis and manuscript writing. L Lafay participated in the development of the questionnaire, study design, interpretation of the results and revision of the drafts. MA Charles and M Romon were involved in all aspects from study conception to manuscript writing.
References
- Beaton . Interpretation of results from diet history studies. In: Smith-Gordon D, editor. The diet history method. London: 1991. [Google Scholar]
- Beaton GH, Milner J, Corey P, McGuire V, Cousins M, Stewart E, et al. Sources of variance in 24-hour dietary recall data: implications for nutrition study design and interpretation. Am J Clin Nutr. 1979;32:2546–9. doi: 10.1093/ajcn/32.12.2546. [DOI] [PubMed] [Google Scholar]
- Bingham SA, Gill C, Welch A, Day K, Cassidy A, Khaw KT, et al. Comparison of dietary assessment methods in nutritional epidemiology: weighed records v. 24 h recalls, food-frequency questionnaires and estimated-diet records. Br J Nutr. 1994;72:619–43. doi: 10.1079/bjn19940064. [DOI] [PubMed] [Google Scholar]
- Bingham SA, Luben R, Welch A, Wareham N, Khaw KT, Day N. Are imprecise methods obscuring a relation between fat and breast cancer? Lancet. 2003;362:212–4. doi: 10.1016/S0140-6736(03)13913-X. [DOI] [PubMed] [Google Scholar]
- Bingham SA, Welch AA, McTaggart A, Mulligan AA, Runswick SA, Luben R, et al. Nutritional methods in the European Prospective Investigation of Cancer in Norfolk. Public Health Nutr. 2001;4:847–58. doi: 10.1079/phn2000102. [DOI] [PubMed] [Google Scholar]
- Block G, Hartman AM, Dresser CM, Carroll MD, Gannon J, Gardner L. A data-based approach to diet questionnaire design and testing. Am J Epidemiol. 1986;124:453–69. doi: 10.1093/oxfordjournals.aje.a114416. [DOI] [PubMed] [Google Scholar]
- Bonifacj C, Gerber M, Scali J, Daures JP. Comparison of dietary assessment methods in a southern French population: use of weighed records, estimated-diet records and a food-frequency questionnaire. Eur J Clin Nutr. 1997;51:217–31. doi: 10.1038/sj.ejcn.1600387. [DOI] [PubMed] [Google Scholar]
- Buzzard IM, Stanton CA, Figueiredo M, Fries EA, Nicholson R, Hogan CJ, et al. Development and reproducibility of a brief food frequency questionnaire for assessing the fat, fiber, and fruit and vegetable intakes of rural adolescents. J Am Diet Assoc. 2001;101:1438–46. doi: 10.1016/S0002-8223(01)00347-9. [DOI] [PubMed] [Google Scholar]
- Cade J, Thompson R, Burley V, Warm D. Development, validation and utilisation of food-frequency questionnaires - a review. Public Health Nutr. 2002;5:567–87. doi: 10.1079/PHN2001318. [DOI] [PubMed] [Google Scholar]
- Carroll RJ, Pee D, Freedman LS, Brown CC. Statistical design of calibration studies. Am J Clin Nutr. 1997;65:1187S–1189S. doi: 10.1093/ajcn/65.4.1187S. [DOI] [PubMed] [Google Scholar]
- Chen Y, Ahsan H, Parvez F, Howe GR. Validity of a food-frequency questionnaire for a large prospective cohort study in Bangladesh. Br J Nutr. 2004;92:851–9. doi: 10.1079/bjn20041277. [DOI] [PubMed] [Google Scholar]
- Decarli A, Franceschi S, Ferraroni M, Gnagnarella P, Parpinel MT, La Vecchia C, et al. Validation of a food-frequency questionnaire to assess dietary intakes in cancer studies in Italy. Results for specific nutrients. Ann Epidemiol. 1996;6:110–8. doi: 10.1016/1047-2797(95)00129-8. [DOI] [PubMed] [Google Scholar]
- Feinberg M, Favier JC, Ireland Ripert J. Répertoire Général des Aliments. Paris: Lavoisier; 1991. [Google Scholar]
- Field AE, Peterson KE, Gortmaker SL, Cheung L, Rockett H, Fox MK, et al. Reproducibility and validity of a food frequency questionnaire among fourth to seventh grade inner-city school children: implications of age and day-to-day variation in dietary intake. Public Health Nutr. 1999;2:293–300. doi: 10.1017/s1368980099000397. [DOI] [PubMed] [Google Scholar]
- Gnardellis C, Trichopoulou A, Katsouyanni K, Polychronopoulos E, Rimm EB, Trichopoulos D. Reproducibility and validity of an extensive semiquantitative food frequency questionnaire among Greek school teachers. Epidemiology. 1995;6:74–7. doi: 10.1097/00001648-199501000-00015. [DOI] [PubMed] [Google Scholar]
- Kelemen LE, Anand SS, Vuksan V, Yi Q, Teo KK, Devanesen S, et al. Development and evaluation of cultural food frequency questionnaires for South Asians, Chinese, and Europeans in North America. J Am Diet Assoc. 2003;103:1178–84. doi: 10.1016/s0002-8223(03)00985-4. [DOI] [PubMed] [Google Scholar]
- Lafay L, Basdevant A, Charles MA, Vray M, Balkau B, Borys JM, et al. Determinants and nature of dietary underreporting in a free-living population: the Fleurbaix Laventie Ville Sante (FLVS) Study. Int J Obes Relat Metab Disord. 1997;21:567–73. doi: 10.1038/sj.ijo.0800443. [DOI] [PubMed] [Google Scholar]
- Lafay L, Vray M, Boute D, Basdevant A. Food and nutritional data for a population from northern France: the Fleurbaix Laventie Ville Sante (FLVS) Study. Rev Epidemiol Sante Publique. 1998;46:263–75. [PubMed] [Google Scholar]
- Lietz G, Barton KL, Longbottom PJ, Anderson AS. Can the EPIC food-frequency questionnaire be used in adolescent populations? Public Health Nutr. 2002;5:783–9. doi: 10.1079/PHN2002344. [DOI] [PubMed] [Google Scholar]
- Livingstone MB, Robson PJ. Measurement of dietary intake in children. Proc Nutr Soc. 2000;59:279–93. doi: 10.1017/s0029665100000318. [DOI] [PubMed] [Google Scholar]
- Malekshah AF, Kimiagar M, Saadatian-Elahi M, Pourshams A, Nouraie M, Goglani G, et al. Validity and reliability of a new food frequency questionnaire compared to 24 h recalls and biochemical measurements: pilot phase of Golestan cohort study of esophageal cancer. Eur J Clin Nutr. 2006;60:971–7. doi: 10.1038/sj.ejcn.1602407. [DOI] [PubMed] [Google Scholar]
- Margetts, Nelson . Design and concepts in Nutritional Epidemiology. Oxford University Press; 1997. [Google Scholar]
- Martin-Moreno JM, Boyle P, Gorgojo L, Maisonneuve P, Fernandez-Rodriguez JC, Salvini S, et al. Development and validation of a food frequency questionnaire in Spain. Int J Epidemiol. 1993;22:512–9. doi: 10.1093/ije/22.3.512. [DOI] [PubMed] [Google Scholar]
- McNaughton SA, Marks GC, Gaffney P, Williams G, Green A. Validation of a food-frequency questionnaire assessment of carotenoid and vitamin E intake using weighed food records and plasma biomarkers: the method of triads model. Eur J Clin Nutr. 2005;59:211–8. doi: 10.1038/sj.ejcn.1602060. [DOI] [PubMed] [Google Scholar]
- Ocke MC, Bueno-de-Mesquita HB, Goddijn HE, Jansen A, Pols MA, van Staveren WA, et al. The Dutch EPIC food frequency questionnaire. I. Description of the questionnaire, and relative validity and reproducibility for food groups. Int J Epidemiol. 1997;26(Suppl 1):S37–48. doi: 10.1093/ije/26.suppl_1.s37. [DOI] [PubMed] [Google Scholar]
- Ocke MC, Bueno-de-Mesquita HB, Pols MA, Smit HA, van Staveren WA, Kromhout D. The Dutch EPIC food frequency questionnaire. II. Relative validity and reproducibility for nutrients. Int J Epidemiol. 1997;26(Suppl 1):S49–58. doi: 10.1093/ije/26.suppl_1.s49. [DOI] [PubMed] [Google Scholar]
- Paul AA, Southgate DAT. McCance RA, Widdowson’s The Composition of Foods. London: HMSO; 1978. [Google Scholar]
- Pietinen P, Hartman AM, Haapa E, Rasanen L, Haapakoski J, Palmgren J, et al. Reproducibility and validity of dietary assessment instruments. I. A self-administered food use questionnaire with a portion size picture booklet. Am J Epidemiol. 1988;128:655–66. doi: 10.1093/oxfordjournals.aje.a115013. [DOI] [PubMed] [Google Scholar]
- Pietinen P, Hartman AM, Haapa E, Rasanen L, Haapakoski J, Palmgren J, et al. Reproducibility and validity of dietary assessment instruments. II. A qualitative food frequency questionnaire. Am J Epidemiol. 1988;128:667–76. doi: 10.1093/oxfordjournals.aje.a115014. [DOI] [PubMed] [Google Scholar]
- Rimm EB, Giovannucci EL, Stampfer MJ, Colditz GA, Litin LB, Willett WC. Reproducibility and validity of an expanded self-administered semiquantitative food frequency questionnaire among male health professionals . Am J Epidemiol. 1992;135:1114–26. doi: 10.1093/oxfordjournals.aje.a116211. discussion 1127–36. [DOI] [PubMed] [Google Scholar]
- Rockett HR, Wolf AM, Colditz GA. Development and reproducibility of a food frequency questionnaire to assess diets of older children and adolescents. J Am Diet Assoc. 1995;95:336–40. doi: 10.1016/S0002-8223(95)00086-0. [DOI] [PubMed] [Google Scholar]
- Rodriguez MM, Mendez H, Torun B, Schroeder D, Stein AD. Validation of a semi-quantitative food-frequency questionnaire for use among adults in Guatemala. Public Health Nutr. 2002;5:691–9. doi: 10.1079/PHN2002333. [DOI] [PubMed] [Google Scholar]
- Rosner B, Willett WC. Interval estimates for correlation coefficients corrected for within-person variation: implications for study design and hypothesis testing. Am J Epidemiol. 1988;127:377–86. doi: 10.1093/oxfordjournals.aje.a114811. [DOI] [PubMed] [Google Scholar]
- Schofield WN. Predicting basal metabolic rate, new standards and review of previous work. Hum Nutr Clin Nutr. 1985;39(Suppl 1):5–41. [PubMed] [Google Scholar]
- Shu XO, Yang G, Jin F, Liu D, Kushi L, Wen W, et al. Validity and reproducibility of the food frequency questionnaire used in the Shanghai Women’s Health Study. Eur J Clin Nutr. 2004;58:17–23. doi: 10.1038/sj.ejcn.1601738. [DOI] [PubMed] [Google Scholar]
- Stram DO, Longnecker MP, Shames L, Kolonel LN, Wilkens LR, Pike MC, et al. Cost-efficient design of a diet validation study. Am J Epidemiol. 1995;142:353–62. doi: 10.1093/oxfordjournals.aje.a117641. [DOI] [PubMed] [Google Scholar]
- van Liere MJ, Lucas F, Clavel F, Slimani N, Villeminot S. Relative validity and reproducibility of a French dietary history questionnaire. Int J Epidemiol. 1997;26(Suppl 1):S128–36. doi: 10.1093/ije/26.suppl_1.s128. [DOI] [PMC free article] [PubMed] [Google Scholar]
- Vereecken CA, Maes L. A Belgian study on the reliability and relative validity of the Health Behaviour in School-Aged Children food-frequency questionnaire. Public Health Nutr. 2003;6:581–8. doi: 10.1079/phn2003466. [DOI] [PubMed] [Google Scholar]
- Verkleij-Hagoort AC, de Vries JH, Stegers MP, Lindemans J, Ursem NT, Steegers-Theunissen RP. Validation of the assessment of Mate and vitamin B(12) intake in women of reproductive age: the method of triads. Eur J Clin Nutr. 2006 doi: 10.1038/sj.ejcn.1602581. [DOI] [PubMed] [Google Scholar]
- Willett W. Nutritional Epidemiology. New York: Oxford University Press; 1998. [Google Scholar]
- Willett W, Stampfer MJ. Total energy intake: implications for epidemiologic analyses. Am J Epidemiol. 1986;124:17–27. doi: 10.1093/oxfordjournals.aje.a114366. [DOI] [PubMed] [Google Scholar]
- World Health Organisation. Energy and Protein Requirements. Geneva: WHO; 1985. [Google Scholar]