Abstract
We report the use of SIMS imaging to quantify the relative difference in the amount of lipid between two sections, the plasma membrane and the cytoplasm, of single cells from two different populations. Cells were each labeled with lipophillic dyes, frozen, fractured and analyzed in a ToF-SIMS mass spectrometer equipped with a 40 keV C60+ ion source. In addition to identifying cells from separate populations, the lipophilic dyes can be used as a marker for the outer leaflet of the cell membrane and therefore as a depth finder. Here, we show that it is possible to compare the amount of lipids with particular headgroups in the cell membrane of a treated cell to the membrane of a control cell. Following erosion of the cell membranes, the amount of the two specific lipid head groups in the cytoplasm of the treated cell can be compared to those lipids in a control cell. Here we take the first step in this experimental design and display the ability to analyze multiple sections of frozen cells following a single fracture.
Keywords: Single cell, cluster, C60, SIMS
1. Introduction
Chemical measurements at the single cell level provide fundamental information about complicated biological processes. We have recently developed a protocol for making relative quantitative measurements of cholesterol in the plasma membrane using time-of-flight secondary ion mass spectrometry (ToF-SIMS) in imaging mode[1]. This protocol is also applicable to other lipids. The measurements are made by comparing the secondary ion intensity of the lipid of interest from both a control and a treated cell. Each cell type is labeled with a lipophillic dye so that positive identification can be made. The labels used are cationic carbocyanine dyes, which give an intense SIMS signal from their respective protonated molecular ions when analyzed in positive SIMS mode[2]. In addition to being strong SIMS ions, these dyes do not appreciably enter into the inner leaflet for several hours[3]. This means that they also identify the outer leaflet of the membrane. This has been utilized to ensure that similar cell surfaces are being compared. The cells are imaged in a shared field of view, and the ion intensity from each cell is compared using a single line scan across both cells. Line scans are done for both the molecule of interest and a ubiquitous hydrocarbon ion, which is used to normalize any fluctuations in intensity due to local matrix effects[4, 5].
Relative quantification has been achieved for the plasma membrane[1], but has not yet been employed in the quantification of lipids contained in the cytoplasm. The ability to measure the lipids in both the membrane and the cytoplasm will prove to be very useful for studying cells which have been incubated with exogenous agents. Incubating PC 12 cells with specific lipids affects the characteristics of stimulated exocytosis, presumably by increasing the amount of that lipid in the cell[6]. Quantification of the lipid increase in the membrane and the cytoplasm following lipid incubation will aid in the understanding of the observed changes in cellular physiology.
This type of measurement can be made in the cytoplasm by using a cluster ion projectile to erode the plasma membrane, exposing molecularly intact material from the bulk of the cell for SIMS analysis. There are examples of three-dimensional molecular SIMS images[7, 8], and several biological molecules including water, which have been shown to retain integrity following ion doses above the static limit[9, 10]. Combining molecular depth profiling with the protocol for relative quantification literally adds another dimension to this single cell chemical measurement. Comparative chemical information from multiple sections of single cells will prove to be a powerful tool for understanding how cells interact with their environment.
2. Experimental
SIMS images were acquired using a ToF-SIMS mass spectrometer equipped with a liquid nitrogen-cooled sample stage which has been described elsewhere[11]. The instrument utilizes 40 keV C60+ ion source (Ionoptika, LTD.). The pulsed primary ion source was operated at an anode voltage of 40 kV angled at 40° to the sample. The beam was focused to approximately 1 μm in diameter, and delivered 10 pA of current in 50 ns pulses. Images were acquired by rastering the pulsed primary ion beam across the sample region and collecting a mass spectrum for each pixel in the image over a 100 μm × 100 μm field of view. The cell membranes were eroded with an ion dose of about 1.5 × 10¹³ C60+/cm2 over a 240 μm × 240 μm field of view. Using imaging software written in-house, molecule-specific images were created by selecting a mass peak of interest from the total ion mass spectrum and plotting the intensity of this mass at each pixel in the image. Intensity line scans were used to make the relative measurements of the cells in each image. Line scans were made 20 pixels wide, approximately 20-25% of the width of each cell. The lipid signal of interest was normalized to the signal of a ubiquitous hydrocarbon fragment (69 m/z) across a length of the line determined to represent a single cell[1].
JJ74 cells were cultured on sterile polystyrene cell culture flasks and incubated at 37° C and 5% CO2. Two flasks containing cells were treated with 25 μg of Dye/mL of serum-free RPMI (Roswell Park Memorial Institute) media (Invitrogen, Carlsbad CA) for 1 h, one flask was treated with 1,1’-dioctadecyl-3,3,3’,3’-tetramethylindocarbocyanine (DiI) and the other was treated with 1,1’-dioctadecyl-3,3,3’,3’-tetramethylindodicarbocyanine (DiD). The cells were then rinsed 5 times in the serum-free media dislodged from their respective flasks and mix together in a tube and vortexed for 1 min at 2000 rpm. The combined cell suspension was then put into a Petri dish containing 5 × 5 mm silicon wafers (Ted Pella, Redding, CA). The cells were allowed to settle onto the Si wafers for about 30 min, after that a Si shard was placed on top of the sample and it was plunge frozen in liquid ethane. The frozen sample was fractured in vacuum using the freeze fracture procedure describe elsewhere[12].
3. Results and Discussion
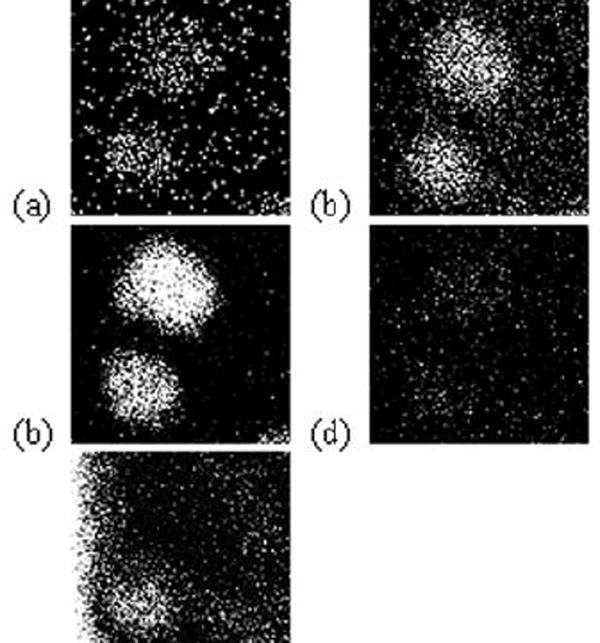
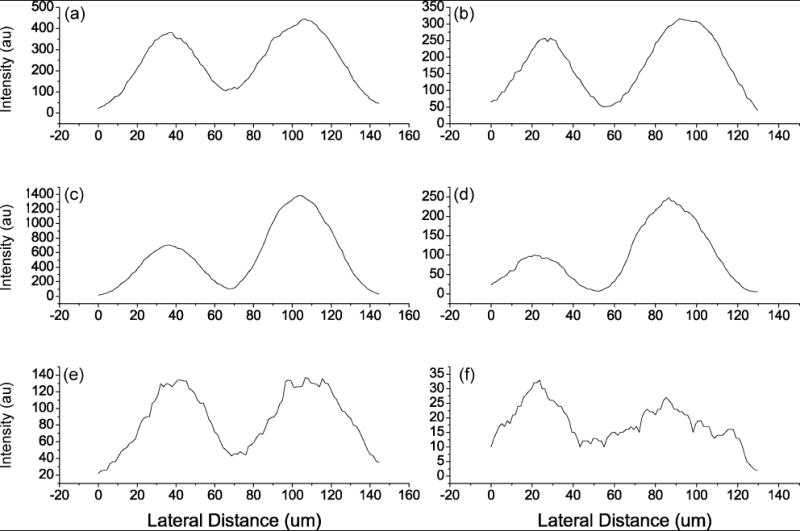
A ToF-SIMS image of two freeze-fractured macrophage cells is shown in Fig. 1. Both protonated molecular ions for DiI (m/z 834) and DiD (m/z 860) are shown in Fig. 1a, a ubiquitous hydrocarbon fragment (m/z 69; C5H9+) is shown in Fig 1b, the phosphatidylcholine (PC) head group fragment (m/z 184; C5H15NPO4+) is shown in Fig 1c, and the headgroup fragment for the phosphatidylethanoamine (PE) head group fragment (m/z 142; C2H9NPO4+) is shown in Fig 1d. The integrated ion intensity of PE only differs by 3 % between the DiI and the DiD labeled cells. This was expected because the lipophillic dyes do not perturb the relative amount of lipid from cell to cell. The intensity of m/z 184 of the DiD labeled cell is almost twice (165 %) as intense as the DiI labeled cell. Conversely, the K+ level in the DiI labeled cell is higher than the K+ level in the DiD labeled cell(fitg. 1e). This observation indicates that the DiI labeled cell was most likely damaged before analysis either as a result of sample handling or cell death prior to freeze fracture. This artifact may account for the discrepancy between the PC intensities; however it is not clear why this did not affect PE intensities. The DiI and DiD images unequivocally reveal that each cell originates from a separate population. This information is important in order to compare the response of different populations to different perturbations.
Fig. 1.

Positive ion molecular SIMS images of two separately dyed J774 cells. (a) Composite image for DiD (m/z = 860, top) and DiI (m/z = 834, bottom). (b) Sims image for C5H9+ (m/z = 69). (c) SIMS image of PC head group ion (m/z = 184). (d) SIMS image of PE head group ion (m/z =142) (e) SIMS image of K (m/z = 39).
The cytoplasm of the cell was exposed by rastering the dc, 40 keV C60+ beam over a 240 μm2 area. The primary aim of this procedure is to remove the plasma membrane without etching though the entire cell. Fortunately the plasma membrane is quite thin (< 10 nm) relative to the bulk of the cell, which is several μm thick. Although the sputtering yields and molecular densities for material in these cells is unknown, values for a typical organic solid were used to estimate the sputtered depth. The sputter yield and molecular density used were 500 molecules/C60+ and 1 × 10²¹ molecules/cm3 respectively[10], this corresponds to the removal of about 80 nm of the surface.
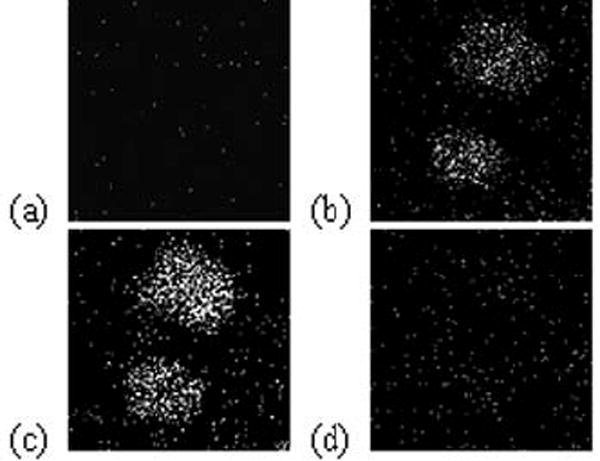
SIMS images of the same molecular and fragment ions are shown in fig. 2 after the dye signal has been removed by C60+ erosion. To be sure that these dyes would withstand the ion dose required to remove the plasma membrane, an electrosprayed film of DiI was subjected to depth profiling. It was found that there was minimal loss of signal at doses required to sputter 10 nm of lipid. Therefore DiI can be effectively used a marker for the plasma membrane.
Fig. 2.

Positive ion molecular SIMS images of two separately dyed J774 cells following sputtering. (a) Composite image for DiD (m/z = 860, top) and DiI (m/z = 834, bottom). (b) Sims image for C5H9+ (m/z = 69). (c) SIMS image of PC head group ion (m/z = 184). (d) SIMS image of PE head group ion (m/z =142).
After erosion with a dose of 1.5 × 10¹³ C60+/cm2, the ion intensities of the images are lower than the initial images but are all still measurable. Line scans for each image except for the dye images are shown in fig. 3. Line scans for m/z 69 before and after sputtering are shown in fig. 3a,b, respectively. There is little difference in ion intensity between the two cells both before and after sputtering. It is expected that each cell should have a similar amount of lipid material in the cytoplasm. The same comparison is made for m/z 184 in fig. 3c,d. The signal is stronger in the DiD labeled cell for both the initial line scan (165 %) and in the line scan done after sputtering (200 %). This is attributed to the cell damage that occurred prior to analysis. Line scans for m/z 142 before (Fig. 3e) and after (Fig 3f) sputtering show that PE compares well in the membrane, but in the cytoplasm, the PE was measured to be twice as abundant in the DiI labeled cell. This may reflect a difference in the lipid composition in the cytoplasm of these cells but the low signal and the damage to the DiI labeled cell make it difficult to conclude that the difference is significant. However, PE is notoriously difficult to localize in single cells and the fact that there is still a measurable amount of signal after sputtering is quite promising.
Fig. 3.

Intensity line scans across SIMS images of DiI (Left) and DiD (Right) labelled cells. Line scan for images of C5H9+ (m/z = 69) before (a) and after (b) sputtering. Line scans for images of PC head group ion (m/z = 184) before (c) and after sputtering (d). Line scans for images of the PE head group ion (m/z =142) before (e) and after sputtering (f).
4. Conclusions
Here we show that not only is it possible to quantify lipids in the plasma membrane but that it is also possible, by taking advantage of the unique properties of the C60+ ion source, to probe the composition of lipids in the cytoplasm. In combination with the labeling strategies, it should now be possible to make direct comparisons between different groups of cells exposed to different external stimuli. Moreover as these measurements become more refined, it is anticipated that it will be straightforward to create full 3-dimensional structures, which characterize the entire cell body.
Acknowledgments
The authors acknowledge The National Institutes of Health for financial support of this research under grant # EB002016-13.
Footnotes
Publisher's Disclaimer: This is a PDF file of an unedited manuscript that has been accepted for publication. As a service to our customers we are providing this early version of the manuscript. The manuscript will undergo copyediting, typesetting, and review of the resulting proof before it is published in its final citable form. Please note that during the production process errors may be discovered which could affect the content, and all legal disclaimers that apply to the journal pertain.
References
- 1.Ostrowski SG, Kurczy ME, Roddy TP, Winograd N, Ewing AG. Anal Chem. 2007;79:3554. doi: 10.1021/ac061825f. [DOI] [PMC free article] [PubMed] [Google Scholar]
- 2.Adriaensen L, Vangaever F, Gijbels R. Applied Surface Science. 2004;231-232:348. [Google Scholar]
- 3.Wolf DE. Biochem. 1985;24:582. doi: 10.1021/bi00324a006. [DOI] [PubMed] [Google Scholar]
- 4.Monroe EB, Jurchen JC, Lee J, Rubakhin SS, Sweedler JV. J Am Chem Soc. 2005;127:12152. doi: 10.1021/ja051223y. [DOI] [PubMed] [Google Scholar]
- 5.Ostrowski SG, Van Bell CT, Winograd N, Ewing AG. Science. 2004;305:71. doi: 10.1126/science.1099791. [DOI] [PMC free article] [PubMed] [Google Scholar]
- 6.Uchiyama Y, Maxson MM, Sawada T, Nakano A, Ewing AG. Brain Research. 2007;1151:46. doi: 10.1016/j.brainres.2007.03.012. [DOI] [PMC free article] [PubMed] [Google Scholar]
- 7.Fletcher JS, Lockyer NP, Vaidyanathan S, Vickerman JC. Anal Chem. 2007;79:2199. doi: 10.1021/ac061370u. [DOI] [PubMed] [Google Scholar]
- 8.Wucher A, Cheng J, Winograd N. Anal Chem. 2007 doi: 10.1021/ac070692a. In Press. [DOI] [PubMed] [Google Scholar]
- 9.Szakal C, Kozole J, Winograd N. Appl Surf Sci. 2006;252:6526. [Google Scholar]
- 10.Cheng J, Winograd N. Analytical Chemistry. 2005;77:3651. doi: 10.1021/ac048131w. [DOI] [PubMed] [Google Scholar]
- 11.Braun RM, Blenkinsopp P, Mullock SJ, Corlett C, Willey KF, Vickerman JC, Winograd N. Rapid Commun in Mass Sp. 1998;12:1246. doi: 10.1002/(SICI)1097-0231(19980930)12:18<1246::AID-RCM316>3.0.CO;2-C. [DOI] [PubMed] [Google Scholar]
- 12.Cannon DM, Pacholski ML, Winograd N, Ewing AG. J Am Chem Soc. 2000;122:603. [Google Scholar]


