

Abstract
Infections with the malaria parasite Plasmodium falciparum result in more than one million deaths each year worldwide1. The evolutionary history and genetic variation of P. falciparum is of critical importance to the understanding of the evolution of drug resistance, the identification of potential vaccine candidates and an appreciation of the effect of parasite variation upon prevalence and severity of malaria in humans. Most studies of natural variation in P. falciparum have been either in depth over small genomic regions (up to the size of a small chromosome2) or genome-wide but only at low resolution3. In an effort to complement these studies with genome-wide data, we undertook shotgun sequencing of a Ghanaian clinical isolate (5x coverage), the IT laboratory isolate (1x) and the chimpanzee parasite P. reichenowi (2x). These genomes were compared to the fully sequenced clone4. We describe the most salient features of P. falciparum polymorphism and adaptive evolution with relation to gene function, transcript and protein expression and cellular localisation. This analysis reveals the primary evolutionary changes that have occurred since the P. falciparum – P. reichenowi speciation, and those that are occurring within P. falciparum.
In this study we compare the completely sequenced genome of the P. falciparum laboratory-cultured clone 3D7 (Ref 4) to whole genome sequence data from the chimpanzee malaria parasite P. reichenowi, the closest relative of P. falciparum; a non-cultured clinical P. falciparum isolate, directly isolated from a patient infected in Ghana (PFCLIN); and a P. falciparum laboratory model, clone IT (IT). Sequence data were produced by whole genome shotgun sequencing to five-, two- and one-fold coverage for PFCLIN, P. reichenowi and IT, respectively. We used SSAHA2 (Ref 5) to align sequence reads to the reference P. falciparum genome 3D7. The fractions of the genome that could be reliably analysed (see methods) were; 74% using PFCLIN, 25% with IT and 42% with P. reichenowi (excluding the majority of var genes). Single nucleotide differences (SNPs or fixed substitutions) and indels were identified from these alignments based on standard calling strategies and additional filters. We identified 27,169 non-redundant SNPs between 3D7, PFCLIN and IT (nucleotide diversity: 3d7 vs. PFCLIN π = 0.00131; 3D7 and IT π = 0.0011). We called 216,619 fixed differences between 3D7 and P. reichenowi (divergence, d = 0.0203). Based on coverage by multiple reads, the false discovery rate for both SNPs and fixed differences calls is estimated to be 10% (90% of the calls are correct – see methods). We also identified many insertions/deletion events (indels) (see Table 1). This data indicates that there is substantial variation in P. falciparum genomes and that the divergence between P. reichenowi and P. falciparum is approximately 10-fold greater than the within-species polymorphism.
Table 1.
Comparative genome data
| A. Alignment and SNP data | |||
| PFCLIN | IT | P. reichenowi | |
| Reads aligned | 121,810 | 17,753 | 33,699 |
| Unique coverage (% of ref) | 17,336,871 (74%) | 5,754,163 (25%) | 9,818,236 (42%) |
| SNPsa | 22,735 | 6,415 | 216,619 |
| Indelsa | 27,478 | 6,461 | 37,258 |
| Complex differencesa | 3,736 | 901 | 19,964 |
| B. Rates of SNPs and fixed differencesb | |||
| Region | PFCLIN | IT | P. reichenowi |
| RNA genes | 4 (0.75) | 2 (0.52) | 72 (14.44) |
| Intergenic regions | 7,327 (1.21) | 1,818 (0.96) | 66,687 (20.28) |
| Exons | 12,730 (1.27) | 3,993 (1.16) | 132,509 (23.59) |
| Synonymous sites | 3,659 (2.21) | 1,243 (2.14) | 59,907 (71.11) |
| Non-synonymous sites | 9,071 (1.08) | 2,750 (0.96) | 72,602 (15.21) |
| dN/dSc | 0.49 | 0.45 | 0.21 |
| FFD sitesd | 1031 (1.49) | 321 (1.22) | 22,160 (55.20) |
| Introns | 2,678 (2.49) | 603 (1.76) | 17,421 (26.96) |
| Repeats | 1,918 (4.40) | 527 (3.82) | 6,489 (26.57) |
| Total | 22,735 (1.31) | 6,415 (1.11) | 216,619 (22.06) |
Here SNP counts refer to numbers of single nucleotide polymorphisms or fixed differences (derived from SSAHA SNP and multiple SNP POLY calls, see methods), Indels are insertion-deletion events and Complex differences are SSAHA-identified differences that include both single nucleotide differences and indels. Complex differences were not included in our analysis.
Number of total differences includes SNP and multiple-SNP POLYs (see methods). Data shown is total number of differences (rate/kb of read coverage).
Genome-wide dN/dS from all complete codons with read coverage.
Four-fold degenerate sites. Rates of fixed differences and SNPs were higher in G/C FFD sites than A/T FFD sites (PFCLIN rates; A/T 0.91/kb, G/C 2.82/kb, P. reichenowi rates; A/T 34/kb, G/C 137/kb).
In regions where the prevalence of malaria is high, many individuals harbour multiple P. falciparum genotypes that survive at low parasitemia during asymptomatic infection6. Clinical episodes of malaria are caused by a new infection, the majority of which are of a single genotype. To estimate the multiplicity of infection in the patient from whom PFCLIN was isolated, we estimated heterozygosity based on overlapping high quality reads. Approximately 7-10% of the SNP sites called between 3D7 and PFCLIN have good support for both allelic states in PFCLIN, while this is only about 5% for the IT, which is expected to be monomorphic. By subtracting the noise inferred from IT we estimate that about 2-5% of the PFCLIN sample (genome-wide) corresponds to other genotypes.
Culture-adapted P. falciparum strains may be imperfect models for the genome due to extensive accumulation or loss of sequences in culture. We investigated whether this had occurred in the culture-adapted 3D7 isolate by examining the indel events we detected in the PFCLIN and P. reichenowi comparisons, neither of which has been adapted to in vitro culture. Large numbers of small indels were identified in this analysis (Table 1). In both comparisons we observed an excess of “insertions” in 3D7 (ancestral state not known), indicating that the 3D7 isolate had accumulated DNA in culture at the rate of approximately +1nt/kb (see Supplementary Methods). Indels were underrepresented in coding sequences (0.07 indels/kb, compared to 3.75 indels/kb in other regions), without any bias towards gain or loss of DNA relative to the reference 3D7 and frequently multiples of three, thus maintaining open reading frames. This study excludes much of the subtelomeric regions that have been the focus of prior observations of sequence loss/gain7,8, and did not detect any indels greater than ∼100 nt long due to the short length of read alignments. It is therefore possible that accumulation of sequences in interstitial regions occurs simultaneously with loss and rearrangement events towards the chromosome ends7,8.
To estimate the selective effects acting on individual genes we calculated the ratio of non-synonymous to synonymous substitution rates (dN/dS) for the three pair-wise comparisons for each gene with at least 100 codons of read coverage (n = 4,686, 2,437 and 3,674 genes for PFCLIN, IT and P. reichenowi respectively). This produced 762, 207, and 3024 genes for which dN/dS estimates could be calculated for PFCLIN, IT and P. reichenowi. All dN/dS distributions were skewed toward zero (median = 0.27, 0.30 and 0.17, for PFCLIN, IT, and P. reichenowi), as expected, since most genes are under purifying selection (Fig. S1). However, some genes exhibited elevated dN/dS values (see Supplementary Table 1) that in some cases were above 1. Many genes that are under positive selection may have dN/dS values below 1 if only a fraction of the amino acids are under positive selection9. We also performed McDonald-Kreitman tests (MK test10) using coding sequences with read coverage for all three P. falciparum isolates (3D7, PFCLIN and IT) and P. reichenowi (see methods). MK tests indicated categories of genes that exhibited either an excess of divergence (likely explained by directional selection) or an excess of polymorphism (likely diversifying selection) (see Supplementary Table 1) in the isolates we examined.
Studies of other organisms have shown the evolutionary rates (of protein-coding genes, dN/dS) are often correlated with mRNA and protein expression levels11. We used P. falciparum expression studies to look for similar correlations. Both total protein mass spectrometry counts (corrected for protein length, see methods)12, and total transcript levels13 were highly significantly correlated with P. reichenowi and PFCLIN dN/dS estimates (Fig. 1a,b, Figure S2). In all cases rapidly evolving genes were expressed at low levels, and abundantly expressed genes were conserved during evolution. The duration of gene expression (measured by the number of developmental stages in which a gene is expressed, data from Ref 13) was also negatively correlated with the 3D7-P. reichenowi dN/dS values (Spearman rank correlations, protein r = −0.24, P < 2.2×10⁻¹⁶, transcript r = −0.22, P < 2.2×10⁻¹⁶) (Fig. 2a, b). These observations were very robust even after correction for total expression effects (Supplementary Methods) or with the use of different expression and genetic variation data sets (Fig. S2). Although the incomplete coverage and relatively high SNP false detection rate preclude detailed analysis of individual genes, these results indicate that global analysis of our dN/dS distributions provides biologically meaningful information. We also observed heterogeneity between dN/dS estimates of genes that were primarily expressed primarily in a single developmental stage of the Plasmodium life cycle (Fig. 2c). Therefore, highly specialized genes in the Plasmodium genome are more likely to undergo accelerated selective processes either due to relaxed constraint or due to directional selection.
Figure 1. Evolutionary rates correlate with total gene expression levels.


a. Scatter plot of PFCLIN dN/dS and total protein expression. Because longer proteins would be expected to be detected more frequently in mass spectrometry analysis12 total protein measures are corrected for protein length by dividing by predicted coding length of gene (mass spec. counts/CDS length plotted on x axis). The PFCLIN dN/dS correlates with corrected total protein levels from all developmental stages12 (Spearman rank r = −0.16, P = 5.6×10⁻⁴). Some data points with x values > 0.1 are not shown on this plot. PFCLIN dN/dS estimates were also correlated with total RNA expression levels (Fig S2).
b. Scatter plot of P. reichenowi dN/dS and total transcript expression. The P. reichenowi dN/dS correlates with total transcript from all developmental stages13 (Spearman rank correlation, r = −0.22, P < 2×10⁻¹⁶). One data point with total transcript > 30,000 is not shown on this plot. P. reichenowi dN/dS estimates were also correlated with total protein levels (Fig S2).
Figure 2. Evolutionary rates vary with developmental stage.
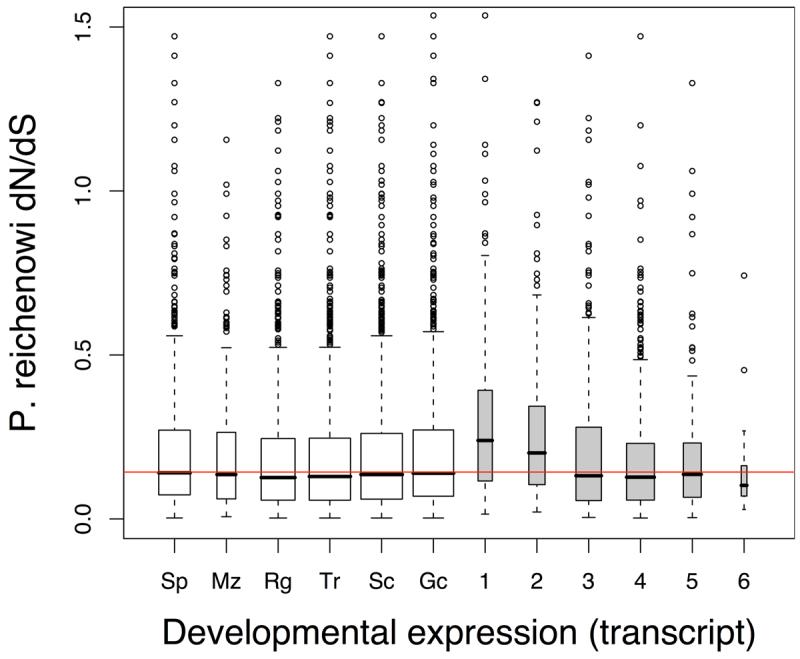
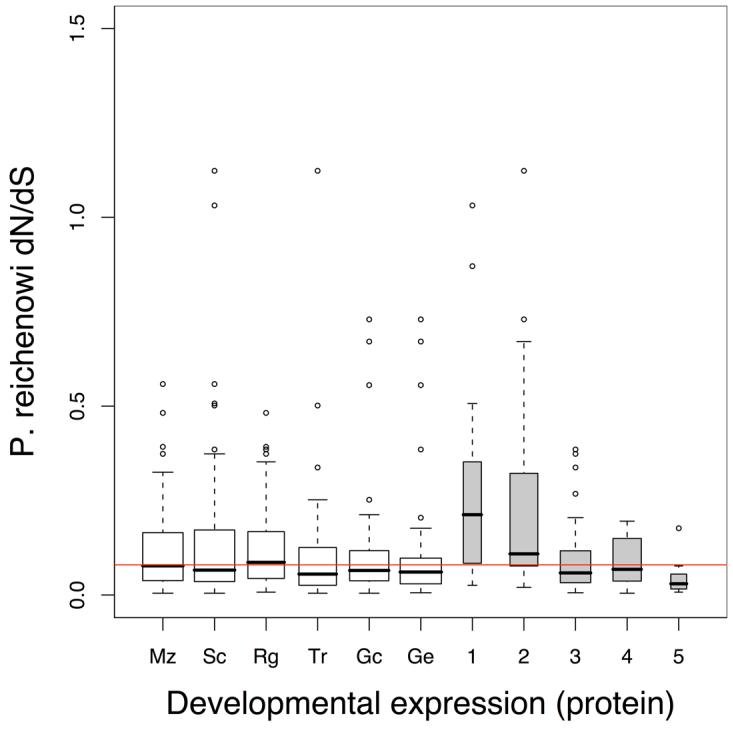
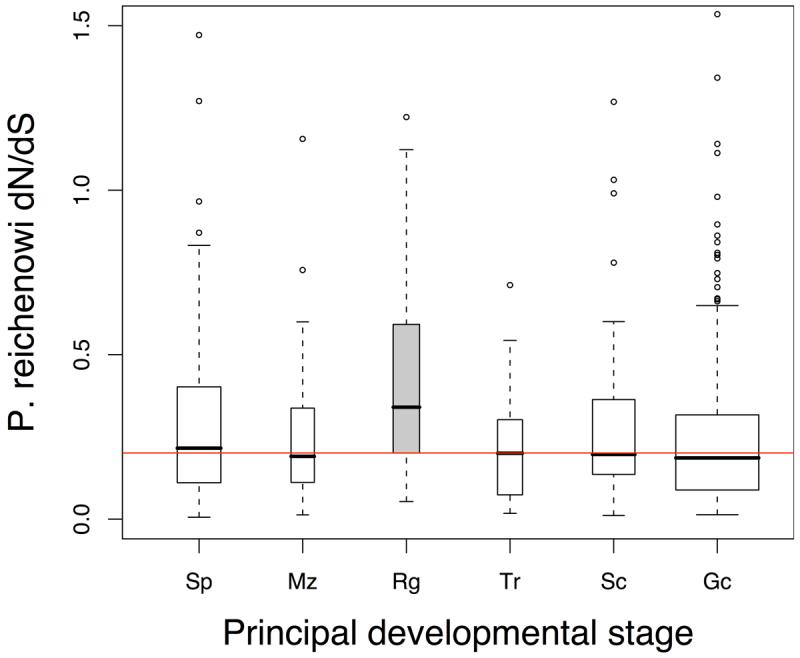
P. reichenowi dN/dS distributions of genes grouped by developmental expression. Red horizontal lines indicate the median dN/dS of all plotted genes. Box middle line upper and lower limits indicate the median, upper and lower quartiles. Box widths are proportional to group size. Developmental stages include sporozoite (Sp), merozoite (Mz), schizont (Sc), ring stage (Rg), trophozoite (Tr) and Gametocyte (Gc) and gamete stage (Ge).
a, b. Developmental expression Genes grouped by both developmental stage and the number of developmental stages they are expressed in (1-6). Transcript expression data13 (a) or protein expression data13 (b) was used to group genes that were ‘present’ in the various stages (≥10% of the genes expression in the stage concerned, see Supplementary Methods). dN/dS distributions of developmental stage groups, do not differ from one another (Kruskal-Wallis, transcript P = 0.11, protein P = 0.35) (open boxes), but the dN/dS distributions duration of expression groups (number of stages) do differ significantly (Kruskal-Wallis, transcript P = 5.05×10⁻¹⁵, protein P = 2.6×10⁻⁴) (grey boxes).
c. Principal developmental stage (transcript data) Genes that were primarily present in one developmental stage (≥50% of the genes expression, data from13) were grouped. Ring-stage transcripts have the highest P. reichenowi dN/dS distribution (Mann-Whitney, P = 2.2×10⁻³). Consistent relative differences in evolutionary rates between stage-specific genes were observed with protein data13, and another microarray study25 (Figure S3).
The events that occur between the invasion of the host erythrocyte to its eventual rupture to release daughter merozoites determine the clinical manifestations of malaria. We used a detailed study of the intra-erythrocytic developmental cycle (IDC)14 to examine this stage in more detail. In that study it was found that ∼80% of the nuclear-encoded IDC-expressed genes could be clustered into 13 groups that were both co-expressed, and were functionally related. When we compared the dN/dS values split in these clusters, we found that two of these clusters, “merozoite invasion” and “early ring transcripts”, showed significantly elevated rates of nonsynonymous change (high dN/dS) in the 3D7 - P. reichenowi comparison (Fig. 3a). MK tests indicated that both these clusters contained significant excess of nonsynonymous polymorphisms in P. falciparum relative to fixed differences (merozoite NI = 2.5, Fisher's exact test P = 0.009; ring NI = 10.4, P = 1.59×10⁻⁹), indicating that these proteins were also highly variable within P. falciparum isolates.
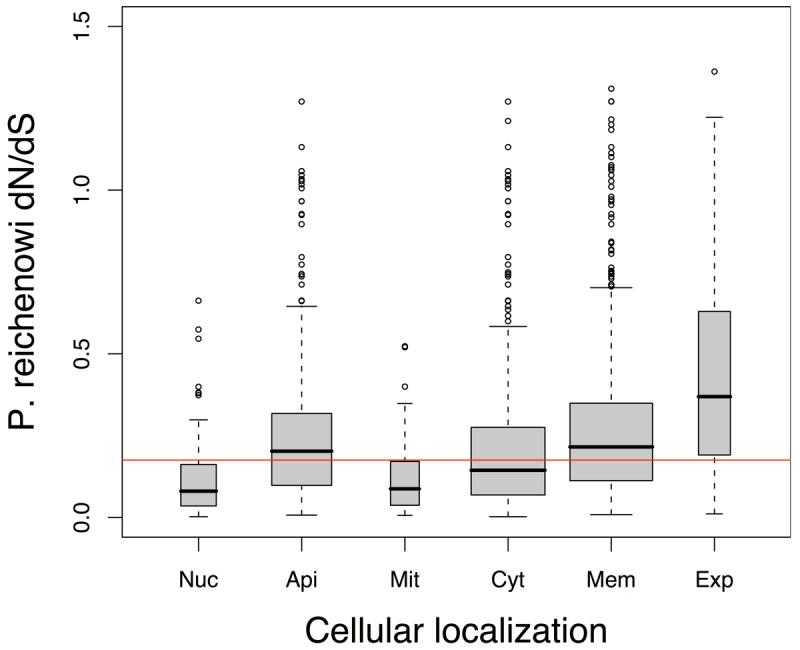
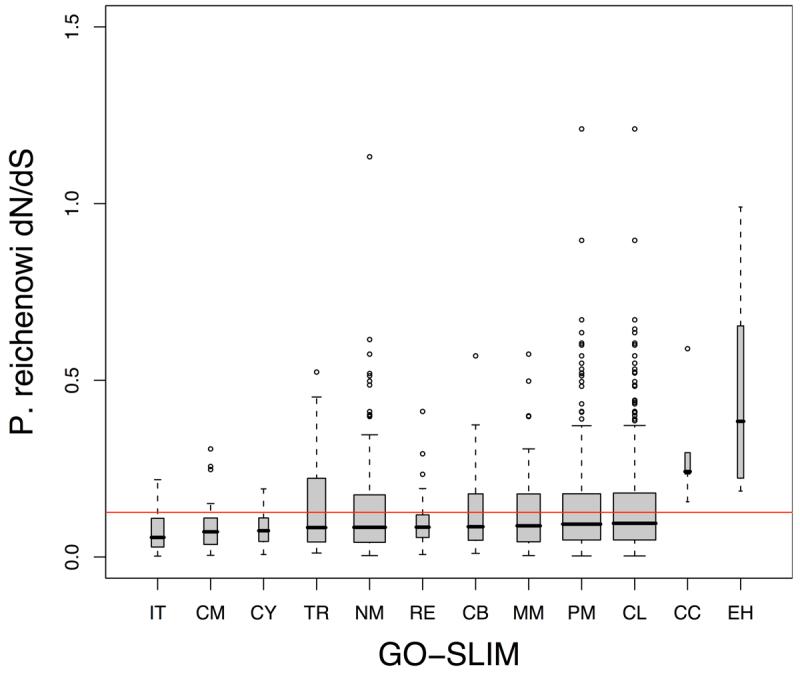
Figure 3. Evolutionary rate in the context of gene function.
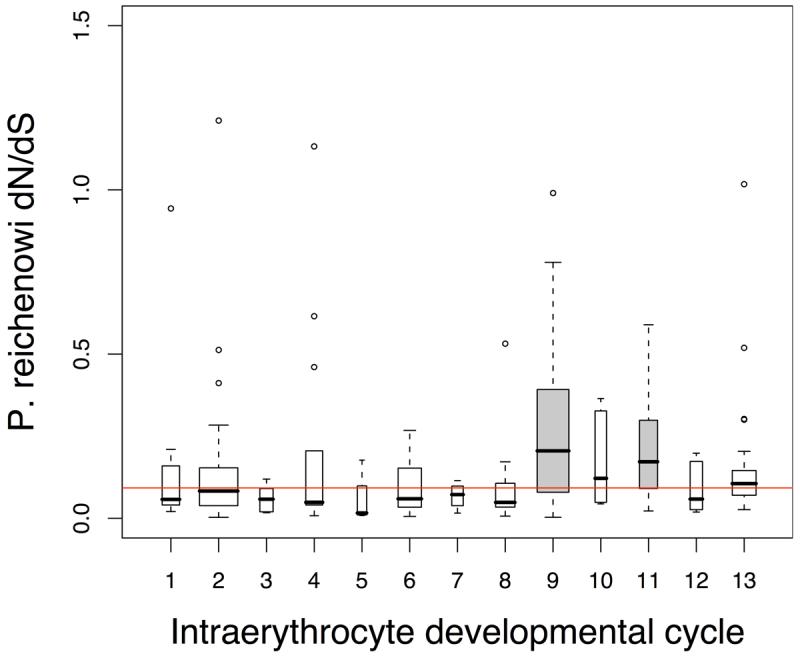
P. reichenowi dN/dS distributions of genes grouped by protein function. Plots drawn as Fig. 2.
a. Intraerythrocyte developmental cycle (IDC) Temporal and functional IDC groups14 are; transcription (1), cytoplasmic translation (2), glycolysis (3), ribonucleotide synthesis (4), deoxyribonucleotide synthesis (5), DNA replication (6), TCA cycle (7), proteosome (8), merozoite invasion (9), actin/myosin motors (10), early ring transcripts (11), mitochondria (12), organelle translation (13). Merozoite invasion (9) and early ring cluster (11) showed significantly elevated dN/dS distributions (Mann-Whitney, P = 1.7×10⁻⁵ and P = 0.024).
b. Cellular localisation Genes grouped according to Gene Ontology localisation, and predicted export motif16.
All groups had significantly different dN/dS distributions. Categories (and Mann-Whitney test P values) are; nucleus (Nuc, P < 2.2×10⁻¹⁶), apicoplast (Api, P = 0.013), mitochondria (Mit, P = 1.238×10⁻⁹), cytoplasm (Cyt, P = 7.283×10⁻⁸), membrane-spanning (Mem, P < 2.2×10⁻¹⁶), exported (Exp, P = 1.776×10⁻¹⁵).
c. Gene Ontology GO-slim categories with significantly different dN/dS distribution (compared to all genes not in category) are shown. Categories showing significantly lower dN/dS distributions were intracellular transport (IT), carbohydrate metabolism (CM), cell cycle (CY), transport (TR), nucleobase, nucleoside, nucleotide and nucleic acid metabolism (NM), regulation of cellular physiological process (RE), cell organization and biogenesis (CB), macromolecule metabolism (MM), protein metabolism (PM), cellular metabolism (CL). Cell communication (CC) and entry into host cell (EH) had significantly higher dN/dS distributions (Mann-Whitney, P = 2.0×10⁻³ and P = 0.043).
To test whether proteins that were directly interacting with host cells were under adaptive evolution we examined the evolutionary rates of genes grouped by their intracellular localisation using the cellular component aspect of the Gene Ontology (GO) classification15, and definitions of predicted exported proteins16. Proteins localised to the nucleus, cytoplasm and the mitochondria were generally conserved, while apicoplast-localised proteins, predicted membrane-spanning proteins, and predicted exported proteins had evolved significantly more rapidly (Fig. 3b). Exported and transmembrane proteins also show elevated evolutionary rates in rodent parasites17. These observations, and previous studies indicating that the strongest evidence for positive selection between human and chimpanzee is related to immunity and defense18, are consistent with the model of an ‘evolutionary arms race’ between the mammalian immune system and the exposed proteins of Plasmodium parasites. As expected given this ‘arms race’ model, genes annotated as ‘antigens’ have significantly higher dN/dS distributions from the P. reichenowi comparison (Mann-Whitney, P = 2.67×10⁻³, antigens median = 0.29, all others median = 0.17).
We also analyzed the evolutionary rates of genes with respect to their Gene Ontology (GO) biological process annotations. 2098 genes with detailed GO annotation were mapped to a cut-down version of the full ontology (GO-slim) with 19 broad categories (Supplementary Table 1). Of the 19 categories, 7 did not have significantly different P. reichenowi –3D7 dN/dS values from other GO-defined genes, 10 had significantly lower dN/dS values, mainly involved in metabolism and cell cycle (data not shown), and 2 GO-slim categories (“cell communication” and “entry into host cell” ) had significantly higher dN/dS estimates (Fig. 3c). The “cell communication” category also showed a significant excess of nonsynonymous polymorphisms with the MK test (NI = 2.8, Fisher's exact P = 7.1×10⁻³).
Collectively, our evolutionary analysis indicates that the most significant functional changes between P. falciparum and P. reichenowi have been membrane and exported proteins, and proteins involved in merozoite invasion and subsequent ring stage parasite growth. Although our data do not allow us to distinguish which lineage has undergone positive selection, adaptive changes in these functions in one or both of these species are consistent with differences in the biology of the parasites. P. falciparum produces 10 – 12 merozoites, in contrast to 2 or 3 times this number in P. falciparum19 and some data suggests that P. reichenowi is less pathogenic to chimpanzees than P. falciparum is to humans19. Both P. falciparum and P. reichenowi have a strong preference for their host species19,20, which may be due to differences in the sialic acid modifications to erythrocyte surface proteins between human and chimpanzee, which are major determinants of the invasion of Plasmodium parasites20.
Our analysis describes genome-wide patterns of variation but can also indicate specific genes of interest. The list of the genes with the highest number of nonsynonymous polymorphisms in the PFCLIN isolate is comprised largely of uncharacterised genes (Supplementary Table 1). However it also contains examples of well characterised surface antigens, such as 2 VAR-like genes (PFL0030c and PFE0040c), PfEMP2 and R45. Thus, the other members of the list may include additional uncharacterised antigens. Of these, gene PF10_0355 is particularly striking; it has the second highest total SNP number and indicating that is may be under immune selection and, like VAR genes, it contains a DBL (duffy binding like) domain. The chromosomal location of PF10_0355 contains a cluster of genes that have previously received much attention: the vaccine candidate, liver stage antigen 1 (PF10_0356) is encoded downstream and several genes encoding merozoite surface proteins are found upstream. An additional 15 genes were identified as having a significant excess of nonsynonymous polymorphisms (MK test: P < 0.05, Supplementary Table 1). These 15 genes encode for two known polymorphic antigens; surf13.1 (PF13_0074) a member of the Surfin protein family, which have been identified on the cell membrane fractions of merozoites and infected erythrocytes21, and a CSP and TRAP-related protein (CTRP, PFC0640w), a transmission-blocking vaccine candidate22. The samples of genes mentioned above highlight the usefulness of genome-wide surveys of nucleotide variation for the identification of medically important targets for vaccine and drug development.
The present analysis provides an unbiased view of natural variation in the Plasmodium falciparum genome and its divergence from P. reichenowi. This study and its companion papers23,24 are invaluable assets to our further understanding of the biology of this complex organism. The increasing efficiency of gene manipulation strategies for P. falciparum means that hypotheses about gene function derived from evolutionary data can rapidly be tested in the future. More extensive exploration of P. falciparum polymorphism will be required for fine-scale analysis of the evolution in the genome. This information, combined with accurate data on geographical origin and parasite phenotype, should allow us to understand both the complex population structure of this important pathogen, and to carry out genotype/phenotype association studies. The latter will be vital for elucidating mechanisms underlying processes such as virulence and drug resistance within human populations and is likely to lead to novel medical intervention strategies.
Supplementary Material
Acknowledgements
We thank the Pathogen Sequencing teams for producing the sequence data used in this study, Paul Horrocks and Bob Pinches for the supply of IT isolate DNA and Matias Marti for the list of PEXEL motif-containing genes. This study was funded by the Wellcome Trust through their support of the Pathogen Sequencing Unit and ETD's group at the Wellcome Trust Sanger Institute.
Methods
Methods
Detailed methods are available in Supplementary Methods.
Parasite collection and DNA extraction
The clinical parasite sample (PFCLIN) was obtained by erythrocytapheresis from a non immune woman who had recently returned from Ghana, (a detailed case report is available in Supplementary Methods). Molecular studies were approved by the Wandsworth Local Research Ethics Committee (UK). DNA was extracted from about 400 ml of enriched infected red blood cells (see Supplementary Methods). Laboratory isolate IT DNA was prepared from trophozoite stage culture of IT subclone P1B5 (Ref 26), using standard overnight proteinase K digestion followed by phenol and chloroform extractions. The P. reichenowi study was approved by the Institutional Ethics Committee according to Dutch law prior to commencement.
Sequencing
Randomly sheared DNA was sequenced from small-insert (1.4 - 5.0 kb) pUC19 clone libraries by whole genome shotgun sequencing as previously described27. From the PFCLIN, IT and P. reichenowi libraries 201,068, 36,138 and 78,442 reads were produced, respectively.
Read alignment and identification of differences
Paired shotgun clone reads were aligned to the P. falciparum 3D7 genome4 (3D7.version2.0, ftp://ftp.sanger.ac.uk/pub/pathogens/malaria2/3D7/) with SSAHA2 http://www.sanger.ac.uk/Software/analysis/SSAHA2/ (Ref 5). Only alignments that mapped to a single location on the reference genome and were opposed by their read pair were used in further analysis (single location paired reads). Single nucleotide differences (SNPs), and polynucleotide differences (POLYs, insertion/deletion events, differences of two or nucleotides within five nt of each other, and more complex polynucleotide differences) were identified from these alignments using neighbourhood quality standard28.
Data quality filters
We excluded all read alignments and difference calls (SNP/POLY) that mapped to the non-unique regions of the genome4; for each project (PFCLIN, IT, P. reichenowi) we excluded any10 kb block of the genome where the ‘uniqueness’ U = [(single location paired reads mapped to block)/(all reads mapped to the block)] ≥ 0.5.
SNP locations with multiple read coverage were used to determine the minimum base phred score for which 90% of SNP calls were validated (minimum validated score, MVS). All subsequent analysis used only SNPs and ‘multiple SNP’ POLYs with a phred score ≥ MVS or a cumulative phred score (from all reads covering the location) greater than 60 (1/106 probability of error). All indel POLYs were retained. Estimates of the total rate of genetic change, dN/dS and MK tests were calculated from a predicted variant sequence generated using SNP and multiple SNP POLYs with SSAHA2 scores ≥ MVS.
We manually scrutinised 50 SNPs called from PFCLIN over 12 genes (44124 nt in length) by examining Gap4 (v4.10b.3) aligned electrophoretograms from all sequence reads from PFCLIN covering these genes, and further reads were generated by sequencing PCR products obtained from the initial PFCLIN DNA extraction. 48 SNPs were located and verified as correct, including one heterozygous SNP. One was identified but not found to be a SNP in this alignment, one SNP was not aligned by Gap4.
Detection of heterozygous sites
Sites with ≥ 1 MVS SNP call and at least N (N ≥ 2) reads of high quality read length (See Supplementary Methods) were used to estimate the proportion of heterozygous sites. A site qualified as heterozygous if the cumulative phred score from all reads covering that site was ≥ H (where H = 60, 70 or 80) for each of two alleles. For various values of N and H, estimates of the percentages of SNP locations that were heterozygous were: IT 4% - 6%, PFCLIN 7 - 10%.
Synonymous/non-synonymous rate ratios (dN/dS)
Pair wise alignments were generated using the predicted variant sequences for each comparison (IT, PFCLIN, P. reichenowi) to the reference for each protein-coding genes with ≥ 100 codons of unique read coverage, excluding regions containing indels. dN/dS was calculated with the yn00 program of the PAML package29, using the Yang and Nielsen algorithm. Counts of the number of synonymous and non-synonymous changes in codons used the same method, except that all codons that were completely included in unique read coverage were included.
McDonald-Kreitman tests (MK tests)
We carried out MK tests according to10 using alignments as above. The neutrality index (NI) was calculated from the equation30: NI = (Pn/Ps)/(Fn/Fs); Pn nonsynonymous polymorphisms, Ps synonymous polymorphisms, Fn nonsynonymous fixed differences, Fs synonymous fixed differences. The NI's for groups of genes were calculated by concatenating all coding sequences for the group of genes. Significance was evaluated from concatenated gene sequences using Fisher's exact test.
Statistics
All statistics and plots were produced in R v1.11 (The R Foundation for Statistical Computing http://www.R-project.org). Tests for differences in evolutionary rate between groups of genes or correlations used only those genes included in the classification or detected in the expression study. For grouped data, if Kruskal-Wallis rank sum null hypothesis (that all groups were the same dN/dS distribution) was rejected (P < 0.05) then Mann-Whitney tests were performed on each group to examine whether the dN/dS distribution of the genes in that group differed from the dN/dS distribution of all other genes that were detected/classified in the expression study/classification.
Footnotes
Data deposition
SNP data have been deposited at dbSNP http://www.ncbi.nlm.nih.gov/projects/SNP/ accession numbers; PFCLIN 65863114-65917062, IT 65849337-65863113. Sequence trace files are available at The Wellcome Trust Sanger Institute http://www.sanger.ac.uk/Projects/P_falciparum/.
The polymorphism data will be available for browsing and querying in PlasmoDB http://www.plasmodb.org.
GFF format SSAHA outputs are available upon request.
Competing interest statement
The authors declare that they do not have any competing financial interests.
References
- 1.Korenromp E, Miller J, Nahlen B, Wardlaw T, Young M. World Malaria Report 2005. World Health Organization, Roll Back Malaria, Department and the United Nations Children's Fund. 2005 [Google Scholar]
- 2.Mu J, et al. Chromosome-wide SNPs reveal an ancient origin for Plasmodium falciparum. Nature. 2002;418:323–6. doi: 10.1038/nature00836. [DOI] [PubMed] [Google Scholar]
- 3.Anderson TJ. Mapping drug resistance genes in Plasmodium falciparum by genome-wide association. Curr Drug Targets Infect Disord. 2004;4:65–78. doi: 10.2174/1568005043480943. [DOI] [PubMed] [Google Scholar]
- 4.Gardner MJ, et al. Genome sequence of the human malaria parasite Plasmodium falciparum. Nature. 2002;419:498–511. doi: 10.1038/nature01097. [DOI] [PMC free article] [PubMed] [Google Scholar]
- 5.Ning Z, Cox AJ, Mullikin JC. SSAHA: a fast search method for large DNA databases. Genome Res. 2001;11:1725–9. doi: 10.1101/gr.194201. [DOI] [PMC free article] [PubMed] [Google Scholar]
- 6.Anderson TJ, et al. Microsatellite markers reveal a spectrum of population structures in the malaria parasite Plasmodium falciparum. Mol Biol Evol. 2000;17:1467–82. doi: 10.1093/oxfordjournals.molbev.a026247. [DOI] [PubMed] [Google Scholar]
- 7.Volkman SK, et al. Excess polymorphisms in genes for membrane proteins in Plasmodium falciparum. Science. 2002;298:216–8. doi: 10.1126/science.1075642. [DOI] [PubMed] [Google Scholar]
- 8.Carret CK, et al. Microarray-based comparative genomic analyses of the human malaria parasite Plasmodium falciparum using Affymetrix arrays. Mol Biochem Parasitol. 2005;144:177–86. doi: 10.1016/j.molbiopara.2005.08.010. [DOI] [PubMed] [Google Scholar]
- 9.Yang Z, Bielawski JP. Statistical methods for detecting molecular adaptation. Trends in Ecology and Evolution. 2000;15:496–503. doi: 10.1016/S0169-5347(00)01994-7. [DOI] [PMC free article] [PubMed] [Google Scholar]
- 10.McDonald JH, Kreitman M. Adaptive protein evolution at the Adh locus in Drosophila. Nature. 1991;351:652–4. doi: 10.1038/351652a0. [DOI] [PubMed] [Google Scholar]
- 11.Rocha EP. The quest for the universals of protein evolution. Trends Genet. 2006;22:412–6. doi: 10.1016/j.tig.2006.06.004. [DOI] [PubMed] [Google Scholar]
- 12.Florens L, et al. A proteomic view of the Plasmodium falciparum life cycle. Nature. 2002;419:520–6. doi: 10.1038/nature01107. [DOI] [PubMed] [Google Scholar]
- 13.Le Roch KG, et al. Global analysis of transcript and protein levels across the Plasmodium falciparum life cycle. Genome Res. 2004;14:2308–18. doi: 10.1101/gr.2523904. [DOI] [PMC free article] [PubMed] [Google Scholar]
- 14.Bozdech Z, et al. The transcriptome of the intraerythrocytic developmental cycle of Plasmodium falciparum. PLoS Biol. 2003;1:E5. doi: 10.1371/journal.pbio.0000005. [DOI] [PMC free article] [PubMed] [Google Scholar]
- 15.Ashburner M, et al. Gene ontology: tool for the unification of biology. The Gene Ontology Consortium. Nat Genet. 2000;25:25–9. doi: 10.1038/75556. [DOI] [PMC free article] [PubMed] [Google Scholar]
- 16.Marti M, Good RT, Rug M, Knuepfer E, Cowman AF. Targeting malaria virulence and remodeling proteins to the host erythrocyte. Science. 2004;306:1930–3. doi: 10.1126/science.1102452. [DOI] [PubMed] [Google Scholar]
- 17.Hall N, et al. A comprehensive survey of the Plasmodium life cycle by genomic, transcriptomic, and proteomic analyses. Science. 2005;307:82–6. doi: 10.1126/science.1103717. [DOI] [PubMed] [Google Scholar]
- 18.Nielsen R, et al. A scan for positively selected genes in the genomes of humans and chimpanzees. PLoS Biol. 2005;3:e170. doi: 10.1371/journal.pbio.0030170. [DOI] [PMC free article] [PubMed] [Google Scholar]
- 19.Garnham PCC, Duggan AJ. Malaria parasites and other haemosporidia. Blackwell Scientific; Oxford: 1996. [Google Scholar]
- 20.Martin MJ, Rayner JC, Gagneux P, Barnwell JW, Varki A. Evolution of human-chimpanzee differences in malaria susceptibility: relationship to human genetic loss of N-glycolylneuraminic acid. Proc Natl Acad Sci U S A. 2005;102:12819–24. doi: 10.1073/pnas.0503819102. [DOI] [PMC free article] [PubMed] [Google Scholar]
- 21.Winter G, et al. SURFIN is a polymorphic antigen expressed on Plasmodium falciparum merozoites and infected erythrocytes. J Exp Med. 2005;201:1853–63. doi: 10.1084/jem.20041392. [DOI] [PMC free article] [PubMed] [Google Scholar]
- 22.Li F, et al. Plasmodium ookinete-secreted proteins secreted through a common micronemal pathway are targets of blocking malaria transmission. J Biol Chem. 2004;279:26635–44. doi: 10.1074/jbc.M401385200. [DOI] [PubMed] [Google Scholar]
- 23.Mu J, et al. Genome-wide variation and identification of vaccine targets in the Plasmodium falciparum genome. Nat Genet. 2006 doi: 10.1038/ng1924. Submitted. [DOI] [PubMed] [Google Scholar]
- 24.Volkman SK. Genome-Wide Map of Diversity in Plasmodium falciparum. Nat Genet. 2006 doi: 10.1038/ng1930. al., e. Submitted. [DOI] [PubMed] [Google Scholar]
- 25.Young JA, et al. The Plasmodium falciparum sexual development transcriptome: a microarray analysis using ontology-based pattern identification. Mol Biochem Parasitol. 2005;143:67–79. doi: 10.1016/j.molbiopara.2005.05.007. [DOI] [PubMed] [Google Scholar]
- 26.Horrocks P, Kyes S, Pinches R, Christodoulou Z, Newbold C. Transcription of subtelomerically located var gene variant in Plasmodium falciparum appears to require the truncation of an adjacent var gene. Mol Biochem Parasitol. 2004;134:193–9. doi: 10.1016/j.molbiopara.2003.11.016. [DOI] [PubMed] [Google Scholar]
- 27.Bowman S, et al. The complete nucleotide sequence of chromosome 3 of Plasmodium falciparum. Nature. 1999;400:532–8. doi: 10.1038/22964. [DOI] [PubMed] [Google Scholar]
- 28.Altshuler D, et al. An SNP map of the human genome generated by reduced representation shotgun sequencing. Nature. 2000;407:513–6. doi: 10.1038/35035083. [DOI] [PubMed] [Google Scholar]
- 29.Yang Z. PAML: a program package for phylogenetic analysis by maximum likelihood. Comput Appl Biosci. 1997;13:555–6. doi: 10.1093/bioinformatics/13.5.555. [DOI] [PubMed] [Google Scholar]
- 30.Rand DM, Kann LM. Excess amino acid polymorphism in mitochondrial DNA: contrasts among genes from Drosophila, mice, and humans. Mol Biol Evol. 1996;13:735–48. doi: 10.1093/oxfordjournals.molbev.a025634. [DOI] [PubMed] [Google Scholar]
Associated Data
This section collects any data citations, data availability statements, or supplementary materials included in this article.