Abstract
A postcolumn reactor or a simple open tube connecting a capillary column to, for example, a mass spectrometer affects the performance of a capillary liquid chromatography system in two ways: stealing pressure from the column and adding band spreading. This effect is especially intolerable in fast separations. Our calculations show that in the presence of a 25 μm radius postcolumn reactor, column (50 μm radius) efficiency (number of theoretical plates) is severely reduced by more than 75% with a t0 of 10 s and a particle diameter from 1 μm to 5 μm for unretained solutes at room temperature. Therefore, it is necessary to minimize the reactor’s effect and to improve the column efficiency by optimizing postcolumn conditions. We derived an equation that defines the observed number of theoretical plates (Nobs) taking into account the two effects stated above, which is a function of the maximum pressure Pm, the particle diameter dp, the reactor radius ar, the column radius ac, the desired dead time t0, the column temperature T and zone capacity factor k″. Poppe plots were obtained by calculations using this equation. The results show that for a t0 shorter than 18 s, a Pm of 4000 psi, and a dp of 1.7 μm a 5 μm radius reactor has to be used. Such a small reactor is difficult to fabricate. Fortunately, high temperature helps to minimize the reactor effect so that reactors with manageable radius (larger than 12.5 μm) can be used in many practical conditions. Furthermore, solute retention diminishes the influence of a postcolumn reactor. Thus, a 12.5 μm reactor supersedes a 5 μm reactor for retained solutes even at a t0 of 5 s (k″> 3.8, or k′ > 2.0).
Keywords: nano LC, Taylor-Aris dispersion, band spreading, capillary HPLC, Poppe plot, HPLC
1. Introduction
It is well known that postcolumn reactions can improve sensitivity and selectivity in liquid chromatographic analysis [1–3]. Although postcolumn dead volume is not always deleterious to a separation, when the highest efficiency-per-time is needed, postcolumn dead volume may be limiting. Thus, postcolumn reactors come with some disadvantages. The most obvious are the additional hardware and reagents required, and the bandspreading associated with the additional mixing following the separation. The bandspreading issue has been addressed theoretically [4] as well as experimentally [5,6]. Optimization of postcolumn conditions for chemiluminescence detection has been achieved [7]. Much of the published work applies to columns with typical dimensions of 4.6 mm ID, 10–20 cm long with 5 μm diameter particles.
In the past several years, HPLC has taken a dramatic step towards fast separations. Both the A term and the C term of the van Deemter equation decrease as dp decreases. This drives the need for higher pressure capability because the smaller dp increases back pressure at constant velocity. High pressure pumps permit the application of smaller dp and higher flow rate at the same time. Numerous particles with sub-2 μm diameter and superior mechanical and chemical stability are present in the market [8]. High temperature HPLC has also attracted interest [8–11]. High temperature decreases the viscosity of the mobile phase and accelerates mass transfer, both of which can lead to faster separations without sacrificing column efficiency [12]. Among the commercially available sub-2 μm packing particles, BEH-C18 [13], BEH-Shield RP18 [10] and Zorbax Stable Bond particles [14] (Zorbax SB-C18, -C8, CN, C3, -Phenyl) have shown excellent thermal stability. Thanks to these emerging materials, high temperature becomes a very promising parameter in HPLC for fast analysis. These advances help to speed up HPLC and shorten analysis time to minutes or even seconds rendering HPLC a potential method for on-line monitoring and high-throughput analysis.
In a previous paper [15], we studied the influence of the radius of an open tube reactor, which we call a Capillary Taylor Reactor or CTR, on the performance of capillary liquid chromatography where the linear flow rate of the mobile phase is the optimum and the solute k′ is 0. The choice of the reactor radius actually depends on several factors such as particle size, maximum available pressure, and column diameter. With a maximum pressure of 4000 psi and for packing particles larger than or equal to 2 μm, the CTR is suitable for columns with radii less than 150 μm (“suitable” is defined as Nobs/N0 > 90% where Nobs is the column efficiency with a CTR while N0 is that without a CTR). A reactor with a 12.5 μm radius (i.e., commercially available 25 μm ID capillary) works well under such conditions. For 1 μm particles, the requirements are more stringent. However, the assumptions of operating at the optimum velocity and with k′ = 0 are unrealistic. Therefore, it is necessary to ask: how does a CTR affect the performance of a capillary column in fast separations under realistic conditions?
We will use the Poppe plot, simple but powerful, to analyze our results. It is a log-log plot of the plate time (time equivalent to a theoretical plate, TETP, t/N) vs. the plate number (the number of theoretical plates, N) [16]. Isochrones of constant t are easily drawn on the same plot. Thus, a Poppe plot directly gives not only the number of theoretical plates under certain conditions but also the related analysis time (if k′ is known). Short analysis time and a large number of theoretical plates are both desirable but hard to achieve together. With a Poppe plot, it is easy to consider both of them and make a choice depending on what is more important in a specific experiment: the analysis time or the column efficiency.
In this paper, we derived an equation that defines the observed number of theoretical plates (Nobs) from a column and CTR with minimal assumptions. We have focused the study on fast separations by investigating three emerging, important parameters in fast HPLC, namely small porous packing particles, high temperature, and high obtainable pressure. By comparing the column efficiency with and without a reactor, we have found that a 5 μm radius reactor is the best for unretained or slightly retained solutes at room temperature. At elevated temperature, the much more practical 12.5 μm radius reactor works. A 12.5 μm radius reactor is actually slightly better than a 5 μm reactor for retained solutes.
2. Scheme of the set up of a packed capillary column in series with a CTR
3. Theory
A CTR affects column efficiency in two ways: adding band-spreading and requiring pressure. There is no doubt that adding band-spreading damages column efficiency. For a system operating at the maximum attainable pressure, sharing pressure decreases performance for the following reason. A higher pressure drop across the reactor leads to less pressure available for the column which forces a decrease in the linear velocity (longer analysis time) or the length of the column (fewer theoretical plates). The latter problem gets worse for reactors with small radius. Therefore, we derived Nobs, the observed number of theoretical plates considering these two effects from a reactor as follows.
3.1 The linear velocity in the column in the presence of a CTR
The total pressure in the system is given by Eq. (1). The first term on the right side of equation is the pressure drop in the column while the second term is the pressure drop across the reactor.
| (1) |
In Eq. (1), Pm is the maximum pressure provided by the pump; φ is the column permeability; η is the viscosity of the mobile phase; ar is the radius of the capillary used to make the reactor; uc and ur are the average linear velocities in the column and the reactor, respectively; Lc and Lr represent the length of the column and the reactor, respectively. The value of φ ranges from 500 to 1000 for various columns [17], and we routinely obtain a value of 750 for 2.6 ~ 5 μm particle packed columns with a diameter of 100 μm. Changing φ has a negligible effect on the choice of reactor radius as described in a previous paper [15]. ur can be written as a function of uc as
| (2a) |
| (2b) |
When mixing, a post column reagent flow is introduced into the reactor capillary, increasing the flow rate. In our laboratory, the reagent flow rate is set to be 1/4 ~ 1/2 of the column flow rate to obtain the best sensitivity. Here, we chose 1/3. That is the origin of the constant, 4/3, in Eq. (2a). The column radius is ac ; εe is the extraparticle porosity and εi is the intraparticle porosity. Both porosities are around 0.4 [18], consequently b is 0.64.
The following relationships hold for Lc and Lr
| (3) |
| (4) |
where t0 represents the void time of a separation and y describes the degree of mixing by diffusion. More complete mixing has a larger y value. We chose a value of 2.5 here. This value gives a reactor length that results in a dispersion coefficient defined by the Taylor equation [19]. When the capillary is operating in the Taylor region, the length must be sufficient for an effectively complete reaction if the reaction rate is not the limiting factor[20]. Chemical kinetic factors are not considered here. D is the diffusion coefficient of the solute in the mobile phase.
Combining Eqs. (1)–(4), we obtain the expression to define the average linear velocity in column:
| (5) |
The viscosity of the mobile phase in units of Pa·s is a function of temperature T (in Kelvin) as shown in Eq. (6) [21].
| (6) |
where xacn is the volume percentage of acetonitrile in the mobile phase. We chose 23% in this paper. Another factor dependent on temperature is D, the diffusion coefficient of the solute in the mobile phase,
| (7) |
which is derived from the Walden product, Dη/T = constant. In this paper, we chose D0 to be 7.0 ×10⁻¹⁰ m2/s at 293 K to represent a low molecular weight solute.
With moderate manipulation, an expression for uc is obtained as a function of Pm, dp, ar, ac, t0 and T as shown in Eq. (8).
| (8) |
3.2 Column efficiency with a CTR
We used the van Deemter equation to define Hc, the height equivalent to a theoretical plate, for the case in which the ‘C term’ is dominated by intraparticulate mass transfer.
| (9) |
where λ and g are numerical, geometry-dependent constants. Typically λ is 2 and g is 30 [18] for spherical particles. ue is the extraparticle linear velocity and k″ is the zone capacity factor. k″ relates to k′, the retention factor, by k′ = k0 + (1 + k0 )k′, where k0 is equal to (1− εe) εi/εe, and has a constant value of 0.6 if the porosities are set to 0.4. The extraparticle velocity ue is defined as (1 + k0)uc.
Hc can be calculated provided that uc is known from Eq. (8). The variance from a column in the units of time squared then can be determined by Eq. (10).
| (10) |
Eq. (11) is Hr, the height equivalent to a theoretical plate in a reactor [1].
| (11) |
The variance in time units for a reactor is given by (using Eqs. (4) and (11))
| (12) |
Therefore, the observed number of plates, Nobs, including both effects of the reactor, is expressed as
| (13) |
where te is the dead time for a species that remains in the flowing mobile phase and tr is the time to pass through the CTR: .
For the sake of clarity, an example is given here to illustrate the calculation. With a dp of 1.7 μm, an ar of 12.5 μm, an ac of 50 μm, a t0 of 5 s, a T of 293 K and a Pm of 4000 psi, we calculated the average linear velocity to be 4.5 ×10⁻³ m/s based on Eq. (8). We then obtained the values of Hc, σc,t2 and σr,t2 for an unretained component (k″= 0.6) according to Eqs. (9), (10) and (12) as 3.8 ×10⁻⁶ m, 4.3×10⁻³ s2 and 5.6×10⁻³ s2, respectively. Finally, we calculated Nobs and t/Nobs based on Eq. (13). They are 3155 and 1.8 ×10⁻³ s. For a set of t0 values, we obtain a set of Nobs and t/Nobs values which results in one Poppe plot.
3.3 Column efficiency without a CTR
To display the effect of the reactor, we also calculate the number of theoretical plates under the same conditions but without the reactor (N0) as shown below. The derivation procedure is similar to the one with the reactor but it ignores the reactor part.
| (14) |
| (15) |
| (16) |
| (17) |
where ue0 is defined as (1 + k0)u0.
4. Assumptions and Approximations
As in any approach to a quantitative analysis of a complex system, approximations and assumptions have been made. There are four choices we have made that require at least a brief discussion; namely, the reagent flow rate, the choice of what expression to use for plate height, whether Taylor dispersion is a good description of what occurs in the reactor, and what diffusion coefficient to use.
First, let us consider the reagent flow rate. There is not a correct choice here, but it is certainly true that using a minimal flow rate is best to avoid dilution. Consequently, we have chosen the flow rate of the reagent to be 1/3 of that of the column. This happens to match the current practice in our laboratory. Next, let us consider which bandspreading equation to use. Here we made two choices. First, we chose the van Deemter equation. Furthermore, we chose to take only a single C-term representing intraparticle diffusion. Both of these choices can be criticized from the perspective that they may not be accurate for a particular set of circumstances. In our view, there are several reasons to support these choices. For one thing, the choice is convenient. To the degree that one would like to manipulate algebraic expressions for understanding, it becomes easier with the algebraically simple van Deemter equation, as it has no fractional powers of velocity. Also, we have a previous related publication using the same van Deemter equation. Continuing to use the van Deemter equation makes the comparison of this work and the published work more convenient. Finally, and most importantly, the choice does not matter much. For the most part, in this work we will compare performance of a column with a reactor to a column without a reactor. Further, we mostly focus on changes induced by altering temperature and pressure, and those effects as a function of reactor capillary radius, and over 2–3 orders of magnitude of time (t0). For this broad perspective, the differences among the approaches to describe H disappear. Last, we must consider issues surrounding the use of Taylor dispersion to describe bandspreading in the tubular post-column reactor. When experimental conditions are in the Taylor dispersion region, a uniform mixing zone without a radial concentration gradient will be formed. Therefore, in the Taylor region, the reagent stream and the analyte stream will be thoroughly mixed. We have assumed a rapid reaction, rapid enough that reaction occurs faster than mixing. Under this assumption, the reactor’s efficacy is related to the system being adequately described by Taylor dispersion. There are two criteria for being in the Taylor region: Pe = ua/D >70, which guarantees the axial molecular diffusion is negligible compared to the total dispersion effect (that is, the system is not in the Taylor-Aris region), and Pe < 0.4 L/a to make sure that the reactor tube is long enough for the diffusion to relax the radial concentration gradient [19]. In our calculations, the reactor length is chosen to satisfy the criterion that Pe equals 0.4 L/a (Eq. 4 above). Under all the conditions that we will explore below, Pe is larger than 70, so the reaction capillary is theoretically in the Taylor region. We have already demonstrated that the reactors obey Taylor dispersion theory [1], and the bandbroadening contribution from the mixing portion of the reactor (i.e., the point of mixing of the streams, changes in tubing diameter etc.) is actually immeasurable. Thus, the reactor behaves like a Taylor reactor theoretically and experimentally. There is one final caveat and discussion that is related to the diffusion coefficient. The caveat is that the calculations below assume a fairly small molecule. The results may be different if the solute is a 100 kDa protein, for example. The discussion is related to the fact that there are actually two important diffusing species, the solute that elutes from the column and its reaction product (creating a detectable species). We have assumed that the diffusion coefficients of the solute and the detected species are the same. For example, we use Cu(II) as a reagent for peptides [22]. The small change in molecular weight will not alter the diffusion coefficient considerably. Finally, we have assumed that the diffusion coefficient does not change when the chromatographic eluent and the reagent stream combine. This may or may not be significant, depending on the actual conditions. In this paper, we have not incorporated this effect because there is little to be gained from the added complexity.
5 Result and discussion
5.1 The effect of a 25 μm CTR on the performance of HPLC
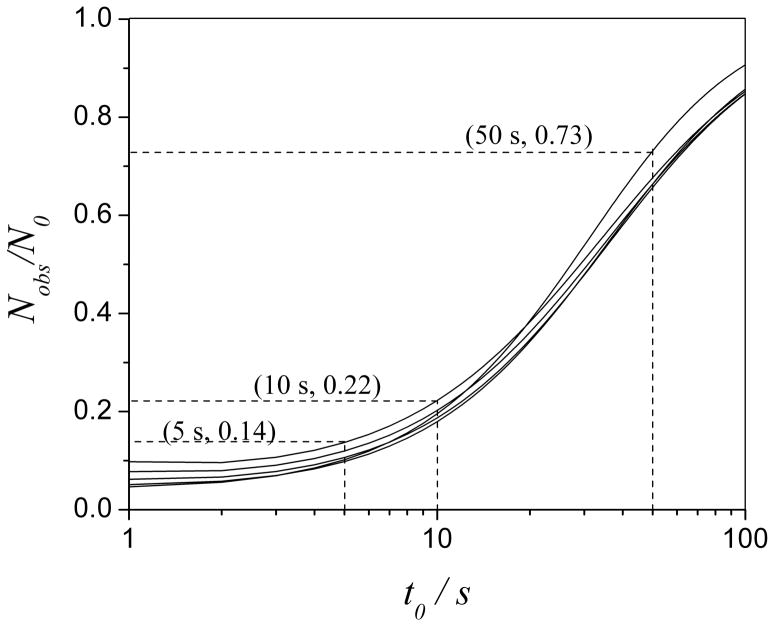
Before turning to Poppe plots, it is informative to understand the magnitude of the problem. Fig. 1 shows the effect of a reactor with a radius of 25 μm (which is easily fabricated in the laboratory) on the column efficiency. Nobs, defined by Eq. (13), is the number of theoretical plates with the reactor’s effects taken into account while N0, defined by Eq. (17), is the number of theoretical plates generated by the same column but without a reactor. When Nobs/N0 is greater than or equal to 90%, we consider the effect of the reactor to be acceptable throughout this paper. As shown in Fig. 2, Nobs/N0 is at best 73% for columns packed with particles of diameters ranging from 1 μm to 5 μm for a separation with a t0 of 50 s. It becomes even smaller as analysis speed is increased. Column efficiency is reduced to less than 14% at a t0 of 5 s which is not tolerable. Thus, it is necessary to optimize the conditions to minimize the effect from a CTR especially when speed is required.
Fig. 1.
Scheme of the set up of a packed capillary column in series with a CTR.
Fig. 2.
The effect of a 25 μm CTR on column efficiency (Nobs/N0 vs t0) when the packing particle diameter ranges from 5 μm to 1 μm (up to bottom from the left). Conditions are as follows: Pm = 4000 psi; b = 0.64; φ = 750; g = 30; λ= 2; ac = 50 μm; ar = 25 μm; T = 293 K; k″ = 0.6 (k′ = 0).
5.2 Optimization of CTR radius
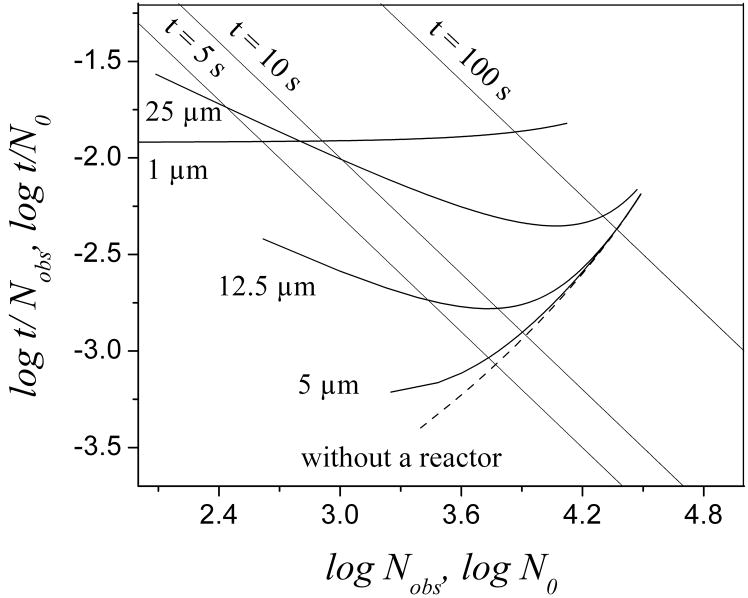
The effect of reactor radius on efficiency is shown in Fig. 3. The curves representing the four reactors are all more or less far away from the dashed line (no reactor) with a short analysis time while becoming closer to the dashed line when the analysis is slower. Some of them even overlap the dashed line when the analysis time is long enough which means that the effect from a CTR can disappear when the separation is slow enough. Among them, the 5 μm curve is on average closest to the dashed line, especially at small t0. Therefore, a reactor with a radius of about 5 μm has the least effect on the column efficiency. The 1 μm reactor line is exceptional. It is always far away from the dashed line with a t0 ranging from 1 to 200 s.
Fig. 3.
Poppe plots for reactors with various radii. dp= 1.7 μm and other conditions are the same as in Fig. 2.
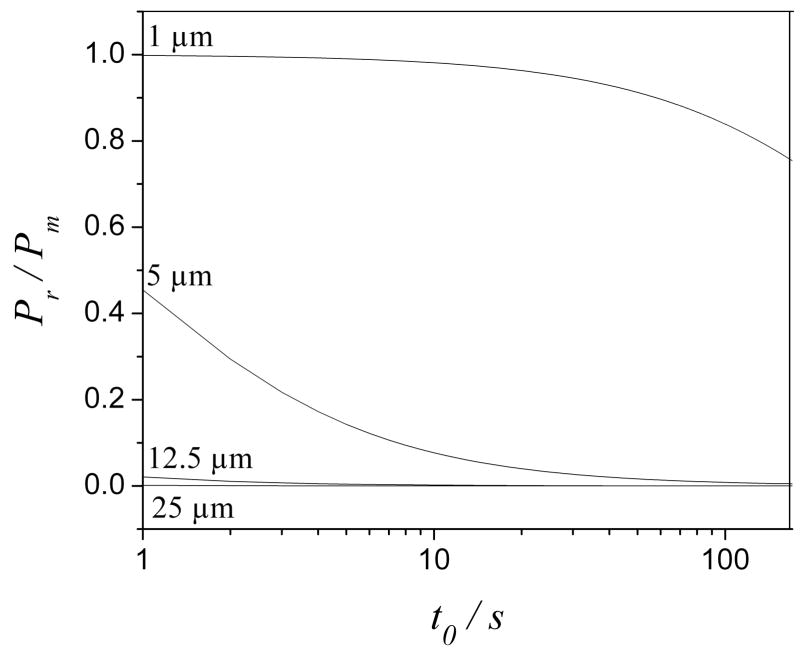
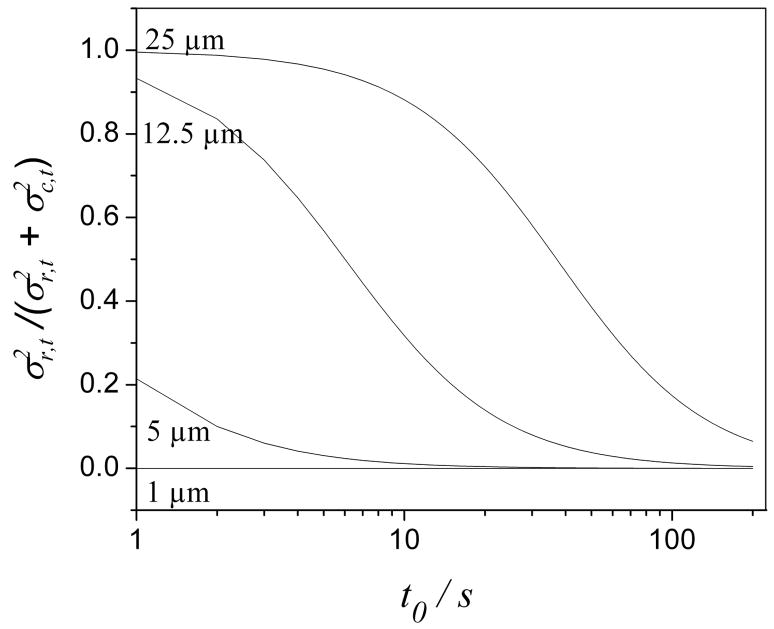
Figs. 4 and 5 demonstrate how the reactor affects the column efficiency and how these effects are related to the reactor radius and the analysis time of a separation. Pr is the pressure drop across a reactor (the second term of Eq. (1)). is the variance in the reactor calculated from Eq. (12) and is the variance in the column calculated from Eq. (10). Obviously, large diameter reactors require less pressure and leave more pressure to the column which in turn gives a better separation (Fig. 4). On the other hand, large reactors contribute more to bandspreading which hurts the column efficiency (Fig. 5). However, both effects have one thing in common: they get smaller at longer analysis time. That is, the reactor’s effect on the column efficiency is more critical in fast separations.
Fig. 4.
Pressure drop across the reactor as a fraction of the attainable pressure as a function of t0. Curves for various reactor radii are labeled. Other conditions are as the same as in Fig. 3.
Fig. 5.
Variance in a postcolumn reactor as a fraction of the total variance vs. t0 for unretained solutes. Curves corresponding to various reactor radii are labeled. The conditions are the same as in Fig. 3.
The bandspreading caused by a 1 μm reactor is negligible. The effect of a 1 μm reactor on the column efficiency then mainly comes from the pressure it requires. As shown in Fig. 4, the pressure drop across a 1 μm reactor is more than 84% of the maximum pump pressure in a t0 range of 1 s to 100 s. The column efficiency in this case is comparable to that generated on the same column operated at less than 16% of the total pressure in the absence of a reactor. That explains why the 1 μm line (Fig. 3) is always far from the dashed line (no reactor). On the other hand, the pressure drop across a 25 μm reactor is negligible according to Fig. 4, so that the effect of a 25 μm reactor on the column efficiency is mostly caused by bandspreading. As shown in Fig. 5, the band spreading occurring in a 25 μm reactor is almost equal to the total bandbroadening at a t0 shorter than 10 s and it gradually decreases with an increase of the analysis time. This explains why in Fig. 3 the 25 μm curve becomes closer to the ‘no reactor’ curve as the analysis time gets longer. Figs. 3–5 show that, for large enough t0, the effects of 5 and 12.5 μm reactors on both pressure and bandspreading are small. For 5 μm reactors, Nobs/No is greater than 0.93 for a t0 greater than 5 s. The same is true for 12.5 μm reactors when t0 is longer than 25 s. Unfortunately, a 5 μm radius reactor would be very difficult to manufacture.
5.3 Minimize reactor effect by increasing temperature
Temperature is a very powerful parameter in fast HPLC [12]. The viscosity of the mobile phase decreases at elevated temperature, so does the pressure drop across the reactor. The diffusion coefficient of a solute in the mobile phase increases so that the bandspreading in the reactor decreases for velocities greater than the optimum velocity. Temperature should have an influence on the effect of the reactor on efficiency.
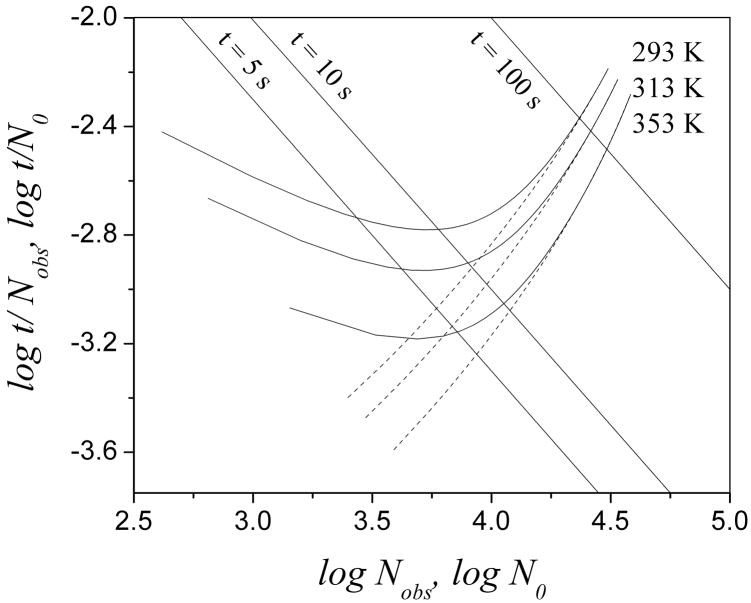
Fig. 6 shows Poppe plots at three different temperatures with or without a 12.5 μm reactor. Obviously, increasing the temperature helps to minimize the effect from the reactor because the solid curves are closer to the related dashed line at high temperature at a given analysis time, e.g. t = 10 s. The valule of Nobs/No increases to 93% at 353 K and a t0 of 10 s from 73% at 293 K.
Fig. 6.
Poppe plots at different temperatures. Solid curves represent the results with a 12.5 μm reactor while dashed curves represent those without a reactor. Other conditions are the same as in Fig. 3
Table 1 shows the percentage of the total variance that comes from the reactor at four temperatures and three values of t0. The higher the temperature or the larger t0 is, the smaller the effect from the reactor on the bandbroadening. The change in the reactor effect caused by increasing temperature is dramatic. With a t0 of 5 s, the added bandbroading from a 12.5 μm reactor decreases from 57% to 15% when the temperature is increased from 293 K to 373 K. With a t0 of 10 s, this number decreases from 32% to 6%. Therefore, high temperature significantly minimizes the effect of a 12.5 μm reactor on bandbroadening which in turn is of benefit to column efficiency.
Table 1.
Temperature minimizes the effect of a 12.5 μm reactor on bandbroadening. Pm= 4000 psi; b= 0.64; φ= 750; g= 30; λ= 2; ac= 50 μm; ar= 12.5 μm; k″=0.6 (k′=0)
|
(%) |
||||
|---|---|---|---|---|
| T = 293 K | T = 313 K | T = 353 K | T = 373 K | |
| t0 = 5 s | 57 | 42 | 21 | 15 |
| t0 = 10 s | 32 | 21 | 9 | 6 |
| t0 = 30 s | 8 | 5 | 2 | 1 |
5.4 Reactor effect at different maximum pressures
According to the van Deemter equation, the A and C terms decrease as particle size (dp) decreases. The right side of the van Deemter curve where the C-term dominates becomes flatter indicating that for small dp, column efficiency is not compromised too much at high velocities. However, small particles and high velocities lead to high pressure drop across the columns suggesting that high pressure is advantageous for fast separations.
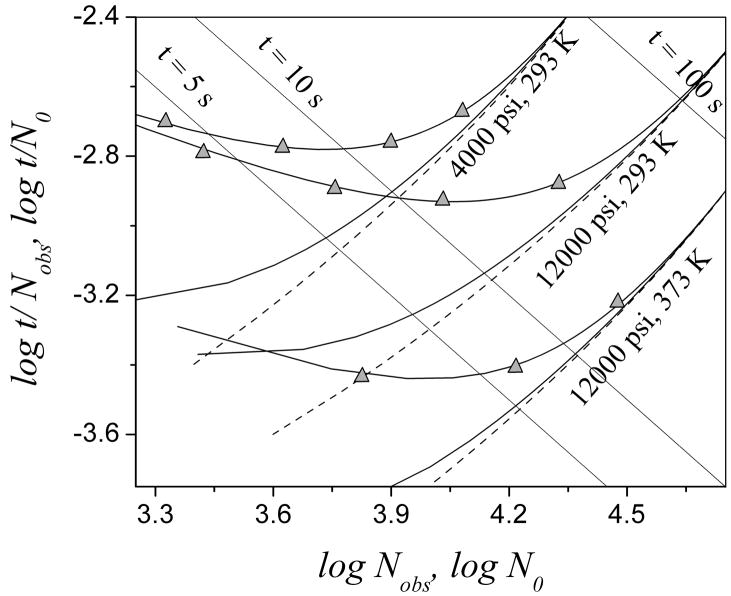
Fig. 7 shows how a CTR impacts column efficiency at various available pressures. Reactors affect the column efficiency in a similar way at all pressures: the effect of a reactor is larger at shorter analysis time. Operating at higher attainable pressure obviously gives better separation without a reactor as the dashed plots show. With a dead time of 5 s and at room temperature, the column efficiency at 12000 psi is almost twice that at 4000 psi. The advantage brought by the high pressure almost disappears with a 12.5 μm reactor at a t0 of 10 s. The column efficiency is only 39% of N0 at 12000 psi with a 12.5 μm reactor with a t0 of 5 s and it is even worse than that at 4000 psi without a reactor. With a 5 μm reactor, it gets better. The column efficiency only decreases a small amount, from 93 % to 92% of N0 when pressure increases from 4000 psi to 12000 psi. Increasing the temperature greatly improves the column performance with a CTR, as shown in the bottom set of curves. The effect from a 5 μm reactor almost disappears at 373 K. The column efficiency with a 12.5 μm reactor also exceeds 90% at a t0 of 10 s at this temperature. Therefore, to maximize the benefit of ultra high pressure, elevated temperature combined with a small radius reactor is certainly preferred.
Fig. 7.
Poppe plots at different pressures. Solid line represents the results with reactors (solid line with triangles is with a 12.5 μm reactor; solid line without symbols is with a 5 μm reactor) while dashed line represents those without a reactor. Temperature and pressure are indicated. Other conditions are the same as in Fig. 3.
5.5 Reactor effect is minimized for retained solutes
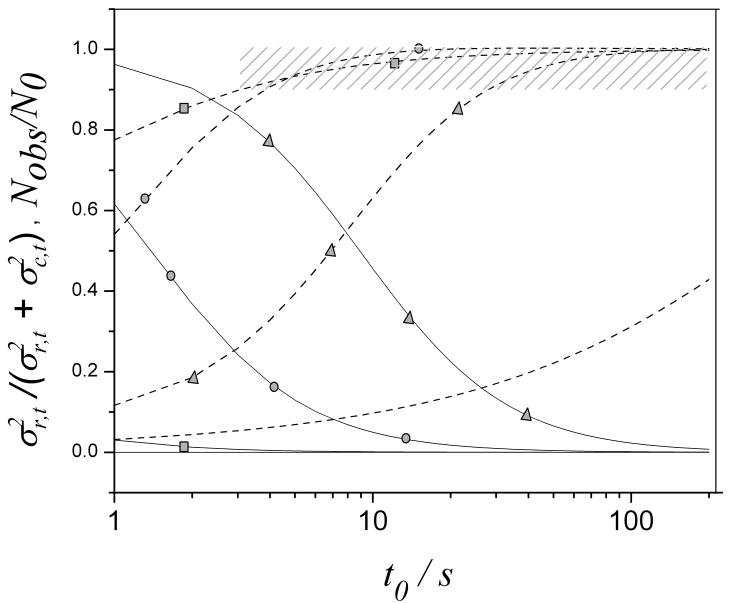
Band spreading occurs in the reactor, but it is not significant if the bandspreading on the column is significant. The peak for a retained solute is obviously more broadened than that for an unretained solute. Thus, we have studied the reactor effect when solutes are retained. The results are shown in Fig. 8 where solid lines represent the contribution of the reactor with various radii to the bandbroadening and dashed lines show the corresponding ratio of column efficiency.
Fig. 8.
Contribution of a reactor with various radii to the band spreading (expressed as ) of moderately retained solutes (k″ = 3.8) (solid line) and corresponding Nobs/N0 (dashed line) with a t0 ranging from 1 s to 150 s (triangle denotes the 25 μm radius reactor; circle is 12.5 μm; rectangular is 5 μm; no symbol is 1 μm). Shadow indicates where the reactor has negligible effect on column performance. Other conditions are the same as in Fig. 3.
The effect of a reactor with smaller radius (1 μm or 5 μm) on bandbroadening is negligible. The bandbroadening effect of a reactor with a manageable radius (12.5 μm or 25 μm) greatly decreases and starts to disappear when retention gets larger. The variance of a 12.5 μm reactor decreases from 32% (k″ = 0.6, shown in Fig. 5) of the total variance to only 5% (k″ = 3.8) with a t0 of 10 s. The situation is almost the same for a 5 μm reactor. Furthermore, a 12.5 μm reactor requires much less pressure than a 5 μm reactor does (shown in Fig. 4). This implies that a 12.5 μm reactor could be better than a 5 μm reactor for retained solutes in fast separations. This notion is verified by the dashed lines. A 12.5 μm reactor starts to supersede a 5 μm reactor with a t0 longer than 5 s when k″ equals 3.8 (or k′ equals 2). Even a 25 μm reactor is suitable with a t0 longer than 27 s as indicated by the shaded portion of Fig. 8.
5.6 Practical limitations
Theoretical calculations demonstrate that high pressure and elevated temperature greatly increases the column efficiency in fast separations not only by allowing the use of small packing particles and high velocity of the mobile phase at the same time but also by diminishing the reactor effect. High pressure pumps are now commercially available. Particles with superior mechanical, chemical, and thermal stability are present in the market [8,14]. The fabrication of a CTR is now the only practical limitation. The construction of a CTR was described elsewhere [1]. Briefly, two tungsten wires are each threaded into two capillaries and then both into another capillary. The junction between the three capillaries is then placed into a piece of PTFE/FEP dual shrink/melt tube. When heating, the outer PTFE layer starts shrinking and the inner FEP layer starts melting. After cooling down, the tungsten wires are removed and a CTR is formed. Small tungsten wires curl up leading to the difficulty in preparation of a CTR with small radius. This again explains why we pursue suitable conditions so that a 12.5 μm radius reactor can be used. The other limitation of CTR fabrication is the length. According to our experience, the length of a CTR cannot be shorter than about 1 cm because of the presence of the dual shrink/melt tube.
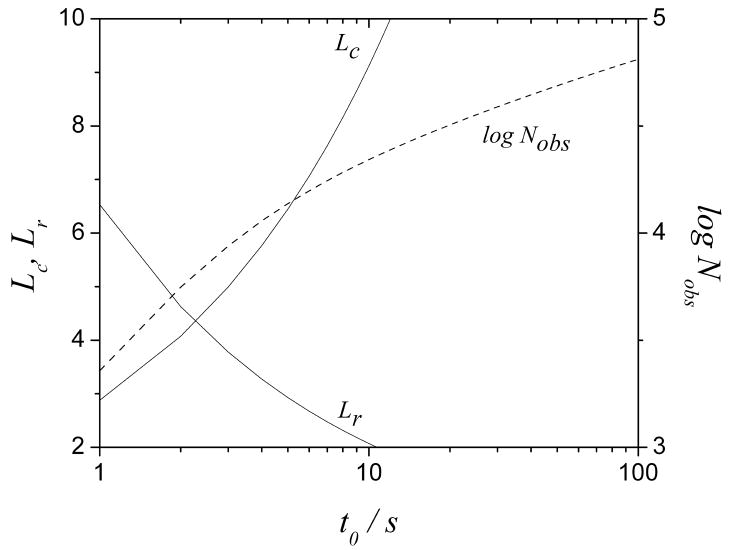
In this paper, we used Taylor dispersion theory to define the length of the reactor. It is interesting to consider the length of the reactor and the column that arises in a ‘high performance’ scenario. Fig. 9 displays the length of a 100 μm (ID) column packed with 1.7 μm particles and a 12.5 μm (radius) reactor at 12000 psi and 373 K and the corresponding number of theoretical plates. It is noteworthy that these conditions lead to about 20,000 theoretical plates at a t0 of 10 s. Furthermore, both lengths are greater than 2 cm with a dead time shorter than 10 s so that we can directly apply the optimal calculated parameters for such separations. However, for separations with longer t0 (>10 s), the reactor length needed for complete mixing is actually less than 2 cm in theory. Experimentally, a longer reactor may be preferred for practical reasons which may increase bandbroadening in the reactor. The column efficiency may then be worse than expected from theory.
Fig. 9.
Lengths of a reactor with a radius of 12.5 μm (dashed line) and a 100 μm (ID) column packed with 1.7 μm particles (solid line) and corresponding Nobs vs. t0 at a temperature of 373 K and a pressure of 12000 psi. Other conditions are the same as in Fig. 3.
6. Conclusion
A postcolumn open capillary, including a postcolumn reactor, steals pressure from the column which in turn decreases the number of theoretical plates when a small radius capillary is used. At the same time, it adds band broadening especially when a large radius capillary is used. Such effects become more intolerable as the separation goes faster. For a 1.7 μm dp column (100 μm ID) with a pressure of 4000 psi and at room temperature, a 5 μm radius reactor is the best for unretained species, but such a small radius reactor is hard to fabricate and maintain. Fortunately, higher temperature helps to minimize the reactor’s effect so that an easily fabricated 12.5 μm radius reactor is suitable in fast separations. The reactor’s effect is relatively smaller for retained species due to their larger on-column band broadening compared to unretained species. For a moderately retained species, a 12.5 μm reactor becomes even better than a 5 μm reactor at a t0 longer than 5 s when other conditions are the same. Ultra-high pressure greatly increases the column efficiency but this benefit is lost especially for unretained or slightly retained species when a 12.5 μm reactor is used. To take full advantage of high pressure with a 12.5 μm reactor, higher temperature is a must. At a t0 of 5 s, a pressure of 12000 psi, room temperature and with a 12.5 μm reactor, Nobs/N0 is only 39% for an unretained solute. Under the same conditions but at a temperature of 373 K, Nobs/N0 increases to 81% and 99% for unretained and moderately retained solutes (k″ = 3.8, k′ = 2), respectively. Therefore, a capillary HPLC column followed by a CTR with manageable radius (larger than 12.5 μm) gives best column efficiency for moderately or strongly retained solutes at high pressure coupled with high temperature.
Acknowledgments
We are grateful to the NIH for grants R01 GM04482 and R21 MH083134.
Appendix 1
Appendix 1.
| List of Variables - Greek | ||
| εe | extra particle porosity, 0.4 | |
| εi | intraparticle porosity, 0.4 | |
| η | viscosity of the mobile phase | |
| λ | numerical geometry-dependent constant, set to 2 | |
|
|
variance from a column in units of time squared | |
|
|
variance from a CTR in the units of time squared | |
| φ | column permeability, set to 750 | |
| List of Variables - Roman | ||
| ac | column radius, set to 50 μm | |
| ar | the radius of the capillary reactor | |
| D | diffusion coefficient of solute in mobile phase | |
| dp | packing particle diameter | |
| g | numerical geometry-dependent constant, set to 30 (spherical particles) | |
| H0 | the height equivalent to a theoretical plate without a CTR | |
| Hc | the height equivalent to a theoretical plate | |
| Hr | height equivalent to a theoretical plate in a CTR | |
| k0 | constant, k0 = (1− εe) εi/εe | |
| k′ | the retention factor | |
| k″ | zone retention factor, k″ = k0+ (1+k0)k′ | |
| L0 | length of a column without a CTR | |
| Lc | length of a capillary column | |
| Lr | length of a CTR | |
| Nobs | observed number of theoretical plates from a column and a CTR | |
| N0 | number of theoretical plates from a column alone | |
| Pm | maximum pressure provided by HPLC pump | |
| T | temperature | |
| t0 | dead time of an ananlysis | |
| u0 | average linear velocity in a column without a CTR | |
| uc | average linear velocity in a column with a CTR | |
| ue | exraparticle linear velocity | |
| ue0 | extraparticle linear velocity without a CTR | |
| ur | linear velocity in the reactor | |
| y | a constant describing the degree of mixing by diffusion, set to 2.5 | |
Footnotes
Publisher's Disclaimer: This is a PDF file of an unedited manuscript that has been accepted for publication. As a service to our customers we are providing this early version of the manuscript. The manuscript will undergo copyediting, typesetting, and review of the resulting proof before it is published in its final citable form. Please note that during the production process errors may be discovered which could affect the content, and all legal disclaimers that apply to the journal pertain.
References
- 1.Beisler AT, Sahlin E, Schaefer KE, Weber SG. Anal Chem. 2004;76:639. doi: 10.1021/ac034785d. [DOI] [PMC free article] [PubMed] [Google Scholar]
- 2.Brinkman UAT. Chromatographia. 1987;24:190. [Google Scholar]
- 3.Freeman MK, Daunert S, Bachas LG. LC-GC. 1992;10:112. [Google Scholar]
- 4.Huber JFK, Jonker KM, Poppe H. Anal Chem. 1980;52:2. [Google Scholar]
- 5.Kucera P, Umagat H. J Chromatogr. 1983;A 255:563. [Google Scholar]
- 6.Nirode WF, Staller TD, Cole RO, Sepaniak MJ. Anal Chem. 1998;70:182. doi: 10.1021/ac970560p. [DOI] [PubMed] [Google Scholar]
- 7.Cepas J, Silva M, Perez-Bendito D. Anal Chem. 1995;67:4376. doi: 10.1021/ac00120a004. [DOI] [PubMed] [Google Scholar]
- 8.Majors RE. LC-GC. 2008;26:16. [Google Scholar]
- 9.Heinisch S, Desmet G, Clicq D, Rocca JL. J Chromatogr. 2008;A 1203:124. doi: 10.1016/j.chroma.2008.07.039. [DOI] [PubMed] [Google Scholar]
- 10.Nguyen DTT, Guillarme D, Heinisch S, Barrioulet MP, Rocca JL, Rudaz S, Veuthey JL. J Chromatogr. 2007;A 1167:76. doi: 10.1016/j.chroma.2007.08.032. [DOI] [PubMed] [Google Scholar]
- 11.Xiang Y, Liu Y, Lee ML. J Chromatogr. 2006;A 1104:198. doi: 10.1016/j.chroma.2005.11.118. [DOI] [PubMed] [Google Scholar]
- 12.Yang X, Ma L, Carr PW. J Chromatogr. 2005;A 1079:213. doi: 10.1016/j.chroma.2004.11.069. [DOI] [PubMed] [Google Scholar]
- 13.Gritti F, Guiochon G. J Chromatogr. 2008;A 1187:165. doi: 10.1016/j.chroma.2008.02.036. [DOI] [PubMed] [Google Scholar]
- 14.Guillarme D, Russo R, Rudaz S, Bicchi C, Veuthey JL. Curr Pharmaceut Analysis. 2007;3:221. [Google Scholar]
- 15.Xu H, Weber SG. J Chromatogr. 2006;A 1113:116. doi: 10.1016/j.chroma.2006.01.129. [DOI] [PMC free article] [PubMed] [Google Scholar]
- 16.Poppe H. J Chromatogr. 1997;A 778:3. [Google Scholar]
- 17.Knox JH, Gilbert MT. J Chromatogr. 1979;186:405. [Google Scholar]
- 18.Weber SG, Carr PW. Chemical Analysis (New York, NY, United States) 1989;98:1. [Google Scholar]
- 19.Probstein RF. Physicochemical Hydrodynamics: An Introduction. 2. 2003. [Google Scholar]
- 20.Jung MC, Weber SG. Anal Chem. 2005;77:974. doi: 10.1021/ac0486241. [DOI] [PMC free article] [PubMed] [Google Scholar]
- 21.Cabooter D, Heinisch S, Rocca JL, Clicq D, Desmet G. J Chromatogr. 2007;A 1143:121. doi: 10.1016/j.chroma.2006.12.101. [DOI] [PubMed] [Google Scholar]
- 22.Chen JG, Logman M, Weber SG. Electroanalysis. 1999;11:331. [Google Scholar]


