Abstract
Auditory processing deficits have been hypothesized to play a role in the disorder of stuttering (Bloodstien, 1995). The current study focused on non-linguistic auditory processing without verbal responses to rule out effects of language processing differences and articulatory planning for speaking. A pure-tone, oddball paradigm was utilized to compare behavioral responses of accuracy and reaction time, and event-related potentials elicited by brief standard and target tones. Results revealed that, as a group, AWS tended to perform less accurately and were slower to respond to target stimuli. However, inspection of individual data indicated that most AWS performed well within the range of the NFS, and only 3/11 AWS were clearly outside the range. No overall group differences were found for early perceptual processes (N100 and P200), however, the AWS with small amplitude N100 responses were those who performed less accurately and those with reduced P200 amplitudes performed more slowly. Thus, a small subset AWS demonstrated early perceptual processes indicative of reduced cortical representation of auditory input that may have resulted in reduced behavioral performance. P300 mean amplitude, which tended to be reduced overall for the AWS compared to the NFS, did not correlate with behavior for the AWS. However, P300 mean amplitude was significantly correlated with accuracy for the NFS indicating that stronger working memory updating processes enhanced performance for NFS. Taken together, these findings emphasize the importance of examining individual differences among AWS and point to the possibility of non-linguistic auditory processing deficits in only a subset of AWS.
Keywords: auditory processing, stuttering, N100, P200, P300
Introduction
Stuttering is an involuntary disruption in fluency characterized by abnormal frequency or duration of interruptions in the flow of speech, namely repetitions, prolongations, and blocks (Guitar, 1998). The cause of stuttering is unknown, though a variety of etiologies have been proposed (for complete review of proposed etiological theories, see Bloodstein, 1995; Curlee & Siegel, 1997; & Manning, 2001). Many current models of stuttering incorporate atypical neurophysiology, genetic factors, a person’s environment, personality, learning ability, auditory processing, and production of speech and language (Bloodstein, 1995; Guitar, 1998; Lawrence & Barclay, 1998). Smith and Kelly (1997) propose a nonlinear multifactorial model of stuttering, which incorporates the complex relationship of many factors that can influence stuttering and their compounded and interactive effects on the speech motor system. It is hypothesized that the contribution level of each factor determines distinctive behavior patterns that emerge among individuals (Smith, 1990). The present experiment focuses on one factor hypothesized to play a role in stuttering, auditory processing.
Auditory Processing
Auditory processing is a single factor among many potential contributing variables associated with stuttering (Hall & Jerger, 1978; Rosenfield & Jerger, 1984). Since the 1950s, clinicians have used altered auditory input, such as delayed auditory feedback (DAF), to reduce stuttering, with results suggesting that auditory processing and feedback may play important roles in stuttering (Rosenfield & Jerger, 1984). However, it was not clear whether the fluency-enhancing effects were due to altered input or the resulting slower rate of speech. More recent research shows that even under rapid speaking conditions, delayed auditory feedback and frequency-altered feedback continue to enhance fluency in adults who stutter (AWS), indicating that auditory processing and feedback, not simply slower speech rate, play a role in enhanced fluency (Kalinowski, Armson, Roland-Mieszkowski, Stuart, & Gracco, 1993).
The current study focuses on non-linguistic auditory processes to determine whether basic auditory processing may differ for AWS without any language processing demands. Previous behavioral experiments on non-linguistic auditory processing in stuttering have provided inconsistent results. Response accuracy to pure-tone, masking level difference tasks revealed reduced accuracy in AWS compared to normally fluent speakers (NFS) (Kramer, Green, & Guitar, 1987), while Blood (1996) found no accuracy differences between the two groups on these tasks. Kramer and colleagues (1987) have suggested that inconsistent findings among studies may be due to a continuum of auditory processing deficits in adults who stutter.
While early research focused on behavioral responses to auditory stimuli, more recent studies have investigated the neural functioning of auditory processing in AWS. Similar to behavioral findings, brainstem responses to auditory stimuli have been assessed in AWS with conflicting results. An auditory brainstem response (ABR) study reported no significant differences between AWS and NFS (Stager, 1990), while another study of middle latency brainstem responses noted shorter Wave Pb latency in adult males who stutter, which may represent differences in the thalamic reticular activating system controlling arousal and motivation (Deitrich, Barry, & Parker, 1995).
A study of cortical potentials using event-related brain potentials (ERPs) elicited by pure-tones in an “oddball” stimulus paradigm indicated that for fluent speakers, the target stimulus elicited larger P300s in the right compared to the left hemisphere (Morgan, Cranford, & Burk, 1997). However, in 5 out of the 8 AWS, P300 amplitudes were larger in the left hemisphere (Morgan et al., 1997), suggesting auditory processing differences in AWS for nonlinguistic pure-tone stimuli. The P300 amplitudes were reported for only two electrode sites (C3/4) in the Morgan et al. study. Further, the study by Morgan et al. (1997) did not report findings for earlier cortical potentials (N100, P200) and did not include and behavioral performance measures. In another investigation of cortical potentials elicited by auditory stimuli, magnetoencephalography (MEG) indicated that AWS exhibit atypical organization of auditory processing regions of the brain (Salmelin et al., 1998). Salmelin and colleagues (1998) measured N100m source strength elicited by 1000 Hz tones delivered during fluent and dysfluent speech to examine hemispheric sensitivity to auditory stimulation. In the AWS, sensitivity was increased over the right hemisphere, while sensitivity in NFS was left-lateralized (Salmelin et al., 1998). Biermann-Ruben, Salmelin, & Schnitzler (2005) investigated auditory pure-tone and speech perception in AWS via MEG as well. No differences were observed in early pure-tone processing for 1000 Hz tones (N100m). In summary, only very limited information about non-linguistic auditory processing in stuttering, and the question remains as whether AWS process simple auditory stimuli differently compared to NFS.
The purpose of the current experiment was to extend the findings of earlier work to better understand the potential role of nonlinguistic auditory processing in stuttering. Using a pure-tone oddball paradigm with a shorter and a longer interstimulus interval (ISI), we examined behavioral performance as well as the latencies and amplitudes of both early perceptual (N100, P200) and later cognitive cortical potentials (P300) in AWS and NFS. The information that can be obtained from each of these dependent measures is described in detail below.
Early Perceptual Indices
The N100, P200, and N100-P200 complex are event-related brain potentials evoked by a range of auditory stimuli, from clicks to speech to abrupt changes in a continuous sound (Hyde, 1997; Rohrbaugh, Parasuraman, & Johnson, 1990). The N100 typically occurs about 100 ms post-stimulus onset with the P200 emerging between 175 and 225 ms post-onset (Hyde, 1997). The N100-P200 complex is proposed to represent acoustical changes from a state of stability to rapid motion in at least one component of the auditory signal (Hyde, 1997).
P300 Index of Working Memory Updating
The P300 is a complex ERP component occurring between 300 and 600 ms post-stimulus onset in response to a low probability stimulus, often elicited by a simple oddball paradigm (Polich & Kok, 1995). P300 amplitudes are related to factors such as stimulus probability, quality, and duration, and is associated with attention and task relevance; ignored stimuli typically do not elicit a P300 (Rohrbaugh et al., 1990).
Length of interstimulus interval plays a role in determining P300 amplitudes, with longer ISIs eliciting larger amplitude waves (Polich, 1990). It is hypothesized that the P300 may be related to the psychological relative refractory period; the time between two split-second decisions made in a row (Neville, Coffey, Holcomb, & Tallal, 1993; Polich, 1990; Rohrbaugh et al., 1990). The amplitude of the P300 is affected by attention and memory load and is subject to habituation and reduction in repetitive tasks, indicating that the P300 may reflect neuronal activity related to focusing on new information and updating working memory (Polich & Kok, 1995). The variety of results in the literature suggests that the P300 may be a summation of numerous events in the specified time window contributing collectively to the formation of the waveform (Polich & Kok, 1995).
Interstimulus Interval – Temporal Constraints of Processing
Rapid interstimulus intervals influence ERP amplitude due to the recovery cycle of neurons. ERPs are generated by large groups of neurons firing in synchrony (Nunez, 1995). If a subpopulation of the neurons have not recovered from the previous firing, the ERP component will be reduced in amplitude. For this reason, short ISIs elicit ERPs with reduced amplitude compared to ERPs elicited by stimuli with longer ISIs (Polich, 1990). ISI can have an effect on many ERP components, including the N100-P200 complex and the P300 (Neville et al., 1993; Polich, 1990).
Accuracy & Reaction Time – Functional Behavioral Index
While measures of behavioral accuracy indicate processing precision, reaction time indicates speed of processing. Previous research has revealed inconsistent reaction time results in AWS across paradigms, including tasks with linguistic and/or nonlinguistic stimuli requiring verbal and/or motor responses (Bloodstein, 1995; Ratner, 1997). However, finger press response times of AWS to auditory pure tones were consistently longer compared to NFS (Cross, 1978; Cross & Luper, 1983; Starkweather, Franklin, & Smigo, 1984). Event-related brain potentials help differentiate whether slowed reaction times are due to differences in early perceptual processing or in later stages of cognitive processing.
Purpose
The aim of the current study is to increase our understanding of nonlinguistic auditory processing and its relationship to stuttering. The design of the current experiment allows for exploration of early and late cortical potentials elicited by brief tonal stimuli and examination of the relationship between behavioral performance and ERP measures.
Methods
Participants
Participants were 11 adult males (n = 8) and females, ages 18–62, who stutter (AWS) and 11 normally fluent speakers (NFS) who served as control participants. Controls were age- (± 2 years), gender-, and education-matched (± 2 years) with each AWS (Table 1). Ten participants were right-handed and one was left-handed in each group as determined by the Edinburgh Inventory for assessment of handedness (Oldfield, 1971). All participants were native speakers of English and had normal or corrected-to-normal vision, normal hearing, and no neurological impairments. Control participants had no history of speech or language impairments.
Table 1.
Characteristics of Participants
| Adults who Stutter | Normally Fluent Speakers | |||||
|---|---|---|---|---|---|---|
| Age | Gender | Education | Age | Gender | Education | |
| 1 | 25 | F | 6 | 25 | F | 6 |
| 2 | 34 | M | 3 | 35 | M | 5 |
| 3 | 41 | M | 5 | 42 | M | 5 |
| 4 | 41 | M | 7 | 43 | M | 5 |
| 5 | 45 | F | 7 | 45 | F | 7 |
| 6 | 62 | M | 5 | 60 | M | 7 |
| 7 | 18 | M | 1 | 19 | M | 2 |
| 8 | 21 | M | 3 | 22 | M | 5 |
| 9 | 22 | F | 5 | 23 | F | 5 |
| 10 | 26 | M | 7 | 26 | M | 5 |
| 11 | 43 | M | 4 | 45 | M | 5 |
| Mean | 34.36 | 4.81 | 35.00 | 5.18 | ||
| SE | 4.04 | 0.58 | 3.92 | 0.40 | ||
Note: Education Levels: 1= High School Graduate, 2 = 1 yr college, 3 = 2 yrs college, 4 = 3 yrs college, 5 = 4 yrs college, 6 = 1st year graduate school, 7 = Master Degree completed
Screening Procedures
AWS were administered the Stuttering Severity Index (SSI-3) to verify the presence of stuttering and measure its severity (Riley, 1994). All participants were administered four subtests of the Test of Adolescent and Adult Language, Third Ed. (TOAL-3, Hammill, Brown, Larsen, & Wiederholt, 1994) to provide a measurement of speaking and listening abilities for both vocabulary and grammar. All participants exhibited normal language skills and the NFS and AWS did not differ on these measures (Between: Group F (1,19) < 1; Within: Subtest X Group F (6,57) < 1). All participants passed a pure-tone audiological screening, performed using a GSI-17 Audiometer, at 30 dBHL at 500, 1000, and 2000 Hz presented via headphones in a sound-attenuating booth. Visual acuity was screened for each participant using a standard eye chart.
Stimuli
Stimuli for the event-related brain potential (ERP) paradigm were presented using the STIM program by Neuroscan. Pure tones were presented via headphones in a standard oddball paradigm. Tones were 1000 Hz (standard tones) and 2000 Hz (target tones). Two conditions of interstimulus interval were included for each tone frequency: a short (200 ms) and a long (1000 ms) ISI. Tone duration was 50 ms with rise and fall times of 5 ms. A total of 900 tones were presented in an 80:20 ratio of standard to target tones. One third of the tones were presented randomly to the left ear, right ear, or both ears (central), which increased the complexity of the task as participants did not know from which location the stimuli would be presented on any given trial. Left ear and right ear tones were presented at 90 dB SPL and central tones were present at 85 dB SPL to compensate for increased perceived loudness to binaural presentation. The perceived loudness of these brief tones was at a comfortable listening level, presented in a randomized order, and balanced across ISI and location. The total run time for the stimuli presentation was approximately 10 minutes.
Event-Related Brain Potential Recordings
Electrical activity was recorded from the scalp using 32 Ag-Cl electrodes secured in an elastic cap (Quik-cap). Electrodes were positioned over homologous locations across the two hemispheres according to the criteria of the International 10-10 system (American Electroencephalographic Society, 1994). The specific locations were: midline sites FZ, FCZ, CZ, CPZ, PZ, OZ, medial lateral sites FP1/FP2, F3/F4, FC3/FC4, C3/C4, CP3/CP4, P3/P4, O1/O2 and lateral sites F7/F8, FT7/FT8, T7/T8, TP7/TP8, P7/P8. Electroencephalographic activity was referenced to linked mastoids. The electro-oculograms (EOGs) were bipolar recordings via electrodes placed over the right and left outer canthi (horizontal eye movement) and left inferior and superior orbital ridge (vertical eye movement). All electrode impedances were adjusted to 5 kOhms or less. The electrical signals were amplified within a bandpass of 0.1 and 100 Hz and digitized on-line (Neuroscan 4.0) at the rate of 500 samples/second.
Procedure
Participants completed a consent document, case history form, and handedness questionnaire (Oldfield, 1971). After placing the electrode cap on the participant, appropriate impedance measures were obtained. The participant was then comfortably seated in the sound-attenuating booth.
Participants were positioned 140-cm from a 48-cm monitor and the procedure of the task was explained. A small crosshair appeared low and centered on the screen to provide an object for eye fixation, allowing eyes to relax and minimizing ocular muscle activity. The fixation point remained on the screen throughout the presentation of the tones. Participants were instructed to press a response key as quickly as possible when they heard a high (2000 Hz) tone. Keypad responses were balanced between the right and left hands within and across groups (NFS/AWS and male/female). Participants were instructed to blink as little as possible and to remain still during the presentation of the tones. A practice session of 20 tones acquainted participants to the task, ensuring understanding of the task as well as accurate behavioral responses. After successful completion of the practice session, the 900 tone stimuli presentation began.
Behavioral Measures
Accuracy for detection of target tones and reaction times (RT) were measured; RTs were calculated only for correct responses to target tones occurring between 100 ms and 1000 ms after tone onset to eliminate spurious button presses (2.7%). For the measures of accuracy and RT, statistical comparisons were made using an ANOVA with repeated measures of two groups (AWS, NFS) X 2 ISI (200 ms, 1000 ms). Comparisons were made between and within groups.
ERP Measures
Trials with excessive eye movement or other forms of artifact were excluded from analyses of the ERPs (31.5%). The remaining trials were averaged for short and long ISI conditions for the standard and target tones for each participant. Averages were computed from 100 ms pre-stimulus onset to 400 ms post-onset for standard tones, and 100 ms pre-stimulus onset to 700 ms post-onset for target tones. The 100 ms interval prior to onset served as the baseline for the ERPs. Peak amplitudes were computed relative to the baseline and peak latencies were computed relative to the trigger point (0 ms) that marks the onset of the stimulus. For the later, broad, cognitive potential P300, mean amplitudes were calculated within the determined time window. Temporal windows for these measures are described below.
Peak amplitudes and latencies of the N100 elicited by the standard (N100S) and target tones (N100T) and P200 elicited by the standard tones were measured within the temporal windows of 50–250 ms and 150–300 ms post-stimulus onset respectively. For target tones, the P300 mean amplitudes were measured between 280 and 500 ms. Peak amplitude and latency measures for the P300 were unreliable due to the broad nature of the P300 component we obtained, therefore only P300 mean amplitude measures are reported (Luck, 2005). Statistical analyses of ERP measures of peak and mean amplitudes and peak latencies were performed using an ANOVA with repeated measures including: 2 groups (NFS, AWS) X 2 ISI (200 ms, 1000 ms) X 2 hemispheres (left, right) X subset of electrode sites. Comparisons were made within and between groups for both standard and target tones. The subset of electrode sites used for the comparisons were based on visual inspection of the elicited waveforms to determine where reliable peaks could be measured and based on distribution findings from previous studies (Polich & Kok, 1995). Lateral and central electrode sites were selected for the repeated measures analyses. The subsets of electrode sites used for each component of interest were as follows: N100S, N100T, and P200 peak amplitude and latency: FZ, FCZ, CZ and F3/4, FC3/4, FT7/8, T7/8, C3/4; P300 mean amplitude: CZ, CPZ, PZ and TP7/8, C3/4, CP3/4, P3/4. Because results for the central electrode sites mirrored those of the lateral sites and did not provide additional information, only lateral electrode site statistics were included in this report as they provided a sample of ERPs from the left and right hemispheres. Significance values were set at p < .05. For all repeated measures with greater than one degree of freedom in the numerator, the Huynh-Feldt (H-F) adjusted p-values were used to determine significance (Hays, 1994). The effect sizes, indexed by the partial-eta squared statistic (ep2), are reported for all significant effects. Tukey HSD post hoc comparisons, which utilize the MS Error term from the repeated measures ANOVA, were calculated for significant interactions involving multiple variables to determine which comparisons contributed to the significant F values (Hays, 1994). Additionally, regressions were calculated to investigate the relationship between the ERP indices and the behavioral performance within each group. To reduce the number of correlations, only two electrodes sites from each hemisphere were used for the regression analysis. Using the Bonferroni correction, significance for the correlations was set at p < .012 (Hays, 1994).
Results
Behavior
Accuracy
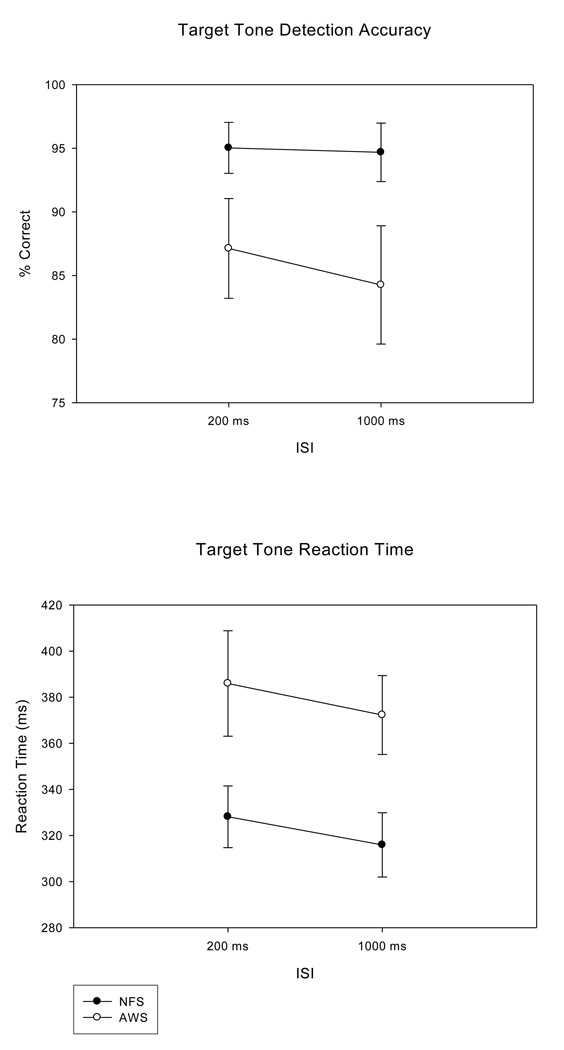
The NFS tended to perform with higher accuracy on the target detection task than the AWS, with the mean (SE) percent correct of 94.85 (2.01) for the NFS and 85.69 (4.24) for the AWS, F (1, 20) = 3.82, p = .065, ep2 = .160. Figure 1 (top panel) further illustrates the accuracy results, comparing the percent correct obtained by the NFS and the AWS for the two ISI conditions.
Figure 1.
Target tone detection accuracy for the NFS and the AWS plotted for the short and long interstimulus intervals (ISIs; top panel) demonstrates larger standard errors (SEs) for both the long and short ISI for the AWS. Reaction times for the NFS and the AWS plotted for each ISI condition (bottom panel) illustrates more rapid RTs with smaller standard errors (SEs) for the NFS compared to the AWS.
Reaction Time
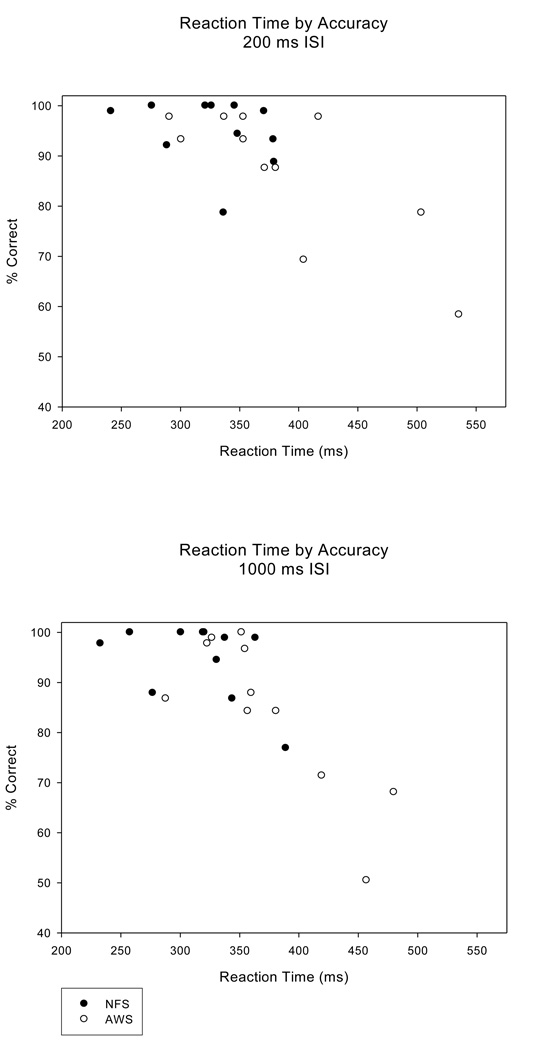
NFS displayed significantly faster reaction times for detecting target tones compared to the AWS, F (1, 20) = 5.93, p = .024, ep2 = .229, with mean (SE) RT of 322.02 (13.09) ms for NFS and 379.10 (19.44) ms for the AWS. Figure 1 (bottom panel) illustrates this further by showing the RT differences between the two groups for the short and the long ISIs. Converging evidence from the accuracy and reaction time measures indicate that a speed-accuracy trade-off did not explain group differences, as the AWS who performed more accurately also responded faster than those who were less accurate. The scatterplot in Figure 2 revealed that the behavioral responses of many of the AWS were in the same range as the NFS, while a small subgroup of AWS were outside this range, with slower and less accurate responses. The top and bottom panels illustrate each ISI condition separately.
Figure 2.
Reaction time plotted against target tone detection accuracy for the NFS and the AWS for the short ISI (200 ms) (top panel) and long ISI (1000 ms) (bottom panel) conditions illustrates that differences between the groups were not due to a speed/accuracy trade-off, since the slower participants were also less accurate.
Standard Tones
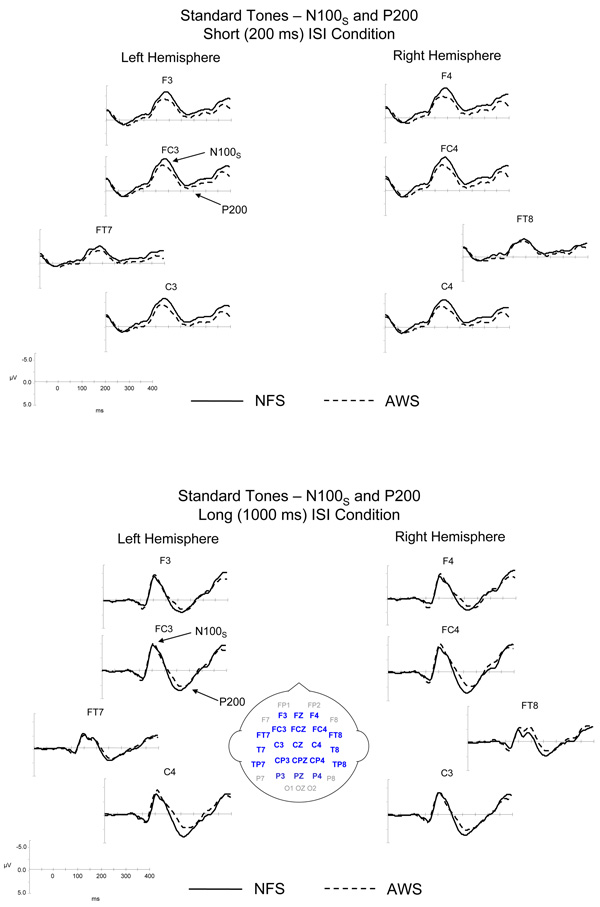
The ERPs elicited by the standard tones are illustrated in Figure 3 for the NFS and the AWS. As can be seen, the standard tones elicited an N100S and a P200 in both groups. The similarities and differences in the ERPs elicited in the NFS and the AWS are summarized below.
Figure 3.
Grand average ERPs elicited by the standard tones for the long and short ISI conditions are illustrated for the NFS and the AWS. ERPs from lateral and mid-lateral sites over the left and right hemispheres included in the statistical analyses are illustrated. Negative potentials are plotted upward. The bottom figure contains an illustration of the layout of electrodes across the scalp; highlighted electrode sites were included in the statistical analyses.
N100S
Peak Latency
There was no main effect of group for N100S peak latency, F (1, 20) < 1. N100S peak latencies (SE) were earlier for both NFS and AWS for the 1000 ms ISI condition, 109.92 (4.81) ms and 108.28 (4.30) ms respectively, compared to the 200 ms ISI condition, 128.14 (4.10) ms and 125.53 (3.89) ms, F (1, 20) = 41.22, H-F p < .001, ep2 = .673. The N100S peak latencies (SE) were earlier over the left hemisphere, 115.17 (2.98) ms, compared to the right hemisphere, 120.77 (2.57) ms, for both groups, F (1, 20) = 17.06, H-F p = .001, ep2 = .460.
Peak Amplitude
N100S peak amplitudes did not reveal main effect group differences between the NFS and AWS, F (1, 20) < 1. N100S peak amplitudes were similar between NFS and AWS for both the long, −4.88 (.266) µV and −5.42 (.713) µV respectively, and short ISI, −6.37 (.392) µV and −5.54 (.503) µV, conditions, F (1, 20) = 2.86, H-F p = .164. Figure 4 (top panel) displays the means and standard error measures of the N100S peak amplitudes for the NFS and the AWS, and illustrates that the variability of peak amplitude measures (SE) is larger for the AWS than the NFS. Regression analysis, comparing N100S peak amplitudes with behavioral performance, did not reach significance for the NFS (r < .294, p > .190; Figure 4 bottom panel). Correlations between N100S peak amplitudes and RT were not significant for the AWS; however, in the AWS, N100S peak amplitudes and accuracy measures tended to be negatively correlated (r > −.546, p < .041) for electrode sites F3, and F4, demonstrating that AWS with lower response accuracy also exhibited smaller N100S peak amplitudes (Figure 4 bottom panel).
Figure 4.
N100S peak amplitudes (averaged across electrode sites) plotted for both groups (top panel) illustrate that the range of N100S peak amplitudes were larger in the AWS compared to the NFS. Regression plots for individual subjects at electrode sites F3 and F4 for the NFS and the AWS (bottom panel) illustrate the trend toward a significant correlation between tone detection accuracy and N100S peak amplitude measures in the AWS, a relationship not observed in the NFS.
P200
Peak Latency
The main effect of group for measures of P200 peak latency was not significant, F (1, 20) < 1. The long ISI condition elicited earlier P200 peak latencies (SE) in both the NFS and the AWS, 210.65 (8.27) ms and 216.11 (6.21) ms respectively, compared to those elicited by the short ISI condition, 237.42 (7.24) ms and 237.89 (5.77) ms, F (1, 20) = 15.61, H-F p = .001, ep2 = .438.
Amplitude
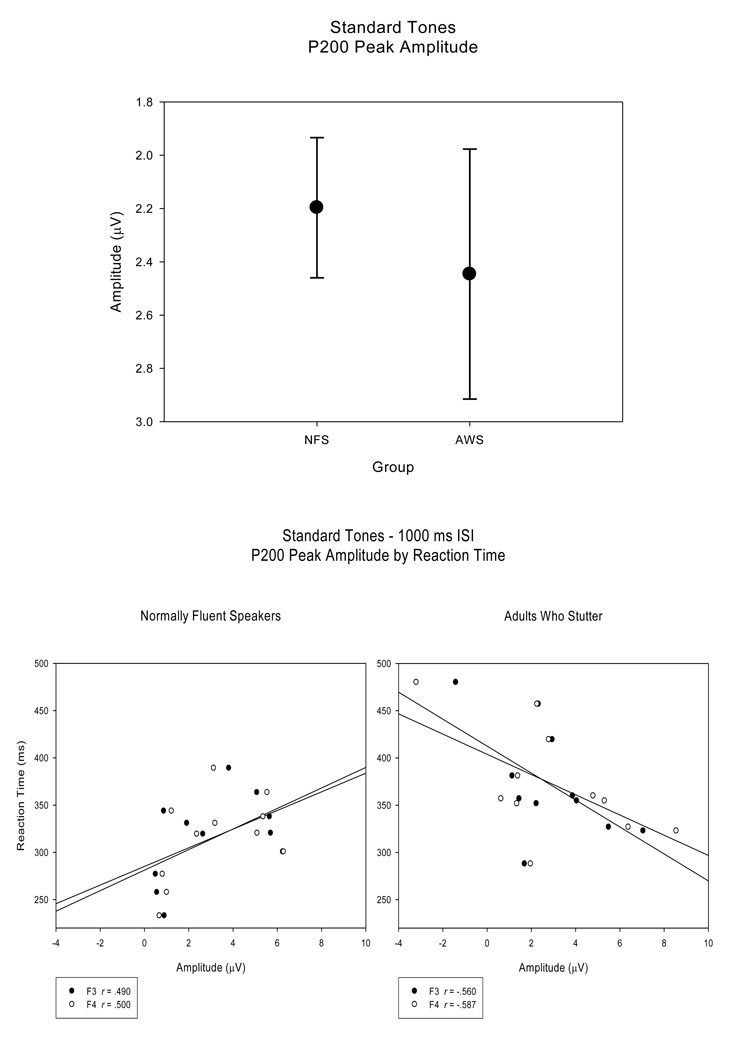
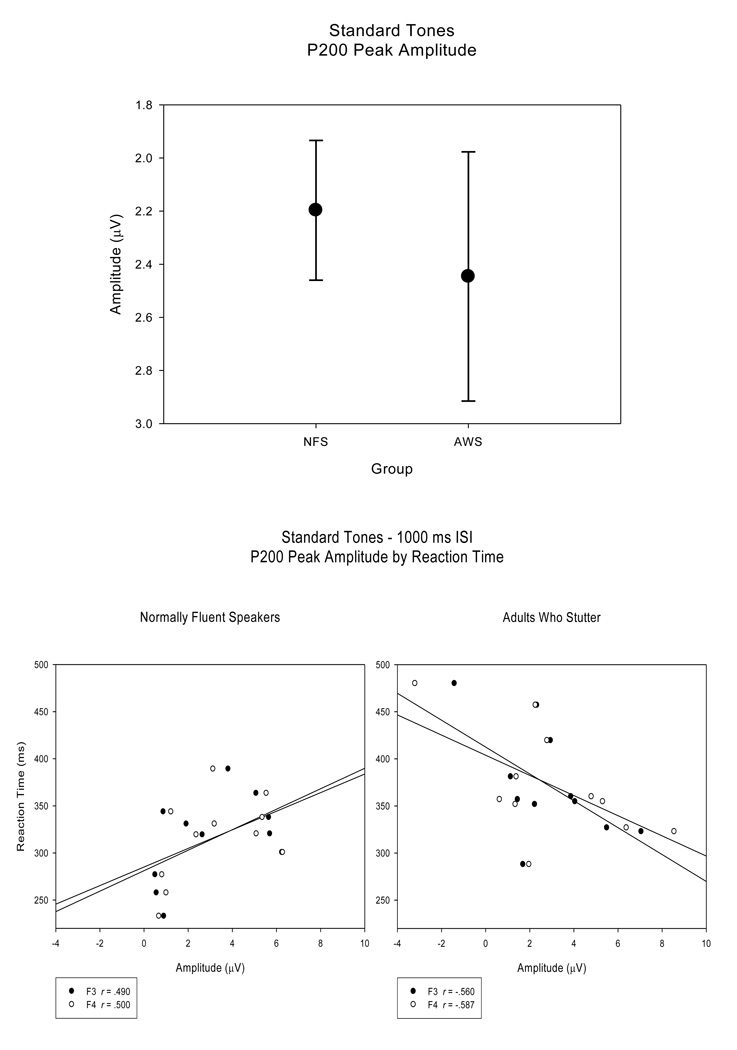
For both groups, the P200 peak amplitudes (SE) were reduced for the short ISI condition (NFS - .19 (.259) µV; AWS - 1.21 (.477) µV) compared to the long ISI condition (NFS - 4.21 (.640) µV; AWS - 3.68 (.613) µV) F (1, 20) = 42.01, H-F p < .001, ep2 = .677. An interaction between group and electrode site revealed that P200 peak amplitudes were larger in the AWS at frontal sites over both left and right hemispheres (F3 and F4) and over the left hemisphere for one fronto-temporal site (FT7) compared to NFS, F (4, 80) = 3.86, H-F p = .008, ep2 = .162, Tukey HSD p < .05. While there were no main group P200 peak amplitude differences between the NFS and the AWS, F (1, 20) < 1, AWS displayed a larger range of P200 peak amplitude values compared to the NFS (Figure 5 top panel). As with N100S peak amplitudes, correlations were not significant between P200 peak amplitudes and RT or accuracy measures in the NFS (r < .500, p > .059). The relationship between P200 peak amplitude and RT is plotted in Figure 5 (bottom panel, left). However, P200 peak amplitude measures of the AWS tended to be correlated with their RT (r > −.560, p < .037) at fronto-central electrodes sites (F3, F4, FC3, and FC4). These correlations trends suggest that AWS who demonstrated faster RTs and higher behavioral accuracy also exhibited larger P200 peak amplitudes. This is exemplified in the scatterplot in Figure 5 (bottom panel, right).
Figure 5.
P200 peak amplitudes (averaged across electrode sites) plotted for the NFS and the AWS reveal that the range of P200 peak amplitudes is larger for the AWS than for the NFS (top panel). Regression plots of P200 peak amplitude (at electrode sites F3 and F4) versus RT for the NFS and the AWS (bottom panel) illustrate the trend toward significant correlation between RT and P200 peak amplitude in the AWS, an association not found for the NFS.
Standard Tones Summary
N100S peak amplitudes correlated with accuracy measures and P200 peak amplitudes correlated with RT in the AWS, relationships not observed in the NFS. These correlation trends suggest that AWS with higher behavioral accuracy and reaction times exhibit larger N100S and P200 peak amplitudes, while those with reduced behavioral measures tend to have smaller peak amplitudes for N100S and P200. These trends between peak amplitudes and behavior were not observed in the NFS.
Target Tones
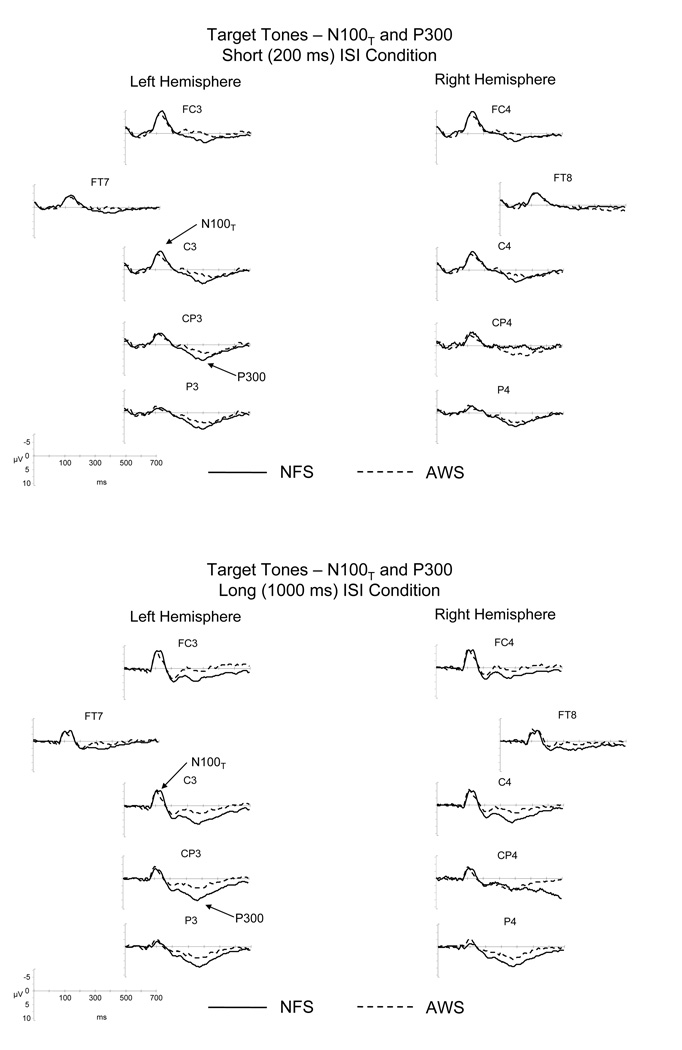
Target tones elicited an early negativity, N100T, followed by a longer latency positivity, P300. This ERP pattern, as illustrated in Figure 6, can be seen in the waveforms of both the NFS and AWS. The similarities and differences in the ERP patterns across the two groups are summarized below.
Figure 6.
Grand average ERPs elicited by the target tones separated by the long and short ISI conditions for the NFS and the AWS. ERPs from lateral and mid-lateral sites over the left and right hemispheres included in the statistical analyses are illustrated. Negative potentials are plotted upward.
N100T
Peak Latency
As with the N100S peak latencies to standard tones, N100T peak latencies to the target tones were similar for the NFS and AWS, F (1, 20) = 1.23, p = .281. N100T peak latencies (SE) for the NFS and AWS were earlier for the long ISI condition, 113.11 (4.47) ms and 120.59 (7.38) ms respectively, compared to the short ISI condition, 125.14 (4.03) ms and 133.38 (6.14) ms, F (1, 20) = 11.12, H-F p = .003, ep2 = .357. For both groups, N100T peak latencies (SE) were earlier over the left hemisphere, 120.91 (3.09) ms, compared to the right hemisphere, 125.20 (4.19) ms, F (1, 20) = 4.68, H-F p = .043, ep2 = .190, consistent with the N100S peak latencies of the standard tones.
Peak Amplitude
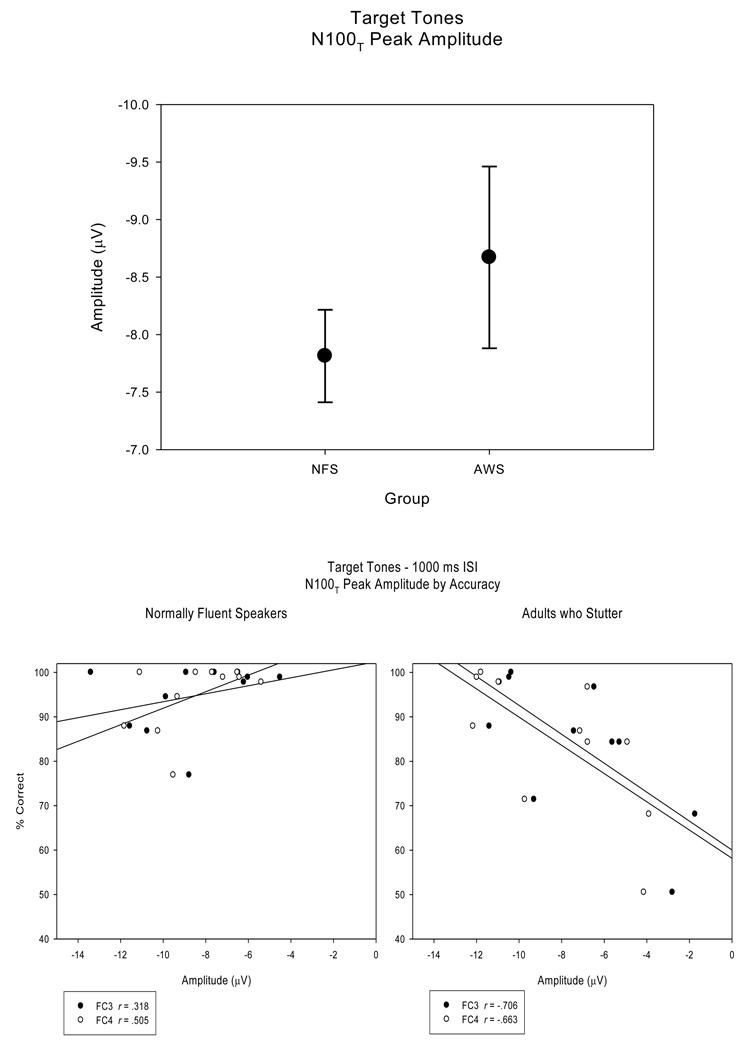
There were no N100T peak amplitude main group effects, F (1, 20) < 1 (Figure 7 top panel). Also, there were no differences between the NFS and the AWS for the long, −7.61 (.469) µV and −8.62 (1.080) µV respectively, and the short ISI condition, −8.02 (.491) µV and −8.73 (.677) µV. The N100T peak amplitudes were larger over midlateral electrode sites (F3/4, FC3/4, C3/4) compared to lateral electrode sites (FT7/8, T7/8), F (4, 80) = 34.44, H-F p < .001, ep2 = .633, Tukey HSD p < .05. The NFS demonstrated less variability (SE) within N100T peak amplitude measures compared to the AWS, as seen in Figure 7 (top panel). Correlations were not significant between N100T peak amplitudes and RT or between N100T peak amplitudes and accuracy (r < .505, p > .057; Figure 7 bottom panel, left). However, for the AWS, correlations were significant between N100T peak amplitudes and RT (r > .674, p < .011) for left hemisphere fronto-central electrode sites (F3, FC3) and tended to be significant for right hemisphere fronto-central electrode sites (F4, FC4; r > .565, p < .035). N100T peak amplitudes and accuracy for the AWS were significantly correlated (r > −.663, p < .013) for frontal-central electrode sites (F3, F4, FC3, FC4, C3, C4). These significant correlations indicate that AWS with slower RTs and reduced behavioral accuracy exhibit smaller N100T peak amplitude measures, a pattern not indicated in the NFS. Figure 7 (bottom panel, right) illustrates the relationship between N100T peak amplitudes and accuracy for the AWS.
Figure 7.
N100T peak amplitudes (averaged across electrode sites) for the target tones are plotted, comparing the NFS and AWS (top panel). As illustrated, the AWS exhibited a larger range of N100T peak amplitude values. Regression plots for the NFS and the AWS (bottom panel) display a significant relationship between N100T peak amplitudes and accuracy in the AWS at electrode sites FC3 and FC4, while the correlation is not significant in the NFS.
P300
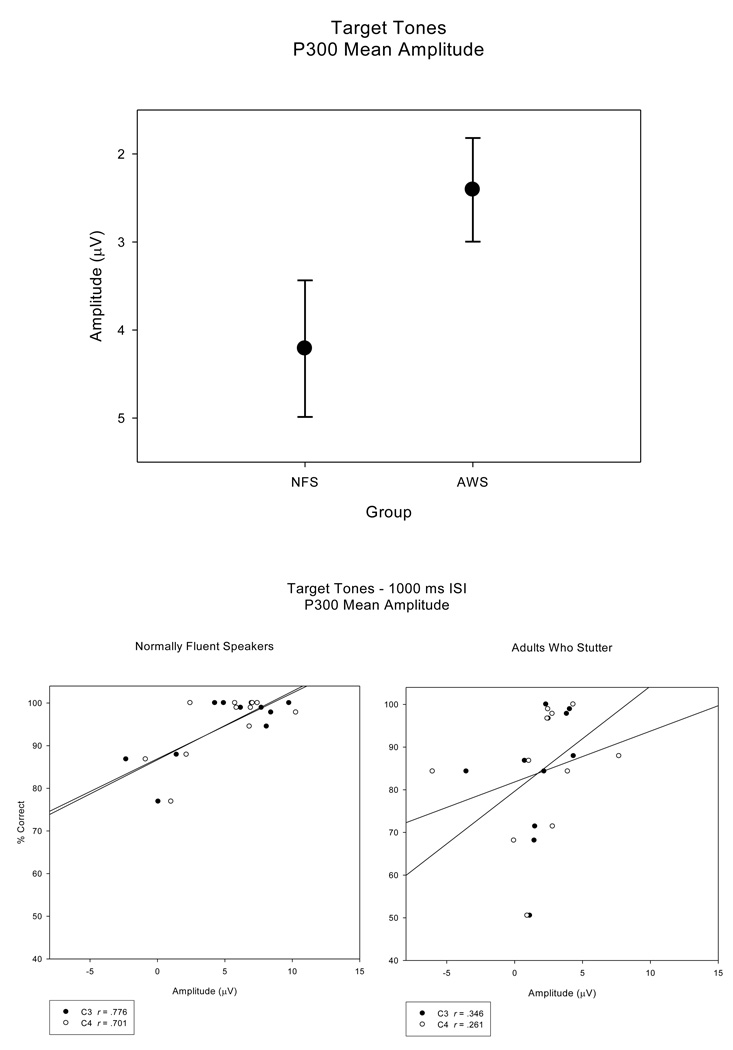
The P300 mean amplitudes for both the NFS and AWS for the short ISI condition, 3.41 (.848) µV and 2.35 (.686) µV respectively, tended to be smaller than P300 mean amplitudes for the long ISI condition, 5.01 (.859) µV and 2.46 (.602) µV, F (1, 20) = 3.70, H-F p = .069, ep2 = .156. Also, the P300 mean amplitudes tended to be larger for the NFS than for the AWS, F (1, 20) = 46.21, H-F p = .079, ep2 = .146, as seen in Figure 8 (top panel). Unlike findings for the earlier potential (N100T) elicited by the target tones, the NFS revealed significant correlations between P300 mean amplitudes and accuracy measures for electrode sites C3, C4, CP3, and CP4 (r > .683, p < .01). These relationships can be seen in Figure 8 (bottom panel, left). Correlations between P300 mean amplitudes and behavioral measures were not significant in the AWS (Figure 8 bottom panel, right). These findings indicate that for the later, cognitive potential, P300, faster RTs and higher accuracy are associated with larger P300 mean amplitudes in the NFS, a pattern not observed in the AWS.
Figure 8.
P300 mean amplitudes (top panel) plotted for NFS and the AWS (averaged across electrode sites) illustrate the trend for reduced P300 mean amplitudes in the AWS. As opposed to the regression plots for the earlier potentials, the regression plots for the NFS and AWS for P300 mean amplitudes (electrode sites C3 and C4; bottom panel) illustrate a significant correlation between accuracy and P300 mean amplitude in the NFS, with no significant correlation in the AWS.
Target Tones Summary
The ERPs of both groups revealed N100T and P300 waveforms elicited by the target tones and, consistent with the standard tones, ERPs to the target tones varied with ISI duration. While there were no group differences for N100T peak amplitudes, AWS exhibited a larger range of peak amplitude measures compared to the NFS. Significant correlations observed in the AWS indicate a relationship between N100T peak amplitudes and behavioral measures, with the AWS who performed faster and more accurately on the target tone detection task exhibited larger N100T peak amplitudes while AWS with reduced behavioral accuracy exhibited smaller N100T peak amplitudes. This relationship was not observed in the NFS. However, for the NFS, significant correlations between P300 mean amplitudes and both RT and accuracy measures indicate that NFS with larger mean amplitudes exhibited faster and more accurate behavioral responses. In contrast, the mean amplitudes of the P300 elicited in the AWS were not systematically related to target tone detection accuracy or reaction time.
Discussion
We examined nonlinguistic, pure-tone auditory processing in AWS and NFS to determine whether behavioral and electrophysiological measures indicated auditory processing deficits in AWS. Behavioral performance based on group results indicated that AWS were slower in detecting target tones, however, the RTs of the majority of the AWS were well within the range of the NFS participants. Only a small subset of AWS displayed poorer performance in detecting target tones. Further, there were no overall group differences in amplitude or latency for the early, perceptual potentials, suggesting that for most part, early perceptual processing of simple, nonlinguistic stimuli functions similarly in AWS and NFS. However, again there were a few AWS who demonstrated ERP measures outside the range of the NFS, and further the AWS with reduced amplitudes of early potentials were also those whose performance was poorer in target tone detection. For the later, cognitive potential, P300, correlations indicated that for NFS, more robust working memory updating may have facilitated accuracy in detecting the target tones. This relationship was not however observed for the AWS.
Speed and Accuracy in Target Tone Detection
Behaviorally, the NFS tended to be more accurate and they responded more quickly than the AWS in detection of target tones. However, the range of behavioral measures was larger for the AWS than for the NFS. Many of the AWS displayed accuracy and RT measures that overlapped with those of the NFS, while a small subset of AWS performed with decreased accuracy and slower RTs. Therefore, behavioral findings indicate that functionally, a small subset of the AWS may exhibit an auditory processing deficit even for relatively simple tonal stimuli. Additionally, the current behavioral results are consistent with the idea that non-linguistic auditory processing skills are heterogeneous in AWS and support the need for examining individual data and not drawing generalized conclusions based on group data alone.
Early Perceptual Processing
Consistent with previous research (Neville et al, 1993; Polich, 1990), the N100S and P200 peak amplitude measures were larger for the long ISI condition compared to those for the short ISI condition. These amplitude differences as a function of ISI were similar across NFS and AWS. As indicated by earlier work, reduced recovery times for neurons results in fewer neurons firing synchronously, therefore leading to smaller amplitudes for the shorter ISI condition (Nunez, 1995; Polich, 1990). The current findings reveal that these neural processes operate similarly in NFS and AWS.
No overall group differences were observed for the amplitudes or peak latencies of the early perceptual potentials of N100S, N100T, and P200 for both the standard and target tones. These findings are consistent with MEG results for cortical potentials peaking at ~100ms (Biermann-Ruben, et al., 2005) and extend these findings to include perceptual processing occurring slightly later, ~200ms. However, similar to the findings for behavioral performance, the ERPs of the AWS had a larger range of peak amplitudes than the NFS. In the AWS, correlations between peak amplitudes and behavioral measures indicated that AWS with larger N100S, N100T, and P200 peak amplitude measures displayed faster RTs and more accurate behavioral responses. This relationship suggests that the AWS with larger N100S, N100T, and P200 peak amplitudes likely had a stronger, more salient representation of the stimulus in the auditory system, which may have facilitated faster, more accurate, behavioral responses. It follows that the subset of AWS with reduced amplitudes in their early cortical potentials had a weaker representation of the auditory signal, which may have contributed to slower reaction times and reduced accuracy. The correlations between amplitudes of perceptual potentials and behavioral performance were more robust for the target tones compared to those for the standard tones. It is possible that because the behavioral response is elicited by the target tones, the relationship between actual behavioral performance and the ERPs elicited by the targets is more closely linked. The correlation patterns between behavioral performance and early cortical potentials observed in the AWS were not reflected in the NFS. One possibility is that the range of both the behavioral responses (all high) and amplitudes of the early cortical potentials (all large) was too restricted for observing a linear relationship between these processes.
P300 Indices of Working Memory Updating
The P300 is a later, cognitive component thought to index the process of updating working memory (Rohrbaugh et al., 1990; Polich & Kok, 1995). Consistent with previous studies (Polich, 1990), P300 mean amplitudes for both groups were reduced for the short ISI condition compared to the long ISI condition indicating similar neural functions for these processes in AWS and NFS. However, the P300 mean amplitude measures tended to be reduced overall for the AWS compared to the NFS. Increases in P300 amplitudes have been related to an orienting response and internal neural representations as well as to the attentional resources available in the processing system for a specific stimulus (Polich & Kok, 1995). These theories are supported by research findings that larger P300 amplitudes correlate with enhanced memory performance and P300 amplitudes decrease with habituation (Polich & Kok, 1995). The tendency for reduced P300 mean amplitudes for the AWS may indicate that, for a subset of AWS, updating of working memory in response to the target tone was reduced in efficiency. Previous ERP findings for C3/C4 indicated that some AWS may exhibit a different hemispheric distribution for the P300 compared to NFS (Morgan et al., 1997). Those findings were not replicated in the current study which included more electrode sites as well as a behavioral task.
The relationship between P300 mean amplitudes and accuracy in target tone detection was significant for the NFS. The findings indicated that for the NFS, more robust updating in working memory processes, (indexed by larger P300 mean amplitudes), may facilitate greater accuracy and faster reaction times in detecting target tones. In contrast, the relationship between P300 mean amplitudes and behavior were not systematic in AWS. It is not clear why this relationship was different for the AWS however, it may be related to a basal effect since the P300 tended to be less robust in the AWS.
Conclusions
Behavioral and electrophysiological measures indicate that most AWS display nonlinguistic auditory processing abilities that are overlapping with those of NFS. However, a small subset of AWS may disply atypical non-linguistic auditory processing even for simple, tonal stimuli. Many theories of stuttering postulate that auditory processing deficits play a role in the disorder (Bloodstein, 1995; Guitar, 1998; Lawrence & Barclay, 1998). In a multifactorial model of stuttering, which acknowledges auditory processing as one of many factors that can contribute to stuttering (Smith, 1990; Smith & Kelly, 1997), it his hypothesized that factors are weighted differently in different individuals in terms of their contribution to stuttering. The current findings indicate that non-lingustic auditory processing may play a significant role in only a subset of adults who stutter. These findings may also account for previous inconsistencies in the literature for the presence of auditory processing deficits in stuttering. Within small groups of participants, it appears that some AWS will and some AWS will not display auditory processing deficits. This current findings demonstrate the need to examine how measures of AWS vary across individuals so that findings from group analyses can be interpreted in light of the distribution of measures across this heterogeneous population.
References
- American Electroencephalographic Society. Guideline thirteen: Guidelines for standard electrode placement nomenclature. Journal of Clinical Neurophysiology. 1994;11:111–113. [PubMed] [Google Scholar]
- Biermann-Ruben K, Salmelin R, Schnitzler A. Right rolandinc activation during speech perception in stutterers: a MEG study. NeuroImage. 2005;25:793–801. doi: 10.1016/j.neuroimage.2004.11.024. [DOI] [PubMed] [Google Scholar]
- Blood IM. Disruptions in auditory and temporal processing in adults who stutter. Perceptual and Motor Skills. 1996;82:272–274. doi: 10.2466/pms.1996.82.1.272. [DOI] [PubMed] [Google Scholar]
- Bloodstein O. A handbook on stuttering. San Diego, CA: Singular Publishing Group; 1995. [Google Scholar]
- Cross D. Finger reaction time of stuttering and nonstuttering children and adults. Asha. 1978;20:730. doi: 10.1044/jshr.2603.356. [DOI] [PubMed] [Google Scholar]
- Cross D, Luper H. Relation between finger reaction time and voice reaction time in stuttering and nonstuttering children and adults. Journal of Speech and Hearing Research. 1983;26:356–361. doi: 10.1044/jshr.2603.356. [DOI] [PubMed] [Google Scholar]
- Curlee RF, Siegel GM, editors. Nature and treatment of stuttering: New directions. Boston: Allyn & Bacon; 1997. [Google Scholar]
- Dietrich S, Barry SJ, Parker DE. Middle latency auditory responses in males who stutter. Journal of Speech and Hearing Research. 1995;38:5–17. doi: 10.1044/jshr.3801.05. [DOI] [PubMed] [Google Scholar]
- Guitar B. Stuttering: An integrated approach to its nature and treatment. Philadelphia: Lippincott, Williams, & Wilkins; 1998. [Google Scholar]
- Hall JW, Jerger J. Central auditory function in stutterers. Journal of Speech and Hearing Research. 1978;21:324–337. doi: 10.1044/jshr.2102.324. [DOI] [PubMed] [Google Scholar]
- Hammill DD, Brown VL, Larsen SC, Wiederholt JL. Test of Adolescent and Adult Language – Third Edition (TOAL-3) Austin, TX: Pro-Ed.; 1994. [Google Scholar]
- Hannley M, Dorman MF. Some observations on auditory function and stuttering. Journal of Fluency Disorders. 1982;7:93–108. [Google Scholar]
- Hays M. Statistics. Fifth Edition. Fort Worth, TX: Harcourt Brace College Publishers; 1994. [Google Scholar]
- Hyde M. The N1 response and its applications. Audiology & Neuro-otology. 1997;2:281–307. doi: 10.1159/000259253. [DOI] [PubMed] [Google Scholar]
- Kalinowski J, Armson J, Roland-Meiszkowski M, Stuart A, Gracco VL. Effects of alterations in auditory feedback and speech rate on stuttering frequency. Language and Speech. 1993;36:1–16. doi: 10.1177/002383099303600101. [DOI] [PubMed] [Google Scholar]
- Kramer MB, Green D, Guitar B. A comparison of stutterers and nonstutterers on masking level differences and synthetic sentence identification tasks. Journal of Communication Disorders. 1987;20:379–390. doi: 10.1016/0021-9924(87)90026-8. [DOI] [PubMed] [Google Scholar]
- Lawrence M, Barclay DM., III Stuttering: A brief review. American Family Physician. 1998;57:2175–2178. [PubMed] [Google Scholar]
- Luck S. An introduction to the event-related potential technique. Cambridge, MA: The MIT Press; 2005. [Google Scholar]
- Manning WH. Clinical decision making in fluency disorders. Second edition. Vancouver, Canada: Singular; 2001. [Google Scholar]
- Morgan MD, Cranford JL, Burk K. P300 event-related potentials in stutterers and nonstutterers. Journal of Speech, Language, and Hearing Research. 1997;40:1334–1340. doi: 10.1044/jslhr.4006.1334. [DOI] [PubMed] [Google Scholar]
- Neville HJ, Coffey SA, Holcomb PJ, Tallal P. The neurobiology of sensory and language processing in language-impaired children. Journal of Cognitive Neuroscience. 1993;5:235–253. doi: 10.1162/jocn.1993.5.2.235. [DOI] [PubMed] [Google Scholar]
- Nunez PL. Neocortical dynamics and human EEG rhythms. New York: Oxford University Press; 1995. [Google Scholar]
- Oldfield RC. The assessment and analysis of handedness: The Edinburgh Inventory. Neuropsychologia. 1971;9:97–113. doi: 10.1016/0028-3932(71)90067-4. [DOI] [PubMed] [Google Scholar]
- Polich J. Probability and inter-stimulus interval effects on the P300 from auditory stimuli. International Journal of Psychophysiology. 1990;10:163–170. doi: 10.1016/0167-8760(90)90030-h. [DOI] [PubMed] [Google Scholar]
- Polich J, Kok A. Cognitive and biological determinants of P300: An integrative review. Biological Psychology. 1995;41:103–146. doi: 10.1016/0301-0511(95)05130-9. [DOI] [PubMed] [Google Scholar]
- Ratner NB. Stuttering: A psycholinguistic perspective. In: Curlee RF, Siegel GM, editors. Nature and treatment of stuttering: New directions. 2nd ed. Boston: Allyn and Bacon; 1997. pp. 99–127. [Google Scholar]
- Riley GD. A Stuttering Severity Instrument for Children and Adults – Third Edition (SSI-3) Austin, TX: Pro-Ed.; 1994. [DOI] [PubMed] [Google Scholar]
- Rohrbaugh JW, Parasuraman R, Johnson R., Jr . Event-related brain potentials: Basic issues and applications. New York: Oxford University Press; 1990. [Google Scholar]
- Rosenfield DB, Jerger J. Stuttering and auditory function. In: Curlee RF, Perkins WH, editors. Nature and treatment of stuttering: New directions. San Diego: College-Hill Press; 1984. pp. 73–87. [Google Scholar]
- Salmelin R, Schnitzler A, Schmitz F, Jancke L, Witte OW, Freund H-J. Functional organization of the auditory cortex is different in stutterers and fluent speakers. NeuroReport. 1998;9:2225–2229. doi: 10.1097/00001756-199807130-00014. [DOI] [PubMed] [Google Scholar]
- Smith A. Factors in the etiology of stuttering. ASHA Reports. 1990;18:39–47. [Google Scholar]
- Smith A, Kelly E. Stuttering: A dynamic, multifactorial model. In: Curlee RF, Siegel GM, editors. Nature and treatment of stuttering: New directions. 2nd ed. Boston: Allyn and Bacon; 1997. pp. 204–217. [Google Scholar]
- Stager SV. Heterogeneity in stuttering: Results from auditory brainstem response testing. Journal of Fluency Disorders. 1990;15:9–19. [Google Scholar]
- Starkweather C, Franklin S, Smigo T. Vocal and finger reaction times in stutterers and nonstutterers: Differences and correlations. Journal of Speech and Hearing Research. 1984;27:193–196. doi: 10.1044/jshr.2702.193. [DOI] [PubMed] [Google Scholar]
- Toscher MM, Rupp RR. A study of the central auditory processes in stutterers using the Synthetic Sentence Identification (SSI) test battery. Journal of Speech and Hearing Research. 1978;21:779–792. doi: 10.1044/jshr.2104.779. [DOI] [PubMed] [Google Scholar]


