Abstract
The water channel aquaporin 1 (AQP1) and certain Rh-family members are permeable to CO2 and NH3. Here, we use changes in surface pH (pHS) to assess relative CO2 vs. NH3 permeability of Xenopus oocytes expressing members of the AQP or Rh family. Exposed to CO2 or NH3, AQP1 oocytes exhibit a greater maximal magnitude of pHS change (ΔpHS) compared with day-matched controls injected with H2O or with RNA encoding SGLT1, NKCC2, or PepT1. With CO2, AQP1 oocytes also have faster time constants for pHS relaxation (τpHs). Thus, AQP1, but not the other proteins, conduct CO2 and NH3. Oocytes expressing rat AQP4, rat AQP5, human RhAG, or the bacterial Rh homolog AmtB also exhibit greater ΔpHS(CO2) and faster τpHs compared with controls. Oocytes expressing AmtB and RhAG, but not AQP4 or AQP5, exhibit greater ΔpHS(NH3) values. Only AQPs exhibited significant osmotic water permeability (Pf). We computed channel-dependent (*) ΔpHS or Pf by subtracting values for H2O oocytes from those of channel-expressing oocytes. For the ratio ΔpHS(CO2)*/Pf*, the sequence was AQP5 > AQP1 ≅ AQP4. For ΔpHS(CO2)*/ΔpHS(NH3)*, the sequence was AQP4 ≅ AQP5 > AQP1 > AmtB > RhAG. Thus, each channel exhibits a characteristic ratio for indices of CO2 vs. NH3 permeability, demonstrating that, like ion channels, gas channels can exhibit selectivity.
Keywords: gas channel, oocyte, permeability, signal peptide, surface pH measurement
Gas transport through membranes is of fundamental importance for nutritive transport, photosynthesis, oxidative metabolism, and signaling. For most of the past century, we assumed that gas molecules cross biological membranes merely by diffusing through the lipid phase. This dogma was challenged by 2 observations: (i) Apical membranes of gastric-gland cells have no demonstrable permeability to CO2 or NH3 (1). (ii) Heterologous expression of the water channel aquaporin 1 (AQP1) increases the CO2 permeability of Xenopus oocytes (2). Cooper and Boron (3) and Prasad et al. (4) confirmed and extended this observation. Uehlein (5) showed that an AQP plays a physiological role by enhancing CO2 uptake by plants. Endeward et al. (6) demonstrated that AQP1 accounts for ≈60% of the CO2 permeability of human red blood cells (RBCs). Molecular dynamics simulations suggest that CO2 can pass through the 4 aquapores of an AQP1 tetramer (7) and especially through the central pore between the 4 monomers (7). Additional data indicate that AQP1 is permeable to nitric oxide (8), and that—when expressed in Xenopus oocytes (9, 10) or when reconstituted into planar lipid bilayers (11)—AQP1, AQP3, AQP8, AQP9, and the plant aquaporin TIP2;1 are all permeable to NH3.
The AmtB/MEP/Rh proteins represent a second family of gas channels (12–15). Early work showed that AmtB and MEP transport NH3 or NH4+, thereby playing a nutritive role in archaea, bacteria, and fungi (16, 17). The crystal structures of the bacterial AmtB (18–20) and Rh50 (21) and the fungal Amt-1 (22) are consistent with the idea that NH3 passes through a pore in each monomer of the homotrimer. Indeed, reconstituted AmtB conducts NH3 (14), and RhAG is necessary for NH3 transport in mammalian RBCs (23). Soupene et al. found that Rh1 deficiency impairs the growth of the green alga C. reinhardtii (24) and suggested that Rh1 plays a role in CO2 transport. In RBCs, RhAG accounts for ≈50% of CO2 transport (25).
In 2006, we introduced an approach (6) to assess CO2 transport by pushing a blunt microelectrode against the surface of an oocyte, while monitoring surface pH (pHS). Introducing extracellular CO2 causes a transient pHS increase, the maximum magnitude of which (ΔpHS) is an index of maximal CO2 influx. Earlier, De Hemptinne and Huguenin (26) had observed such a CO2-induced transient while monitoring extracellular pH (pHo) of rat soleus muscle. Moreover, Chesler (27) had found that exposing lamprey neurons to NH3 causes a transient decreases in pHo. Here, we exploit CO2- and NH3-induced pHS transients to study the CO2 vs. NH3 permeability of 4 channels abundantly expressed in cells that mediate high rates of gas transport: human AQP1 (RBCs; ref. 28), the M23 variant of rat AQP4 (astrocytic endfeet at the blood–brain barrier, ref. 29), rat AQP5 (alveolar type I pneumocytes; ref. 30), and human RhAG (RBCs, ref. 31). We also studied bacterial AmtB. Our results show that all 5 channels are permeable to CO2, and all but AQP4 and AQP5 are permeable to NH3. A relative index of CO2/NH3 permeability varied widely: AQP4 ≅ AQP5 > > AQP1 > AmtB > RhAG. Thus, as is true for ion channels, gas channels exhibit substantial solute selectivity, which could play an important physiological role in controlling gas fluxes.
Results
pHS Transients Caused by Applying CO2 vs. NH3.
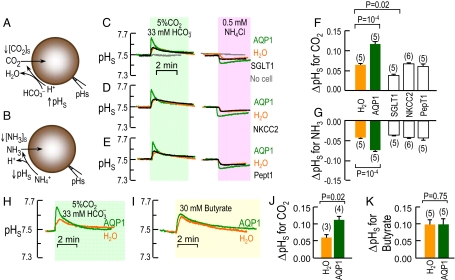
Fig. 1A illustrates schematically how the influx of CO2 leads to a fall in [CO2] near the extracellular surface of the membrane ([CO2]S), which in turn leads to a rise in pHS. Fig. 1B shows how the influx of NH3 leads to a fall in pHS. As described in ref. 6, exposing an AQP1-expressing oocyte to a solution containing 5% CO2/33 mM HCO3− at a constant pH of 7.50 causes a transient rise in pHS, followed by an exponential decay (Fig. 1C Left, green record). After the washout of CO2 (see SI Text and Fig. S3), exposing the same oocyte to 0.5 mM NH3/NH4+ causes a transient fall in pHS (Fig. 1C Right, green record), as noted elsewhere (32). Additional data are consistent with the hypothesis that Xenopus oocytes handle NH3 in an unusual way, sequestering most incoming NH3 in an intracellular compartment as NH4+ (32).
Fig. 1.
Basis of surface pH changes. (A) CO2 influx. At the outer surface of the membrane, the CO2 influx creates a CO2 deficit. The reaction HCO3− + H+ → CO2 + H2O, in part, replenishes the CO2, raising pHS. (B) NH3 influx. The reaction NH4+ → NH3 + H+, in part, replenishes NH3, lowering pHS. (C–E) Representative pHS transients from oocytes injected with H2O or expressing AQP1 (record repeated in the 3 images), SGLT1, NKCC2, or PepT1. All data in C–E were obtained on the same day, from the same batch of oocytes, exposed first to CO2/HCO3− and then (after CO2 removal) to NH3/NH4+. Also shown in C are records with no oocyte present. Before and after solution changes, we retracted the pH electrode to the bulk extracellular solution (pH 7.50) for calibration. (F and G) Summary of extreme excursions of pHS (ΔpHS) for CO2 and NH3 data. (H and I) Representative pHS transients from day-matched H2O or AQP1 oocytes exposed to CO2/HCO3− or 30 mM butyrate. (J and K) Summary of ΔpHS for experiments like those in H or I. Values are means ± SE, with numbers of oocytes in parentheses. For F and G, statistical comparison between H2O-injected controls and other oocytes (separately for CO2 and NH3 data) were made using a 1-way ANOVA for 5 groups, followed by Dunnett's multiple comparison. ΔpHS values for H2O, NKCC2, and PepT1 do not differ from one other. For J and K, statistical comparisons were made using unpaired 2-tailed t tests.
The maximal pHS transients are much smaller in day-matched oocytes injected with H2O (orange) or cRNA encoding the Na/glucose cotransporter SGLT1 (black), and are totally lacking in the absence of an oocyte (gray). Moreover, oocytes expressing the Na/K/Cl cotransporter NKCC2 or the H/oligopeptide cotransporter PepT1 have ΔpHS values similar to those of H2O-injected oocytes (Fig. 1 D and E).
Fig. 1 F and G summarize ΔpHS data for a larger number of experiments like those in Fig. 1 C–E and show that ΔpHS for AQP1 is significantly greater than for all other oocyte groups. As expected, the time constant (τpHs) for the decay of pHS from its peak, an index of the time required for CO2 to equilibrate across the membrane, has a pattern that is the inverse of that for ΔpHS (Fig. S1 A and B). Because of the oocyte's unusual NH3 handling, the pHS relaxation during NH3 exposures is prolonged, precluding the calculation of a τpHs for NH3. In the CO2 protocol, the smaller ΔpHS for SGLT1 vs. H2O oocytes could reflect a decrease in the expression of other proteins or an increase in membrane–protein/lipid ratio.
Given our observations with CO2, one might ask whether AQP1 also would enhance the flux of a permeant weak acid like butyric acid (33). While confirming that AQP1 increases the ΔpHS in oocytes exposed to CO2 (Fig. 1 H and J), we found that the channel has no effect either on ΔpHS (Fig. 1 I and K) or τpHs (Fig. S1 C and D) in oocytes exposed to butyric acid.
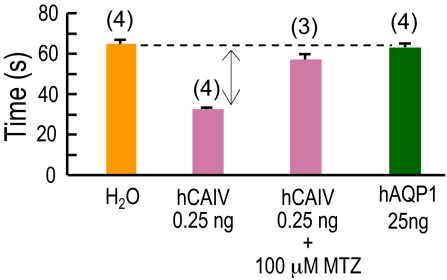
In principle, AQP1 could enhance the CO2-induced pHS spike in Fig. 1 C or H, not because AQP1 is a CO2 channel, but because it has unanticipated carbonic anhydrase (CA) activity and thus catalyzes the extracellular reaction HCO3− + H+ → CO2 + H2O (see Fig. 1A). To test the CA hypothesis, we injected oocytes with cRNA encoding CA IV, coupled via a GPI linkage to the outer surface of the membrane. Increased CA-IV expression causes a graded increase in ΔpHS (Fig. S2), and we determined the dose of CA-IV cRNA that produces the same ΔpHS as a typical AQP1 oocyte. Fig. 2 shows that membrane preparations of oocytes injected with this dose of CA-IV cRNA, compared with those from H2O oocytes, require a much shorter time to achieve a pH endpoint in a CA assay. However, membrane preparations of AQP1 oocytes are indistinguishable from those of H2O, allowing us to rule out the CA hypothesis. Thus, on the basis of ΔpHS and τpHs measurements, AQP1, but not SGLT1, NKCC1, and PepT1, acts as a channel for CO2 and NH3.
Fig. 2.
Carbonic anhydrase activities of Xenopus oocytes. CA activity was determined from membrane preparations of 100 oocytes injected with H2O, 0.25 ng of cRNA encoding hCA IV, or 25 ng of cRNA encoding hAQP1. We divided each membrane preparation into aliquots containing 20 μg of total protein and performed a colorimetric CA assay on each aliquot (see SI Text). The sample mixtures containing CA-IV were run ± 100 μM methazolamide (MTZ), a CA inhibitor. Each N refers to a CA assay on 1 aliquot.
Comparison of AQPs with AmtB and RhAG.
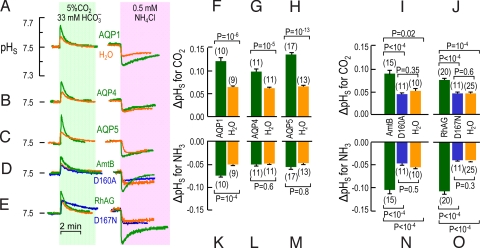
Using the same protocol shown in Fig. 1 C–E, we systematically examined the effects of sequential exposures to CO2/HCO3− and then NH3/NH4+ on oocytes expressing AQP1, AQP4, AQP5, AmtB, or RhAG. Fig. 3A shows again that CO2 and NH3 elicit larger pHS spikes in AQP1 (green) than in day-matched H2O (orange) oocytes. Both AQP4 (Fig. 3B) and AQP5 (Fig. 3C) enhance the pHS spike with CO2 but not with NH3. Both AmtB (Fig. 3D) and RhAG (Fig. 3E) enhance the pHS spike with CO2 but are especially effective with NH3. Asp160 is vital for AmtB activity (19, 34), and the homologous Asp167 is required by RhAG (35). We found that the inactive D160A mutant of AmtB (34, 36) and the inactive D167N mutant of RhAG (35) are inactive as either CO2 or NH3 channels, presumably because the mutations cause major structural changes (35). Figs. S3 and S4 A and D show full-length experiments similar to those in Fig. 3 A–E.
Fig. 3.
Surface pH changes caused by CO2 and NH3 influx in oocytes expressing gas-channel proteins. (A–E) Typical pHS transients from oocytes injected with H2O or expressing AQP1, AQP4, AQP5, WT AmtB or its inactive D160A mutant, or WT RhAG or its inactive D167A mutant. The protocol was the same as in Fig. 1. (F–J) Summary of extreme excursions of pHS (ΔpHS) caused by CO2 influx. Each image represents mean values for day-matched oocytes. (K–O) Summary of ΔpHS caused by NH3 influx. Each image (F–O) represents mean values for day-matched oocytes. Some H2O oocytes served as controls in more than 1 panel (total number of H2O oocytes: 54 for CO2, 61 for NH3). Values are means ± SE, with numbers of oocytes in parentheses. For F–H and K–M, statistical comparisons were made using unpaired 2-tailed t tests. For I and J and N and O, statistical comparisons were made using 1-way ANOVAs for 3 groups, followed by Student–Newman–Keuls analyses.
In the above experiments, all AmtB and RhAG constructs were C-terminally tagged with EGFP (enhanced GFP), and fluorescence measurements confirmed trafficking to near the oocyte surface. The tagged and untagged constructs yielded identical results in pHS assays (Fig. S4).
Fig. 3 F–J are analogous to Fig. 1F, except that in Fig. 3 F–J, we pair each oocyte expressing a WT or mutant channel with its day-matched H2O-injected control. Each WT protein yields a ΔpHS that is significantly greater than the H2O control or (as applicable) the mutant protein. Moreover, the ΔpHS values of the mutants are not different from the corresponding H2O oocytes. Fig. 3 K–O is a summary of the NH3 data. The results are comparable to the CO2 data, except that the magnitudes of ΔpHS for AQP4 and AQP5 in the NH3 protocol are not different from those of their corresponding H2O-injected controls. Fig. S5 shows that the relationship for the τpHs values is the inverse of that for the ΔpHS values in Fig. 3. Thus, each of the proteins, AQP1, AQP4, AQP5, AmtB, and RhAG, is permeable to CO2. Moreover, AQP1, AmtB, and RhAG, but not AQP4 or AQP5, are permeable to NH3.
Cleavage of AmtB Signal Peptide by Oocytes.
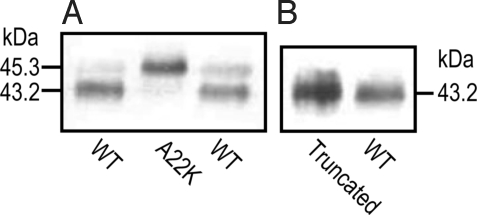
Our AmtB cDNA encodes a signal peptide that Escherichia coli naturally cleaves (37), so that the new N terminus is extracellular. The A22K point mutation in AmtB prevents the cleavage in E. coli, although the mutant AmtB still forms trimers and is active (37). To verify that Xenopus oocytes also cleave the signal peptide, we added a C-terminal His tag to WT AmtB, A22K-AmtB, and an AmtB variant with the signal peptide truncated. Fig. 4 shows Western blots of plasma-membrane preparations from oocytes expressing the 3 constructs. The molecular mass of the major band of WT AmtB is appropriately less than that of A22K-AmtB, but the same as truncated AmtB. Thus, oocytes do indeed cleave the signal peptide of WT AmtB. Densitometry indicates that >90% of the AmtB in oocytes is appropriately cleaved. Additional data reveal that AmtB-His is active as both a CO2 and an NH3 channel.
Fig. 4.
Western blots testing cleavage of the AmtB signal peptide in Xenopus oocytes. (A) Wild-type AmtB vs. uncleavable A22K mutant. (B) Wild-type AmtB vs. AmtB with truncated signal peptide. Data are representative of 4 similar experiments. All constructs were His tagged at the C terminus and detected with an anti-His antibody.
Pf in Oocytes Expressing Different Channels.
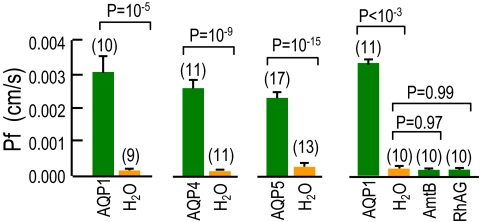
So that we could relate our CO2 and NH3 data to the wealth of information on the osmotic water permeability (Pf) of AQP-expressing oocytes, we determined Pf for each AQP oocyte and its day-matched control from the dataset in Fig. 3. As summarized by the 3 pairs of bars on the left side of Fig. 5, the mean Pf value for each AQP was significantly and substantially greater than the matched controls. We separately assessed Pf for matched oocytes expressing AQP1, AmtB, or RhAG vs. day-matched H2O oocytes. The right side of Fig. 5 shows that only for AQP1 oocytes was the mean Pf value significantly greater than that for H2O oocytes; the Pf values for H2O, AmtB, and RhAG oocytes were not significantly different from one another. Thus, despite the hypothesized presence of H2O in the NH3 pore of AmtB (20, 22), the 2 Rh proteins do not function as water channels.
Fig. 5.
Osmotic water permeabilities of Xenopus oocytes. Pf (cm/s) of oocytes injected with H2O or cRNA encoding AQP1, AQP4, AQP5, AmtB, or RhAG. Values are means ± SE, with numbers of oocytes in parentheses. Statistical comparison between H2O vs. AQP oocytes were made using unpaired 2-tailed t tests. Statistical comparisons among the 4 groups were made using a 1-way ANOVA, followed by Student–Newman–Keuls analyses.
Discussion
Channel-Dependent ΔpHS and Pf Values.
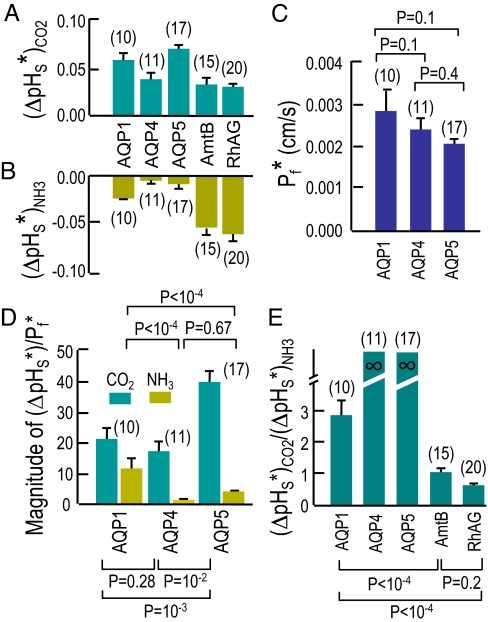
Given our experimental design, the magnitude of ΔpHS is a semiquantitative index of both the flux of, and membrane permeability to, CO2 or NH3. For CO2, the same is true of τpHs. Note that the quantitative relationship between ΔpHS on the one hand and absolute flux or permeability on the other is likely to be different for CO2 vs. NH3. The portion of the CO2-induced ΔpHS signal that we can ascribe to a particular channel is the difference between the ΔpHS of each channel-expressing oocyte (e.g., green record in Fig. 3A) and the ΔpHS of its day-matched H2O-injected control (e.g., orange record in Fig. 3A). Fig. 6A summarizes these differences, the channel-dependent signal (ΔpHS*)CO2, for the CO2 data, computed oocyte by oocyte. Similarly, Fig. 6B summarizes the analogous differences, the channel-specific signal (ΔpHS*)NH3, for the NH3 data. Note that the mean (ΔpHS*)NH3 values for AQP4 and AQP5 are not significantly different from zero.
Fig. 6.
Comparison of channel-dependent properties. (A) Indices of channel-dependent CO2 permeability. For each ΔpHS from a channel-expressing oocyte, we subtracted the mean, day-matched ΔpHS for H2O oocytes. Bars represent mean subtracted values, the channel-dependent ΔpHS for CO2, or (ΔpHS*)CO2. Note: Oocytes in A are the same as those in B and C. (B) Indices of channel-dependent NH3 permeability. We computed (ΔpHS*)NH3 using the same approach as in A. (C) Channel-dependent water permeabilities. For each Pf from a channel-expressing oocyte, we subtracted the mean, day-matched Pf for H2O oocytes. Bars represent mean subtracted values, the channel-dependent Pf, or Pf*. (D) Indices of channel-dependent CO2 and NH3 permeability, normalized to Pf*. For each oocyte, we divided (ΔpHS*)CO2 and (ΔpHS*)NH3 by its Pf*. (E) Indices of gas selectivity. For each oocyte expressing AQP1, AmtB, or RhAG, we divided (ΔpHS*)CO2 by −(ΔpHS*)NH3. Because (ΔpHS*)NH3 was not significantly different from zero for oocytes expressing AQP4 or AQP5, we represent these ratios as “infinity.” Statistical comparisons were made using 1-way ANOVAs for 3 groups, followed by Student–Newman–Keuls analyses.
Ratios of Indices of Permeability.
Because we do not know the number of AQP molecules at the plasma membrane in each oocyte, it is impossible to normalize our (ΔpHS*)CO2 or (ΔpHS*)NH3 data to protein abundance. However, for each AQP oocyte, we also have a channel-dependent Pf (Pf*), summarized in Fig. 6C. For each oocyte, we divided (ΔpHS*)CO2 or (ΔpHS*)NH3 by Pf*. Fig. 6D summarizes these mean values, which represent semiquantitative indices of the CO2/H2O or NH3/H2O permeability ratios. By a factor of 2, AQP5 has the highest (ΔpHS*)CO2/Pf*, and the values for AQP1 and AQP4 are indistinguishable.
Because we have both (ΔpHS*)CO2 and (ΔpHS*)NH3 for each of a large number of oocytes, it is also possible to compute the ratio (ΔpHS*)CO2/(ΔpHS*)NH3, a relative index of the CO2/NH3 permeability ratio, for AQP1, AmtB, and RhAG. Fig. 6E summarizes these values. Because (ΔpHS*)NH3 for AQP4 and AQP5 do not differ from zero, the ratios for these proteins are theoretically infinite. Thus, among the channels tested, AQP4 and AQP5 have the highest CO2/NH3 permeability ratios, followed by AQP1, AmtB, and RhAG. Conversely, RhAG has the highest NH3/CO2 permeability ratio (see Fig. S6).
Thus, compared with the AQPs tested, the Rh-like proteins tested are relatively more selective for NH3, whereas the AQPs are relatively more selective for CO2.
Significance.
Our data demonstrate that channel proteins can exhibit gas selectivity by channel proteins. The basis of the selectivity is probably not the size of the transiting molecules—H2O, CO2, and NH3 have similar minimum diameters—but rather their chemistries and the chemistries of the monomeric pores vs. the pore at the center of the multimers. The electronic configuration of NH3 is identical to that of H2O, which moves exclusively through the monomeric aquapores of AQP1. Thus, the hydrophilic NH3 probably also moves exclusively through the monomeric aquapores of AQP1 and through the monomeric ammonia pores of AmtB and RhAG. The less hydrophilic CO2, however, could move through the hydrophobic central pores of all 5 channels. NO is also known to move through AQP1 (8), and indirect evidence is consistent with the idea that O2 moves through AQP1 (38). We suggest that the hydrophobic NO and O2 move through the central pores. Crystallographic data show that xenon can enter the central pore of the bacterial Rh50 (21). Moreover, in the case of AQP1, molecular-dynamics simulations show that CO2 could penetrate the 4 aquapores or, with greater ease, the central pore (7). We hypothesize that the CO2/NH3 selectivities that we observe reflect the relative permeabilities of the 2 gases through the monomeric vs. the central pores of the 5 channels we studied.
In a cell like the human RBC, whose plasma-membrane lipid has an intrinsically low gas permeability (6), the gas selectivity of AQP1 and the Rh complex would provide control over dissolved gases crossing the membrane. The NH3 permeability of AQP1 and RhAG could enhance the ability of RBCs to pick up NH3 in various tissues (where the NH3 gradient would favor NH3 uptake) and then to off-load it in the liver (where the gradient would favor NH3 efflux from RBCs and uptake by hepatocytes) for NH3 detoxification. In the hypertonic renal medulla, this NH3 permeability could reduce the reflection coefficient for NH3 and thereby reduce cell-volume changes. However, the low NH3 permeability of AQP4 could protect the brain from rising blood levels of NH3, while still allowing CO2, and perhaps NO and O2, to pass.
Materials and Methods
Molecular Biology.
AQPs.
Human AQP1 cDNA (GenBank accession no. NM_198098), cDNA encoding the rat AQP4/M23 splice variant (GenBank accession no. NM_012825), and human AQP5 cDNA (GenBank accession no. NM_012779) were gifts of Peter Agre (Johns Hopkins University, Baltimore).
AmtB.
We cloned E. coli AmtB cDNA (GenBank accession no. ECU40429) by PCR from genomic DNA and subcloned the ≈1.3-kb PCR product into the Xenopus expression vector pGH19 (39). Using PCR, we created an additional construct in which we replaced the nucleotides encoding the signal sequence (i.e., first 22 residues) with ATG. At the 3′ end of some constructs, we added in-frame cDNA encoding either EGFP (Clontech, ref. 40) or a His tag.
RhAG.
Human RhAG cDNA in pT7TS (GenBank accession no. NM_000324, a gift of Baya Chérif-Zahar, Université René Descartes, INSERM, Paris) (41) was subcloned into pGH19. We tagged RhAG at its 3′ end with EGFP.
Other cDNAs.
Rabbit NKCC2 (42) was a gift of Biff Forbush (Yale University, New Haven, CT). SGLT1 (43) and PepT1 (44) were gifts of Matthias Hediger (Brigham and Women's Hospital and Harvard Medical School, Boston).
Site-Directed Mutagenesis.
We used the QuikChange Site-Directed Mutagenesis Kit (Stratagene), following the manufacturer's instructions.
cRNA Preparation.
We generated cRNA using the Message Machine kit (Ambion) and, unless otherwise stated, injected oocytes with 50 nL of 0.5 ng/nL of cRNA or 25 nL of 1 ng/nL of cRNA.
Western Blot Analysis.
Plasma-membrane proteins were prepared from oocytes (45), separated on a 13% SDS polyacrylamide gel, blotted on a PVDF membrane, probed with a monoclonal anti-His antibody (Catalog no. 70796–3, Novagen), and detected using ECL plus Western Blotting Detection Reagents (Amersham Biosciences).
Solutions for Physiological Assays.
The ND96 solution contained: 96 mM NaCl, 2 mM KCl, 1 mM MgCl2, 1.8 mM CaCl2, and 5 mM Hepes, pH 7.50, osmolality 195 mOsm. For Pf assays, we used a hypotonic ND96 variant (100 mOsm) that contained only 43 mM NaCl. The CO2/HCO3− solution was identical to ND96 except that 33 mM NaHCO3 replaced 33 mM NaCl, and the solution was bubbled with 5% CO2/balance O2. The NH3/NH4+ solution was a variant of ND96 in which we replaced 0.5 mM NaCl with 0.5 mM NH4Cl. The butyrate solution was a variant of ND96 in which we replace 30 mM Na-butyrate with 30 mM NaCl.
Carbonic-Anhydrase Assay.
Carbonic-anhydrase activity was assessed in 20 μg of membrane preparation of CA-IV or AQP1 oocytes using a colorimetric technique (46). The assay measures the rate at which the pH of a weakly buffered alkaline solution (imidazole-Tris, 50% CO2, with ρ-nitrophenol as indicator at 0 °C), falls in the presence or absence of CA, noted by a color change from yellow to clear, due to the reaction CO2 + H2O → HCO3− + H+.
Measurement of Oocyte Water Permeability.
We used a volumetric assay (47, 48) to measure osmotic water permeability (Pf). Briefly, after dropping oocytes into a Petri dish containing the hypotonic solution, we acquired video images every 1–2 s, obtaining the time course of the projection area of the oocyte. Assuming the oocyte to be a sphere, and the true surface area (S) to be 8-fold greater than the idealized area (49), we computed Pf as:
 |
where Vo is initial oocyte volume, d(V/Vo)/dt is the maximal fractional rate of volume increase, ΔOsm is the osmotic gradient across the membrane, and Vw is the molar volume of water.
Measurement of Surface pH.
We used microelectrodes to measure pHS (6, 50). Briefly, the pH electrode had a tip diameter of 15 μm, was filled at its tip with H+ ionophore mixture B (Catalog no. 95293, Fluka), and was connected to a FD223 electrometer (World Precision Instruments). The extracellular reference electrode was a glass micropipette filled with 3 M KCl and connected via a calomel half cell to a 750 electrometer (World Precision Instruments). The extracellular solution flowed at 3 mL/min, and the sampling rate was 1 per 500 ms. Using an MPC-200 system micromanipulator (Sutter Instrument), we positioned the pHS electrode tip either in the bulk extracellular fluid or dimpling ≈40 μm onto the oocyte surface, in the “shadow” of the oocyte. Although not displayed in the figures, membrane potential (Vm) and intracellular pH were also monitored (see SI Text). All oocytes had initial Vm values at least as negative as −40 mV.
We verified delivery of EGFP-tagged proteins to a region near the plasma membrane by using a 96-well plate reader (BMG Labtechnologies) to assess fluorescence (40).
Data Analysis.
Before applying CO2/HCO3− or NH3/NH4+, we computed pHS from the preceding calibration, with the electrode tip in the bulk phase of the ND96 solution (pH 7.50). After applying CO2/HCO3− or NH3/NH4+, we computed pHS from a second calibration in the bulk phase of the new solution (also pH 7.50). The maximum pHS excursion (ΔpHS) was taken as the maximum pHS after the application of CO2/HCO3− (or the minimum pHS after application of NH3/NH4+) minus the pHS prevailing just before the solution change from ND96.
Statistics.
Data are presented as mean ± SEM. To compare the difference between 2 means, we performed Student's t tests (two tails). To compare more than 2 means, we performed a 1-way ANOVA followed by a Dunnett's or a Student–Newman–Keuls posthoc analysis, using KaleidaGraph (Version 4, Synergy Software). P < 0.05 was considered significant.
Acknowledgments.
We thank Drs. Baya Chérif-Zahar, Peter Agre, Matthias Hediger, and Biff Forbush for providing cDNA or cRNA. Duncan Wong provided computer support. Mark Parker and Lara Skelton provided helpful discussions. This work was supported by Grant 1N00014-05-0345 (Office of Naval Research, to W.F.B.). For part of the period (from 07/2006 to 10/2007), R.M.A. was supported by a fellowship from the American Heart Association (0625891T).
Footnotes
The authors declare no conflict of interest.
This article contains supporting information online at www.pnas.org/cgi/content/full/0813231106/DCSupplemental.
References
- 1.Waisbren SJ, et al. Unusual permeability properties of gastric gland cells. Nature. 1994;368:332–335. doi: 10.1038/368332a0. [DOI] [PubMed] [Google Scholar]
- 2.Nakhoul NL, et al. Effect of expressing the water channel aquaporin-1 on the CO2 permeability of Xenopus oocytes. Am J Physiol. 1998;274:C543–C548. doi: 10.1152/ajpcell.1998.274.2.C543. [DOI] [PubMed] [Google Scholar]
- 3.Cooper GJ, Boron WF. Effect of pCMBS on CO2 permeability of Xenopus oocytes expressing aquaporin 1 or its C189S mutant. Am J Physiol. 1998;275:C1481–C1486. doi: 10.1152/ajpcell.1998.275.6.C1481. [DOI] [PubMed] [Google Scholar]
- 4.Prasad GV, et al. Reconstituted aquaporin 1 water channels transport CO2 across membranes. J Biol Chem. 1998;273:33123–33126. doi: 10.1074/jbc.273.50.33123. [DOI] [PubMed] [Google Scholar]
- 5.Uehlein N, et al. The tobacco aquaporin NtAQP1 is a membrane CO2 pore with physiological functions. Nature. 2003;425:734–737. doi: 10.1038/nature02027. [DOI] [PubMed] [Google Scholar]
- 6.Endeward V, et al. Evidence that Aquaporin 1 is a major pathway for CO2 transport across the human erythrocyte membrane. FASEB J. 2006;20:1974–1981. doi: 10.1096/fj.04-3300com. [DOI] [PubMed] [Google Scholar]
- 7.Wang Y, et al. Exploring gas permeability of cellular membranes and membrane channels with molecular dynamics. J Struct Biol. 2007;157:534–544. doi: 10.1016/j.jsb.2006.11.008. [DOI] [PubMed] [Google Scholar]
- 8.Herrera M, Hong NJ, Garvin JL. Aquaporin-1 transports NO across cell membranes. Hypertension. 2006;48:157–164. doi: 10.1161/01.HYP.0000223652.29338.77. [DOI] [PubMed] [Google Scholar]
- 9.Nakhoul NL, et al. Transport of NH3/NH4+ in oocytes expressing aquaporin-1. Am J Physiol. 2001;281:F255–F263. doi: 10.1152/ajprenal.2001.281.2.F255. [DOI] [PubMed] [Google Scholar]
- 10.Holm LM, et al. NH3 and NH4+ permeability in aquaporin-expressing Xenopus oocytes. Pflügers Arch. 2005;450:415–428. doi: 10.1007/s00424-005-1399-1. [DOI] [PubMed] [Google Scholar]
- 11.Saparov SM, et al. Fast and selective ammonia transport by aquaporin-8. J Biol Chem. 2007;282:5296–5301. doi: 10.1074/jbc.M609343200. [DOI] [PMC free article] [PubMed] [Google Scholar]
- 12.Peng J, Huang CH. Rh proteins vs Amt proteins: An organismal and phylogenetic perspective on CO2 and NH3 gas channels. Transfusion Clin Biol. 2006;13:85–94. doi: 10.1016/j.tracli.2006.02.006. [DOI] [PubMed] [Google Scholar]
- 13.Winkler FK. Amt/MEP/Rh proteins conduct ammonia. Pflügers Arch. 2006;451:701–707. doi: 10.1007/s00424-005-1511-6. [DOI] [PubMed] [Google Scholar]
- 14.Khademi S, Stroud RM. The Amt/MEP/Rh family: Structure of AmtB and the mechanism of ammonia gas conduction. Physiology (Bethesda) 2006;21:419–429. doi: 10.1152/physiol.00051.2005. [DOI] [PubMed] [Google Scholar]
- 15.Soupene E, Lee H, Kustu S. Ammonium/methylammonium transport (Amt) proteins facilitate diffusion of NH3 bidirectionally. Proc Natl Acad Sci USA. 2002;99:3926–3931. doi: 10.1073/pnas.062043799. [DOI] [PMC free article] [PubMed] [Google Scholar]
- 16.Marini AM, et al. Cloning and expression of the MEP1 gene encoding an ammonium transporter in Saccharomyces cerevisiae. EMBO J. 1994;13:3456–3463. doi: 10.1002/j.1460-2075.1994.tb06651.x. [DOI] [PMC free article] [PubMed] [Google Scholar]
- 17.Fabiny JM, et al. Ammonium transport in Escherichia coli: Localization and nucleotide sequence of the amtA gene. J Gen Microbiol. 1991;137:983–989. doi: 10.1099/00221287-137-4-983. [DOI] [PubMed] [Google Scholar]
- 18.Zheng L, et al. The mechanism of ammonia transport based on the crystal structure of AmtB of Escherichia coli. Proc Natl Acad Sci USA. 2004;101:17090–17095. doi: 10.1073/pnas.0406475101. [DOI] [PMC free article] [PubMed] [Google Scholar]
- 19.Khademi S, et al. Mechanism of ammonia transport by Amt/MEP/Rh: Structure of AmtB at 1.35 angstrom. Science. 2004;305:1587–1594. doi: 10.1126/science.1101952. [DOI] [PubMed] [Google Scholar]
- 20.Conroy MJ, et al. The crystal structure of the Escherichia coli AmtB-GlnK complex reveals how GlnK regulates the ammonia channel. Proc Natl Acad Sci USA. 2007;104:1213–1218. doi: 10.1073/pnas.0610348104. [DOI] [PMC free article] [PubMed] [Google Scholar]
- 21.Lupo D, et al. The 1.3-A resolution structure of Nitrosomonas europaea Rh50 and mechanistic implications for NH3 transport by Rhesus family proteins. Proc Natl Acad Sci USA. 2007;104:19303–19308. doi: 10.1073/pnas.0706563104. [DOI] [PMC free article] [PubMed] [Google Scholar]
- 22.Andrade SL, et al. Crystal structure of the archaeal ammonium transporter Amt-1 from Archaeoglobus fulgidus. Proc Natl Acad Sci USA. 2005;102:14994–14999. doi: 10.1073/pnas.0506254102. [DOI] [PMC free article] [PubMed] [Google Scholar]
- 23.Ripoche P, et al. Human Rhesus-associated glycoprotein mediates facilitated transport of NH3 into red blood cells. Proc Natl Acad Sci USA. 2004;101:17222–17227. doi: 10.1073/pnas.0403704101. [DOI] [PMC free article] [PubMed] [Google Scholar]
- 24.Soupene E, Inwood W, Kustu S. Lack of the Rhesus protein Rh1 impairs growth of the green alga Chlamydomonas reinhardtii at high CO2. Proc Natl Acad Sci USA. 2004;101:7787–7792. doi: 10.1073/pnas.0401809101. [DOI] [PMC free article] [PubMed] [Google Scholar]
- 25.Endeward V, et al. RhAG protein of the Rhesus complex is a CO2 channel in the human red cell membrane. FASEB J. 2008;22:64–73. doi: 10.1096/fj.07-9097com. [DOI] [PubMed] [Google Scholar]
- 26.De Hemptinne A, Huguenin F. The influence of muscle respiration and glycolysis on surface and intracellular pH in fibres of the rat soleus. J Physiol. 1984;347:581–592. doi: 10.1113/jphysiol.1984.sp015084. [DOI] [PMC free article] [PubMed] [Google Scholar]
- 27.Chesler M. Regulation of intracellular pH in reticulospinal neurones of the lamprey, Petromyzon Marinus. J Physiol. 1986;381:241–261. doi: 10.1113/jphysiol.1986.sp016325. [DOI] [PMC free article] [PubMed] [Google Scholar]
- 28.Blank ME, Ehmke H. Aquaporin-1 and HCO3−-Cl− transporter-mediated transport of CO2 across the human erythrocyte membrane. J Physiol. 2003;550:419–429. doi: 10.1113/jphysiol.2003.040113. [DOI] [PMC free article] [PubMed] [Google Scholar]
- 29.Nagelhus EA, Mathiisen TM, Ottersen OP. Aquaporin-4 in the central nervous system: Cellular and subcellular distribution and coexpression with KIR4.1. Neuroscience. 2004;129:905–913. doi: 10.1016/j.neuroscience.2004.08.053. [DOI] [PubMed] [Google Scholar]
- 30.Verkman AS, Matthay MA, Song Y. Aquaporin water channels and lung physiology. Am J Physiol. 2000;278:L867–L879. doi: 10.1152/ajplung.2000.278.5.L867. [DOI] [PubMed] [Google Scholar]
- 31.Ridgwell K, et al. Isolation of cDNA clones for a 50 kDa glycoprotein of the human erythrocyte membrane associated with Rh (rhesus) blood-group antigen expression. Biochem J. 1992;287:223–228. doi: 10.1042/bj2870223. [DOI] [PMC free article] [PubMed] [Google Scholar]
- 32.Musa-Aziz R, et al. Concentration-dependent effects on intracellular and surface pH of exposing Xenopus oocytes to solutions containing NH3/NH4+ J Membr Biol. 2009 doi: 10.1007/s00232-009-9155-7. in press. [DOI] [PMC free article] [PubMed] [Google Scholar]
- 33.Parker MD, et al. Characterization of human SLC4A10 as an electroneutral Na/HCO3 cotransporter (NBCn2) with Cl- self-exchange activity. J Biol Chem. 2008;283:12777–12788. doi: 10.1074/jbc.M707829200. [DOI] [PMC free article] [PubMed] [Google Scholar]
- 34.Javelle A, et al. Ammonium sensing in Escherichia coli. Role of the ammonium transporter AmtB and AmtB-GlnK complex formation. J Biol Chem. 2004;279:8530–8538. doi: 10.1074/jbc.M312399200. [DOI] [PubMed] [Google Scholar]
- 35.Marini AM, et al. Structural involvement in substrate recognition of an essential aspartate residue conserved in Mep/Amt and Rh-type ammonium transporters. Curr Genet. 2006;49:364–374. doi: 10.1007/s00294-006-0062-5. [DOI] [PubMed] [Google Scholar]
- 36.Thomas GH, Mullins JGL, Merrick M. Membrane topology of the Mep/Amt family of ammonium transporters. Mol Microbiol. 2000;37:331–344. doi: 10.1046/j.1365-2958.2000.01994.x. [DOI] [PubMed] [Google Scholar]
- 37.Thornton J, et al. The ammonia channel protein AmtB from Escherichia coli is a polytopic membrane protein with a cleavable signal peptide. FEMS Microbiol Lett. 2006;258:114–120. doi: 10.1111/j.1574-6968.2006.00202.x. [DOI] [PubMed] [Google Scholar]
- 38.Echevarria M, et al. Development of cytosolic hypoxia and hypoxia-inducible factor stabilization are facilitated by aquaporin-1 expression. J Biol Chem. 2007;282:30207–30215. doi: 10.1074/jbc.M702639200. [DOI] [PubMed] [Google Scholar]
- 39.Trudeau MC, et al. HERG, a human inward rectifier on the voltage-gated potassium channel family. Science. 1995;269:92–95. doi: 10.1126/science.7604285. [DOI] [PubMed] [Google Scholar]
- 40.Toye AM, et al. The human NBCe1-A mutant R881C, associated with proximal renal tubular acidosis, retains function but is mistargeted in polarized renal epithelia. Am J Physiol. 2006;291:C788–C801. doi: 10.1152/ajpcell.00094.2006. [DOI] [PubMed] [Google Scholar]
- 41.Marini AM, et al. The human Rhesus-associated RhAG protein and a kidney homologue promote ammonium transport in yeast. Nat Genet. 2000;26:341–344. doi: 10.1038/81656. [DOI] [PubMed] [Google Scholar]
- 42.Payne JA, Forbush B. Alternatively Spliced Isoforms of the Putative Renal Na-K-Cl Cotransporter Are Differentially Distributed Within the Rabbit Kidney. Proc Natl Acad Sci USA. 1994;91:4544–4548. doi: 10.1073/pnas.91.10.4544. [DOI] [PMC free article] [PubMed] [Google Scholar]
- 43.Hediger MA, et al. Expression cloning and cDNA sequencing of the Na+/glucose co-transporter. Nature. 1987;330:379–381. doi: 10.1038/330379a0. [DOI] [PubMed] [Google Scholar]
- 44.Fei YJ, et al. Expression cloning of a mammalian proton-coupled oligopeptide transporter. Nature. 1994;368:563–566. doi: 10.1038/368563a0. [DOI] [PubMed] [Google Scholar]
- 45.Leduc-Nadeau A, et al. Elaboration of a novel technique for purification of plasma membranes from Xenopus laevis oocytes. Am J Physiol. 2007;292:C1132–C1136. doi: 10.1152/ajpcell.00136.2006. [DOI] [PubMed] [Google Scholar]
- 46.Brion LP, et al. Micro-Method for the measurement of carbonic anhydrase activity in cellular homogenates. Anal Biochem. 1988;175:289–297. doi: 10.1016/0003-2697(88)90391-0. [DOI] [PubMed] [Google Scholar]
- 47.Virkki LV, et al. Cloning and functional characterization of a novel aquaporin from Xenopus laevis oocytes. J Biol Chem. 2002;277:40610–40616. doi: 10.1074/jbc.M206157200. [DOI] [PubMed] [Google Scholar]
- 48.Preston GM, et al. The mercury-sensitive residue at cysteine 189 in the CHIP28 water channel. J Biol Chem. 1993;268:17–20. [PubMed] [Google Scholar]
- 49.Chandy G, et al. Comparison of the water transporting properties of MIP and AQP1. J Membr Biol. 1997;159:29–39. doi: 10.1007/s002329900266. [DOI] [PubMed] [Google Scholar]
- 50.Musa-Aziz R, Grichtchenko II, Boron WF. (2005) Evidence from surface-pH transients that CA IV and CAII enhances CO2 influx into Xenopus oocytes. J Am Soc Nephrol. 2005;16:P0015. [Google Scholar]


