Abstract
Chromosome painting in placental mammalians illustrates that genome evolution is marked by chromosomal synteny conservation and that the association of chromosomes 3 and 21 may be the largest widely conserved syntenic block known for mammals. We studied intrachromosomal rearrangements of the syntenic block 3/21 by using probes derived from chromosomal subregions with a resolution of up to 10–15 Mbp. We demonstrate that the rearrangements visualized by chromosome painting, mostly translocations, are only a fraction of the actual chromosomal changes that have occurred during evolution. The ancestral segment order for both primates and carnivores is still found in some species in both orders. From the ancestral primate/carnivore condition an inversion is needed to derive the pig homolog, and a fission of chromosome 21 and a pericentric inversion is needed to derive the Bornean orangutan condition. Two overlapping inversions in the chromosome 3 homolog then would lead to the chromosome form found in humans and African apes. This reconstruction of the origin of human chromosome 3 contrasts with the generally accepted scenario derived from chromosome banding in which it was proposed that only one pericentric inversion was needed. From the ancestral form for Old World primates (now found in the Bornean orangutan) a pericentric inversion and centromere shift leads to the chromosome ancestral for all Old World monkeys. Intrachromosomal rearrangements, as shown here, make up a set of potentially plentiful and informative markers that can be used for phylogenetic reconstruction and a more refined comparative mapping of the genome.
Both comparative genetic maps and molecular cytogenetic techniques show that genome organization is more highly conserved than previously supposed. Chromosome painting in a wide range of placental mammalian species most dramatically illustrates that genome evolution is marked by a high degree of chromosomal synteny conservation (1–3). Recent estimates based on chromosome painting show that translocations are normally rare events on the order of one per 10 million years of evolution. These chromosome rearrangements therefore may be considered unique because it is highly unlikely that they are recurrent in different phylogenetic lines (1, 4). Accordingly, the same syntenic group may be disrupted independently by chromosome fissions or translocations, but it is much less likely that the same syntenic group can be assembled independently in different lineages. This low level of convergence makes molecular cytogenetic studies highly attractive for understanding phylogenic relationships and aiding comparative gene mapping efforts.
Chromosome painting with human chromosome-specific probes has shown that an association of human chromosome 3 and 21 homologs is an extremely ancient synteny (see refs. 1 and 5 for reviews) because it is found in a wide array of species from a number of mammalian orders including insectivores (6), artiodacyls, (7, 8), carnivores, (2, 8–10), tree shrews (11), and lower primates (see ref. 12 for review). Available gene mapping data suggests that both chromosomes are associated even in marsupials (13). Therefore we can conclude that the syntenic association of 3 and 21 may be ancestral for all placental mammals.
By comparison, the syntenies of human chromosomes 1 and 2 are more recent events. Human chromosome 1 became syntenic only with the origin of the evolutionary line leading to Old World primates (11) whereas the synteny of chromosome 2 arose after the divergence of humans from African apes (14). Because the entire chromosome 3/21 homolog is not only conserved in lower primates but also in other mammals this synteny is the largest widely conserved syntenic block known in mammals. This ancient syntenic group, however, has been diversely fragmented in a number of evolutionary lines in mammals. In felids and dolphins two homologs are present, whereas in bovids and the horse three homologous chromosomes are found (2). In the mouse five different chromosomes show homologies to human chromosome 3, one in association with chromosome 21 (ref. 15; www.informatics.jax.org). Chromosome painting results identify the fission of the 3/21 synteny as a genomic landmark for the origin of higher Old World primates and humans after the divergence of prosimians and then New World monkeys (16–20). In great apes, humans, and the concolor gibbon the homolog to chromosome 21 forms a separate chromosome. In Old World monkeys and other lesser apes the chromosome 21 homolog is associated with different human homologs (14, 16–18, 21, 22).
However, conserved chromosomal synteny does not automatically imply conserved gene order. The rearrangements visualized by chromosome painting, mostly translocations, are only a fraction of the actual chromosomal changes that have occurred during evolution. Intrachromosomal rearrangements, such as inversions and transpositions, represent another distinct, yet cytogenetically unexploited class of potentially plentiful and informative evolutionary changes of genome structure. We can begin to study intrachromosomal rearrangements by using DNA probes specific for chromosome subregions with a resolution of up to 10–15 Mbp.
Here we used an array of subchromosomal probes to investigate intrachromosomal rearrangements that have occurred in the 3/21 syntenic block in various primates and outgroup mammals. Subchromosomal probes can be derived by establishing chromosome paints from species in which the synteny of chromosome 3/21 has been disrupted. These probes then are used to reciprocally paint various other species (4, 20, 23, 24) and readily identify both translocations breakpoints and intrachromosomal reshuffling. Painting probes we used here were derived from the tree shrew or tupaia (Tupaia belangeri) (11) and the African green monkey (Cercopithecus aethiops) homologs (25). Regions homologous to human chromosome 3 in the tree shrew are distributed on four chromosomes (11), one of which also is associated with the human 21 homolog (3a, 3b, 3c, and 3d/21). In the African green monkey two chromosomes are homologous to human 3, and the homolog to human chromosome 21 is translocated to another chromosome. Combined with a set of band-specific probes such as yeast artificial chromosomes (YACs) (23, 26) and human subregional chromosome painting probes (27) (Fig. 1) a variety of primates and other mammalian species were used for a refined molecular cytogenetic dissection of the evolutionary history of human chromosome 3.
Figure 1.
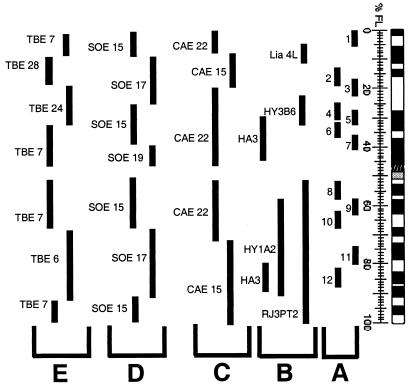
A summary of the mapping positions of DNA probes included in this study given in fractional length from the telomere (FL) on human chromosome 3. (A) Centre d'Etude du Polymorphisme Humain (CEPH) YACs 852b3 (#1), 938 g11 (#2), 936c1 (#3), 961f12 (#4), 870e5 (#5), 965a3 (#6), 808b10 (#7), 929 g8 (#8), 960f11 (#9), 806c12 (#10), 958 g10 (#11), and 866e7 (#12) (34). (B) Human subchromosomal probes derived from human/hamster somatic cell hybrids: Lia 4L, HY3B6, RJ3PT2, HA3, and HY1A2 (33). (C) C. aethiops (CAE) chromosome 15- and 22-specific paints (25). (D) T. belangeri (TBE) chromosome 6-, 7-, 24-, and 28-specific paints (11) and (E) S. oedipus (SOE) chromosome 15-, 17-, and 19-specific paints (unpublished data). TBE 7 and SOE 19 also show homology to human chromosome 21.
Materials and Methods
Cell Lines and Chromosome Preparation.
Metaphase preparations for fluorescence in situ hybridization (FISH) experiments were obtained from human (Homo sapiens), chimpanzee (Pan troglodytes), gorilla (Gorilla gorilla), both orangutan subspecies (Pongo pygmaeus pygmaeus and Pongo pgmaeus abelii), pigtailed macaque (Macaca nemestrina), African green monkey (Cercopithecus aethiops), silvered-leaf monkey (Presbytis cristata), Douc langur (Pygathrix nemaeus), squirrel monkey (Saimiri sciureus), pygmy marmoset (Cebuella pygmaea), brown lemur (Eulemur fulvus mayottensis), black lemur (Eulemur macaco macaco), tree shrew (Tupaia belangeri), pig (Sus scrofa), domestic cat (Felis catus), and ring-tailed cat (Bassariscus astutus, Procyonidae, Carnivora), following standard protocols.
DNA Probe Labeling and Chromosome Painting.
Chromosome painting in cross-species experiments followed standard procedures (4, 23, 27, 28). Chromosome-specific painting probes were established from flow-sorted chromosomes by degenerate oligonucleotide primed-PCR amplification as described (29). Primary PCR products were labeled either with biotin-16-dUTP or digoxigenin-11-dUTP (Boehringer Mannheim).
Hybridization and detection were carried out by using a modification of the procedure described previously (30–32). For single-color FISH 100–150 ng of biotinylated-specific paint and 1 μg of competitor DNA (human Cot-1 DNA, BRL) were made up to 12 μl with hybridization buffer (50% deionized formamide, 10% dextran sulfate, 2× SSC), denatured at 68°C for 10 min and preannealed by incubation at 37°C for 30 min. When performing two-color FISH, paints were combined by mixing 150 ng of differently labeled DNA for each probe. Slides were denatured by incubation in 70% formamide in 2× SSC at 68°C for 1 min, 20 sec, quenched in ice-cold 70% ethanol, and dehydrated through an ethanol series. The preannealed paints were applied to slides and allowed to hybridize for 48–72 hr at 37°C. Posthybridization washes with high-stringency detection of the signal and chromosome counterstaining were performed as described (4).
FISH with YACs and Subchromosomal Probes from Somatic Cell Hybrids.
Spontaneous rearrangements between rodent and human chromosomes often leads to the random retention of translocated chromosomes and therefore to the random retention of human chromosome fragments, which then can be used as subregional painting probes. Chromosome subregion-specific painting probes were derived by Alu-PCR from human/rodent somatic cell hybrid DNA following published PCR conditions and labeling procedures (27, 33). Labeling and FISH procedure of YAC probes followed the protocol described by Bray-Ward et al. (34). Biotinylated DNA probes were detected by Avidin-Cy3, digoxigenin-labeled probes by FITC coupled to an antidigoxigenin antibody.
Microscopy and Image Processing.
Digital images were taken by using a cooled charge-coupled device camera (Photometrics NU200 series equipped with a Kodak KAF 1400 chip) coupled to a Zeiss Axiophot epifluorescence microscope. Camera control and digital image acquisition (8-bit gray scale) used an Apple Macintosh Quadra 950 or G3 computer and smartcapture software (Digital Scientific, Cambridge, U.K.).
Results and Discussion
Defining the Ancestral Chromosome Form for Primates and Carnivores.
To identify the direction of changes in the evolution of human chromosome 3/21 homologs in primates we first have to identify the ancestral chromosome form for all primates from nonprimate mammals serving as outgroup species. We used various species from the super order Ferungulata (see Materials and Methods) because a complete synteny of the human chromosome 3/21 was already reported for species from this taxa (see refs. 1 and 5 for reviews).
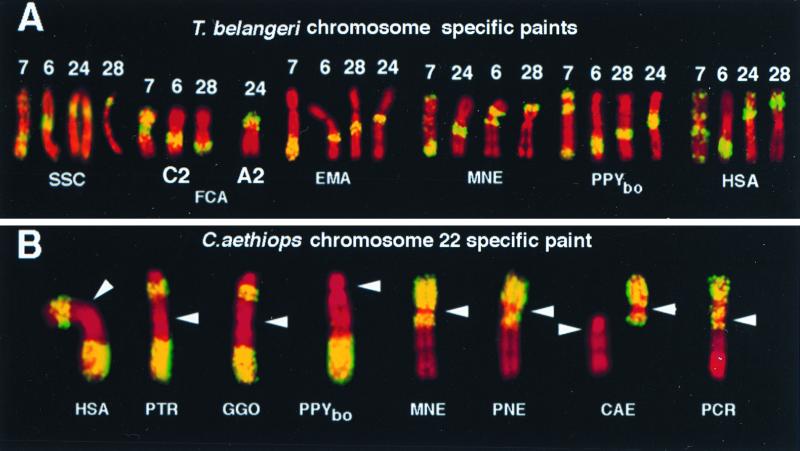
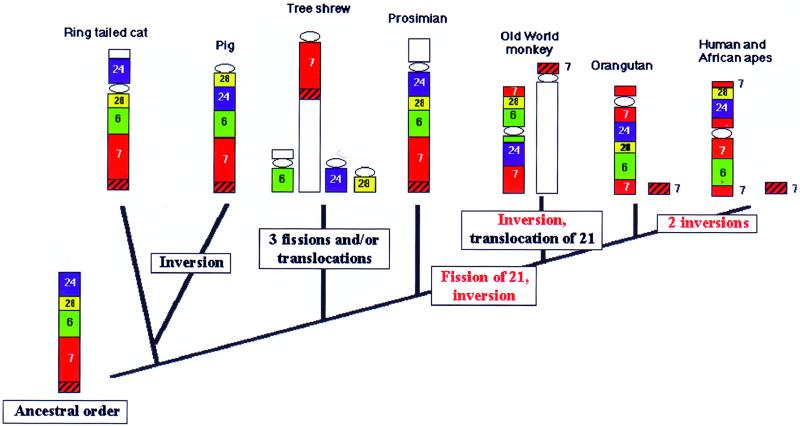
Currently, the most reliable probes to be used between distantly related species are chromosome paints. To delineate human chromosome 3/21 homologous subregions in various species we used the four painting probes derived from the tree shrew (Fig. 1), which previously have been shown to be homologous to different regions of human chromosome 3/21 (11). The pattern of the four tree shrew paints homologous to different segments of human chromosome 3/21 was identical when hybridized to metaphases of the ring tailed cat and lemurs (E. m. macaco and E. f. mayottensis, Lemuriformes, primates), but differed in the pig (Fig. 2A). Because the chromosome 3/21 homolog forms a single chromosome outside of primates the translocation of the human chromosome 9 homolog associated with 3/21 in both lemurs is a derived form. Further, because both the pig and ring-tailed cat belong to the mammalian super order Ferungulata the most parsimonious interpretation would be that the ring-tailed cat and lemur share the ancestral order of chromosome segments for both primates and Ferungulata; the pig can be derived from this chromosome form by a pericentric inversion (Figs. 2A and 3). The cat shows a derived translocation to form two chromosomes with homologous segments (chromosomes A2 and B2, Fig. 2; refs. 4 and 10). However, there are probably other rearrangements beyond the resolution of the probes used here.
Figure 2.
Examples for chromosome painting of various primates and nonprimate outgroup mammals. (A) T. belangeri chromosome 6-, 7-, 24-, and 28- specific probes (yellow) on pig (SSC), cat (FCA), lemur (EMA), macaque (MNE), and Bornean orangutan (PPYbo) and human (HSA); chromosomes are counterstained in red. The order of probes in the lemur is the same as in the ring-tailed cat (not shown) and represents the ancestral condition for both carnivores and primates. The pig shows a derived inversion with breakpoints very close to the borders of tupaia probes 28 and 24. The cat shows a derived translocation of a segment closely identical to the tupaia segment 24 to form cat chromosomes C2 and A2. (B) Hybridization patterns on human and various higher primate homologs observed with a C. aethiops chromosome 22-specific paint (yellow). Human (HSA), chimpanzee (PTR), and Gorilla (GGO) chromosome 3 homologs show the same two hybridization segments, whereas on Bornean orangutan (PPYbo), macaque (MNE), Douc langur (PNE), and African green monkey (CAE) only one distinct signal was observed, with the exception of PPYbo interrupted by the centromere (arrow heads). On silvered-leaf monkey (PCR) chromosomes two signals were detected, one of them interrupted by the centromere.
Figure 3.
Summary and interpretation of the hybridization of tree shrew chromosome 6- (green), 7- (red), 24- (blue), and 28- (yellow) specific paints on ring-tailed cat, pig, tree shrew, prosimians (lemur), Old World monkey (macaque), Bornean orangutan, African great apes, and human chromosomes. Uncolored chromosome segments represent apomorphic translocations. The segment homologous to human 21 is shown hatched. Red lettering indicates phylogenetic landmarks. The ancestral order of chromosome segments for carnivores, artiodactlys, and primates is found in the ring-tailed cat and prosimians. The origin of Old World monkeys, apes, and humans is marked by a synapomorphic fission of homologs to chromosomes 21 and 3 and an inversion. The Bornean orangutan has conserved the ancestral order for all higher Old World primates. From this Old World monkeys are derived by a synapomorphic inversion. African apes and humans are phylogenetically linked by two inversions.
Defining the Ancestral Chromosome Form for New World Primates.
In the cotton-topped tamarin (Saguinus oedipus) three chromosomes are homologous to human chromosome 3 segments (3a, 3b, and 3c/21). Reciprocal painting with human and cotton-topped tamarin painting probes (kindly provided by M. A. Ferguson-Smith, University of Cambridge, U.K.) proved that New World monkeys share the 3/21 chromosome association (not shown). Painting of other New World monkey (S. sciureus, C. pygmaea) chromosomes with cotton-topped tamarin monkey paints showed that these three chromosomes are conserved as syntenic blocks in all three New World monkeys tested and may be ancestral for Platyrrhines (results not shown). Further, the results indicate that New World monkeys and higher Old World primates diverged at a time when the chromosome 3/21 association was still present.
Defining the Ancestral Chromosome Form for Old World Primates.
If we compare the hybridization pattern of the tree shrew paints in lemurs with higher Old World primates then the Bornean subspecies of orangutan shows the least number of rearrangements. Only the fission of chromosome 21 and a single pericentric inversion is needed to derive the Bornean chromosome from the ancestral order found in the lemur. Bornean orangutans apparently have conserved the ancestral chromosome form homologous to human 3 because all other great apes and Old World monkeys analyzed can be derived from this form by the most parsimonious number of rearrangements (Fig. 3). This interpretation gains support from chromosome painting with probes derived from the African green monkey homologs to human chromosome 3 and further high-resolution mapping (see below). All African apes and humans show the same hybridization pattern with the African green monkey probes whereas Old World monkeys differ from the orangutan by the position of the centromere (Fig. 2).
High-Resolution Mapping of Chromosome Rearrangements in Old World Primates.
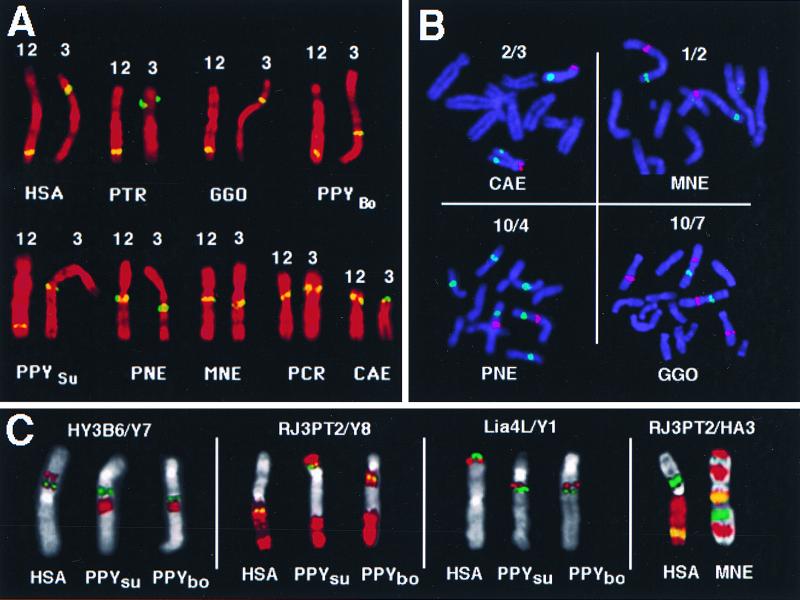
DNA probes specific for single bands or smaller subregions such as YACs and subregional chromosome painting probes from rearranged human/rodent somatic cell hybrids (27) then were used for a more refined analysis of chromosome 3 reshuffling in higher Old World primates. These probes cover human chromosome 3 in steps of about 10–15 Mbp (Figs. 1 and 4).
Figure 4.
Examples for comparative fine-mapping experiments in higher primates using YACs and human subregional painting probes. For abbreviations of species names see Fig. 2. (A) Hybridization signals observed with YAC 3 and 12 (yellow) on human chromosome 3 and various primate homologs counterstained in red. (B) Partial primate metaphases (blue) after hybridizations with two YACs each (green/red). Note that YACs 4 and 7 are chimeric, giving additional signals on other chromosomes. (C) Multicolor FISH experiments with YACs and subchromosomal painting probes derived from somatic cell hybrids (see Fig. 1, for probe location on human chromosomes). Chromosomal counterstain is false colored in gray, hybridization signals in green and red, and yellow in case of probe overlap.
The hybridization pattern of the probes indicates that human and African apes are phylogenetically linked by a derived series of common chromosome rearrangements. The lowest number of rearrangements, two overlapping inversions (Fig. 5) derives the human and African ape homologs from the orangutan of the Bornean subspecies. This reconstruction contrasts with the published scenario based on comparisons of banding patterns. According to Yunis and Prakash (35) the Sumatran orangutan homolog would differ from the human by two pericentric inversions; however, our results show three. According to Seuànez (36), a single inversion would be needed in the Bornean orangutan to give rise to African ape and human chromosome 3 homologs. The FISH data show that there are at least two overlapping inversions; however, they do confirm that only a single inversion is needed to derive the Sumatran from the Bornean orangutan homolog (Fig. 5).
Figure 5.
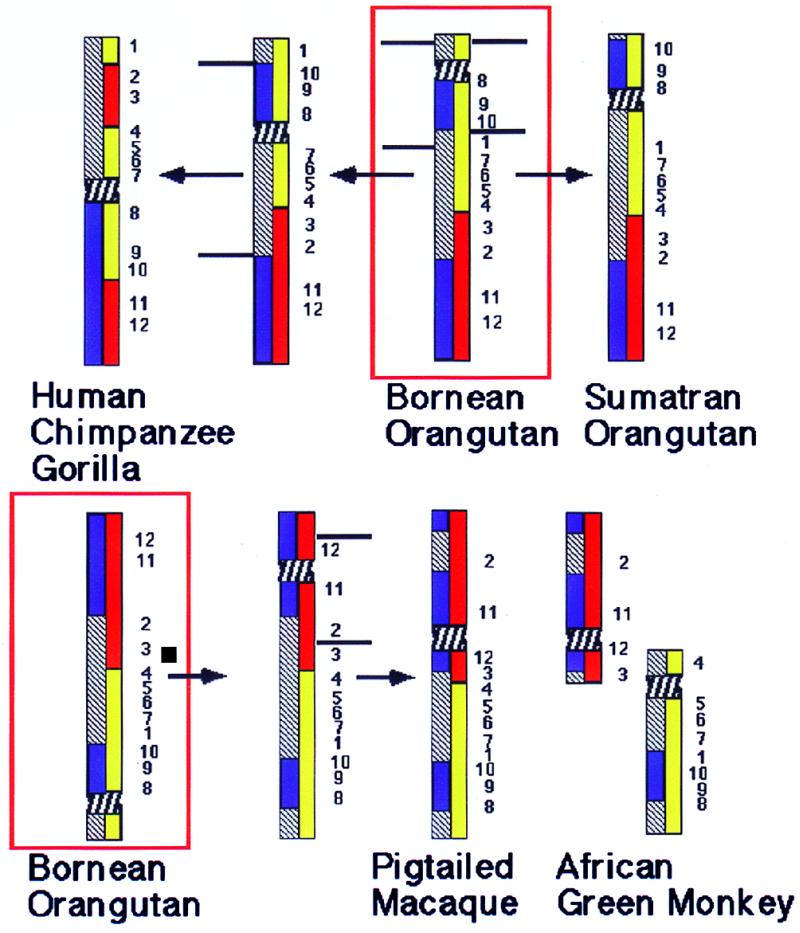
The most parsimonious reconstruction of chromosome 3 rearrangements in higher primates. Blue bars within a chromosome represent the hybridization signals obtained with a painting probe specific for human chromosome 3q. Yellow and red bars show the hybridization signals obtained with African green monkey chromosome 15 and 22 paints, respectively. The horizontal lines show inversion break points and the arrows the direction of changes. Numbers indicate the location and order of YAC signals. The red boxes frame the assumed ancestral condition for all higher Old World primates as found in the Bornean orangutan. (Upper) To derive the homologs of human/African great apes from that of Bornean orangutan two overlapping inversions are necessary. First YACs 8–10 and 1 would have to be inverted, leading to an intermediate chromosome type. In a second inversion a fragment including YACs 2–7, the centromere, and YACs 8–10 were inverted. The signal derived from African green monkey chromosome paints are split in two segments each. The Sumatran orangutan homolog can be derived from that of the Bornean orangutan by a single pericentric inversion involving breakpoints between YACs 1 and 10 and the telomere. (Lower) A centromere inactivation/activation and a single pericentric inversion is needed to derive the ancestral Old World monkey homolog as seen in both the macaque and snub-nosed monkeys from that of the Bornean orangutan. For better comparison the orangutan homolog has been inverted. C. aethiops homologs can be derived from the ancestral Old World monkey homolog by a fission between YACs 3 and 4 and the activation of a new centromere.
The hybridization patterns of all probes observed in both the macaque and the Douc langur, species belonging to different Old World monkey families (Cercopithecidae and Colobidae, respectively), is identical. These two species apparently have conserved the form of chromosome 3 ancestral for all Old World monkeys. The homolog in other species can be derived by simple rearrangements of this chromosome: fission in the African green monkey and a pericentric inversion in the silvered-leaf monkey (Fig. 5).
A single inversion accounts for the differences in the hybridization patterns between the chromosome ancestral for Old World monkeys and the homolog ancestral for all higher Old World primates, including great apes and humans (Fig. 5). This interpretation is supported by the order of YACs and confirmed with subregional paints (not shown), but seems inconsistent with the position of the centromere. In the Bornean orangutan the centromere is located distal to YAC 8 within a region hybridized by African green monkey chromosome paint 15. In the macaque it is found between YACs 11 and 12 within a region painted by the African green monkey chromosome paint 22 (Fig. 5). If we claim that the position of the centromere is fixed then at least five subsequent overlapping inversions are needed to derive extant homologs to chromosome 3. A more parsimonious hypothesis would entail a single pericentric inversion and a shift in the position of the centromere (Fig. 5 Lower). “Latent centromeres” have been observed in human chromosome 3 pathology (37), and centromere activation and inactivation also has been postulated as a mechanism of chromosome evolution (38, 39).
Conclusions
Our results clearly demonstrate that although the synteny of the human chromosome 3 homolog is highly conserved in various mammals, chromosome segment or gene order may be highly disturbed. In the phylogenies leading to human and carnivores we identified at least three inversions. Another inversion has to be assumed in the line leading to the pig. This interpretation is in accordance with recent comparative gene mapping studies in the pig (40, 41). Up to 10 conserved segments were demonstrated that should have resulted from extensive intrachromosomal rearrangements.
The comparative map between various species allowed us to identify the history of these changes in various phylogenies. Our data demonstrate the main landmarks of human chromosome 3 evolution that include (i) an ancestral synteny and order of chromosome segments of between homologs to human chromosome 3 and 21, which is conserved in lemurs and carnivores, (ii) the fission of chromosome 3 and 21 homologs in Old World primates after the divergence of New World monkeys; the ancestral form is found conserved in the orangutan subspecies of Borneo, and from this chromosome (iii) two subsequent inversions in the phylogenetic line leading to African apes and humans, and (iv) a pericentric inversion and centromere shift leading to the chromosome ancestral for Old World monkeys (Fig. 3).
It can be noted that the number of intrachromosomal rearrangements visualized with the array of subchromosomal probes used here is about four times higher than the number of interchromosomal translocations revealed by chromosome paints alone. We can anticipate that the application of reciprocal chromosome painting and higher-resolution subchromosomal FISH will lead to the identification of many more landmarks in the evolution of homologs to each human chromosome and may yield further insights into the extent of evolutionary conservation of synteny groups. These data will have implications for our understanding of a wide range of issues, including the role chromosomal changes play in evolution, and help unfold a more comprehensive picture of the mammalian genome evolution and phylogeny.
Acknowledgments
We thank L. Lyons, B. Modi, and L. Frönicke for critical reading of the manuscript and S. J. O'Brien and M. A. Ferguson-Smith for support and discussions. The work was partially funded by the Deutsche Forschungsgemeinschaft (DFG Wi970-6/1).
Abbreviations
- YAC
yeast artificial chromosome
- FISH
fluorescence in situ hybridization
Footnotes
This paper was submitted directly (Track II) to the PNAS office.
References
- 1.O'Brien S J, Menotti-Raymond M, Murphy W J, Nash W G, Wienberg J, Stanyon R, Copland N G, Jenkins N A. Science. 1999;286:458–481. doi: 10.1126/science.286.5439.458. [DOI] [PubMed] [Google Scholar]
- 2.Wienberg J, Stanyon R. Curr Opin Genet Dev. 1997;7:784–791. doi: 10.1016/s0959-437x(97)80041-x. [DOI] [PubMed] [Google Scholar]
- 3.Wienberg J, Stanyon R. Curr Opin Genet Dev. 1995;5:792–797. doi: 10.1016/0959-437x(95)80013-u. [DOI] [PubMed] [Google Scholar]
- 4.Wienberg J, Stanyon R, Nash W G, O'Brien P C, Yang F, O'Brien S J, Ferguson-Smith M A. Cytogenet Cell Genet. 1997;77:211–217. doi: 10.1159/000134579. [DOI] [PubMed] [Google Scholar]
- 5.Richard F, Dutrillaux B. Chromosome Res. 1998;6:263–268. doi: 10.1023/a:1009262622325. [DOI] [PubMed] [Google Scholar]
- 6.Dixkens C, Klett C, Bruch J, Kollak A, Serov O L, Zhdanova N, Vogel W, Hameister H. Cytogenet Cell Genet. 1998;80:61–67. doi: 10.1159/000014958. [DOI] [PubMed] [Google Scholar]
- 7.Frönicke L, Chowdhary B P, Scherthan H, Gustavsson I. Mamm Genome. 1996;7:285–290. doi: 10.1007/s003359900084. [DOI] [PubMed] [Google Scholar]
- 8.Chowdhary B P, Raudsepp T, Fronicke L, Scherthan H. Genome Res. 1998;8:577–589. doi: 10.1101/gr.8.6.577. [DOI] [PubMed] [Google Scholar]
- 9.Frönicke L, Muller-Navia J, Romanakis K, Scherthan H. Chromosoma. 1997;106:108–113. doi: 10.1007/s004120050230. [DOI] [PubMed] [Google Scholar]
- 10.Rettenberger G, Klett C, Zechner U, Bruch J, Just W, Vogel W, Hameister H. Chromosome Res. 1995;3:479–486. doi: 10.1007/BF00713962. [DOI] [PubMed] [Google Scholar]
- 11.Müller S, Stanyon R, O'Brien P C, Ferguson-Smith M A, Plesker R, Wienberg J. Chromosoma. 1999;108:393–400. doi: 10.1007/s004120050391. [DOI] [PubMed] [Google Scholar]
- 12.Wienberg J, Stanyon R. ILAR J. 1998;39:77–91. doi: 10.1093/ilar.39.2-3.77. [DOI] [PubMed] [Google Scholar]
- 13.Comparative Genome Organization of Vertebrates. Mamm Genome. 1996;7:717–734. doi: 10.1007/s003359900222. [DOI] [PubMed] [Google Scholar]
- 14.Jauch A, Wienberg J, Stanyon R, Arnold N, Tofanelli S, Ishida T, Cremer T. Proc Natl Acad Sci USA. 1992;89:8611–8615. doi: 10.1073/pnas.89.18.8611. [DOI] [PMC free article] [PubMed] [Google Scholar]
- 15.Lyons L A, Laughlin T F, Copeland N G, Jenkins N A, Womack J E, O'Brien S J. Nat Genet. 1997;15:47–56. doi: 10.1038/ng0197-47. [DOI] [PubMed] [Google Scholar]
- 16.Wienberg J, Stanyon R, Jauch A, Cremer T. Chromosoma. 1992;101:265–270. doi: 10.1007/BF00346004. [DOI] [PubMed] [Google Scholar]
- 17.Bigoni F, Stanyon R, Koehler U, Morescalchi A M, Wienberg J. Am J Primatol. 1997;42:289–298. doi: 10.1002/(SICI)1098-2345(1997)42:4<289::AID-AJP4>3.0.CO;2-T. [DOI] [PubMed] [Google Scholar]
- 18.Bigoni F, Koehler U, Stanyon R, Ishida T, Wienberg J. Am J Phys Anthropol. 1997;102:315–327. doi: 10.1002/(SICI)1096-8644(199703)102:3<315::AID-AJPA2>3.0.CO;2-U. [DOI] [PubMed] [Google Scholar]
- 19.Richard F, Lombard M, Dutrillaux B. Genomics. 1996;36:417–423. doi: 10.1006/geno.1996.0486. [DOI] [PubMed] [Google Scholar]
- 20.Müller S, O'Brien P C, Ferguson-Smith M A, Wienberg J. Cytogenet Cell Genet. 1997;78:260–271. doi: 10.1159/000134669. [DOI] [PubMed] [Google Scholar]
- 21.Koehler U, Bigoni F, Wienberg J, Stanyon R. Genomics. 1995;30:287–292. doi: 10.1006/geno.1995.9875. [DOI] [PubMed] [Google Scholar]
- 22.Koehler U, Arnold N, Wienberg J, Tofanelli S, Stanyon R. Am J Phys Anthropol. 1995;97:37–47. doi: 10.1002/ajpa.1330970104. [DOI] [PubMed] [Google Scholar]
- 23.Arnold N, Stanyon R, Jauch A, O'Brien P, Wienberg J. Cytogenet Cell Genet. 1996;74:80–85. doi: 10.1159/000134387. [DOI] [PubMed] [Google Scholar]
- 24.Goureau A, Yerle M, Schmitz A, Riquet J, Milan D, Pinton P, Frelat G, Gellin J. Genomics. 1996;36:252–262. doi: 10.1006/geno.1996.0460. [DOI] [PubMed] [Google Scholar]
- 25.Finelli P, Stanyon R, Plesker R, Ferguson-Smith M A, O'Brien P C, Wienberg J. Mamm Genome. 1999;10:713–718. doi: 10.1007/s003359901077. [DOI] [PubMed] [Google Scholar]
- 26.Haaf T, Bray-Ward P. Chromosoma. 1996;104:537–544. doi: 10.1007/BF00352293. [DOI] [PubMed] [Google Scholar]
- 27.Müller S, Köhler U, Wienberg J, Marzella R, Finelli P, Antonacci R, Rocchi M, Archidiacono N. Chromosome Res. 1996;4:38–42. doi: 10.1007/BF02254943. [DOI] [PubMed] [Google Scholar]
- 28.Scherthan H, Cremer T, Arnason U, Weier H U, Lima-de-Faria A, Fronicke L. Nat Genet. 1994;6:342–347. doi: 10.1038/ng0494-342. [DOI] [PubMed] [Google Scholar]
- 29.Telenius H, Carter N P, Bebb C E, Nordenskjold M, Ponder B A J, Tunnacliffe A. Genomics. 1992;13:718–725. doi: 10.1016/0888-7543(92)90147-k. [DOI] [PubMed] [Google Scholar]
- 30.Cremer T, Lichter P, Borden J, Ward D C, Manuelidis L. Hum Genet. 1988;80:235–246. doi: 10.1007/BF01790091. [DOI] [PubMed] [Google Scholar]
- 31.Lichter P, Cremer T, Borden J, Manuelidis L, Ward D C. Hum Genet. 1988;80:224–234. doi: 10.1007/BF01790090. [DOI] [PubMed] [Google Scholar]
- 32.Pinkel D, Landegent J, Collins C, Fuscoe J, Segraves R, Lucas J, Gray J. Proc Natl Acad Sci USA. 1988;85:9138–9142. doi: 10.1073/pnas.85.23.9138. [DOI] [PMC free article] [PubMed] [Google Scholar]
- 33.Antonacci R, Marzella R, Finelli P, Lonoce A, Forabosco A, Archidiacono N, Rocchi M. Cytogenet Cell Genet. 1995;68:25–32. doi: 10.1159/000133882. [DOI] [PubMed] [Google Scholar]
- 34.Bray-Ward P, Menninger J, Lieman J, Desai T, Mokady N, Banks A, Ward D C. Genomics. 1996;32:1–14. doi: 10.1006/geno.1996.0070. [DOI] [PubMed] [Google Scholar]
- 35.Yunis J J, Prakash O. Science. 1982;215:1525–1530. doi: 10.1126/science.7063861. [DOI] [PubMed] [Google Scholar]
- 36.Seuànez H N. The Phylogeny of Human Chromosomes. Berlin: Springer; 1979. [Google Scholar]
- 37.Wandall A, Tranebjaerg L, Tommerup N. Chromosoma. 1998;107:359–365. doi: 10.1007/s004120050319. [DOI] [PubMed] [Google Scholar]
- 38.Dutrillaux B. Hum Genet. 1979;48:251–314. doi: 10.1007/BF00272830. [DOI] [PubMed] [Google Scholar]
- 39.Clemente I C, Ponsa M, Garcia M, Egozcue J. Hum Genet. 1990;84:493–506. doi: 10.1007/BF00210798. [DOI] [PubMed] [Google Scholar]
- 40.Sun H, Ernst C W, Yerle M, Pinton P, Rothschild M F, Chardon P, Rogel-Gaillard C, Tuggle C K. Cytogenet Cell Genet. 1999;85:273–278. doi: 10.1159/000015312. [DOI] [PubMed] [Google Scholar]
- 41.Van Poucke M, Törnsten A, Mattheeuws M, Van Zeveren A, Peelman L J, Chowdhary B P. Cytogenet Cell Genet. 1999;85:279–284. doi: 10.1159/000015313. [DOI] [PubMed] [Google Scholar]


