

Abstract
Down syndrome (DS) is a genetic disorder arising from the presence of a third copy of human chromosome 21 (Hsa21). Recently, O'Doherty et al. [An aneuploid mouse strain carrying human chromosome 21 with Down syndrome phenotypes. Science 309 (2005) 2033–2037] generated a trans-species aneuploid mouse line (Tc1) that carries an almost complete Hsa21. The Tc1 mouse is the most complete animal model for DS currently available. Tc1 mice show many features that relate to human DS, including alterations in memory, synaptic plasticity, cerebellar neuronal number, heart development and mandible size. Because motor deficits are one of the most frequently occurring features of DS, we have undertaken a detailed analysis of motor behaviour in cerebellum-dependent learning tasks that require high motor coordination and balance. In addition, basic electrophysiological properties of cerebellar circuitry and synaptic plasticity have been investigated. Our results reveal that, compared with controls, Tc1 mice exhibit a higher spontaneous locomotor activity, a reduced ability to habituate to their environments, a different gait and major deficits on several measures of motor coordination and balance in the rota rod and static rod tests. Moreover, cerebellar long-term depression is essentially normal in Tc1 mice, with only a slight difference in time course. Our observations provide further evidence that support the validity of the Tc1 mouse as a model for DS, which will help us to provide insights into the causal factors responsible for motor deficits observed in persons with DS.
INTRODUCTION
Down syndrome (DS) results from trisomy of human chromosome 21 [Hsa21 (1)] and occurs in ∼1 in 800 newborns. Although mental retardation remains the most striking and permanent feature of DS, most DS phenotypes are incompletely penetrant and variable in expressivity, with both genetic and environmental effects contributing to these differences. Several clinical features, including cognitive impairments, synaptic plasticity deficit, muscle hypotonia, short stature, craniofacial abnormalities and congenital heart disease, characterize the phenotype of DS (2–6).
Motor disability is widespread among individuals with DS (7). Persons with DS are frequently described as clumsy, they have different gait patterns (8,9) and show delays in the development of aspects of gross and fine motor skills (10,11). They also have difficulties with motor planning (12) and take more time to initiate and to complete a motor task compared with controls. Several studies have found that hand preference is less strongly developed and less consistent across and within activities in individuals with intellectual disabilities (13–15). Immaturity of motor skill has been proposed as a possible cause of weak hand preference (16). In addition, Groen et al. (15) recently showed that DS children with a stronger or more consistent hand preference had better language and memory skills, supporting the hypothesis that atypical laterality occurs more frequently below a certain IQ threshold. The neuropathological basis for motor dysfunction in DS persons is unknown. Individuals with DS have several neuroanatomical abnormalities, including a smaller cerebellar volume (17–20), that correlates, in DS mice models, with a reduced granule cell density (21–24). However, it is not known how these anatomical abnormalities influence cerebellar function and whether they are involved in motor learning deficits.
Mice provide a powerful experimental system for studies of mammalian aneuploidy (25). The Tc1 mouse is the most complete animal model for DS currently available. Tc1 mice are trisomic for ∼92% of Hsa21 (23). They not only exhibit many aspects of human DS, but also recapitulate several of the DS features present in other mouse models (26). Tc1 mice show alterations in heart development and mandible size, and have impaired short-term but spared long-term memory (23,27). These memory phenotypes are paralleled by a deficit in early long-term potentiation (LTP) and a normal maintenance of LTP over days in the hippocampus (23,27). In addition, Tc1 mice exhibit reduced cerebellar neuronal number (23). To better understand the consequence of a reduced neuronal density in the cerebellum on motor skills and learning, we have used a series of complementary assessments to evaluate different modalities of motor function of Tc1 mice, involving the analysis of spontaneous motor activity, static rod and rota rod performances, gait pattern and grip force. In view of the high prevalence of abnormal handedness among persons with DS, we also have undertaken an analysis of paw preference in Tc1 mice, as assessed in a food-reaching task. In parallel, we studied the physiological and morphological properties of Purkinje cells (PCs), which are the only output neurons of the cerebellar cortex. These cells integrate excitatory inputs from many thousands of parallel fibres (PFs, the axons of granule cells) and from a single climbing fibre (CF, the axons of inferior olive neurons). The conjunctive stimulation of PF and CF inputs to Purkinje neurons induces a prolonged decrease in the synaptic strength at PF–PC contacts, a phenomenon called long-term depression [LTD (28)]. Impairment of PF–PC LTD has been described in several mutant mice in association with motor learning deficits and with abnormal multiple innervation of adult PCs by CFs (29–32). In fact at birth, PCs are contacted by two or three CFs (33,34) that are progressively eliminated and only one CF input innervates each PC in adulthood. Improper innervation of single PC by multiple CFs has been observed in animals that have genetic mutations (35,36) and/or reduced granule cell numbers (37–39). Here, we have investigated the possibility that abnormal LTD and/or persistent multiple CF innervation of PCs contribute to motor learning deficits observed in Tc1 mice.
RESULTS
Hyperactivity in open-field exploration in Tc1 mice
Tc1 mice display a high level of spontaneous horizontal (locomotion) and vertical (rearing) activity when placed in an open-field compared with wild-type (WT) mice (Fig. 1A; F1,20=4.84, P < 0.05 and F1,20=6.29, P < 0.05, for horizontal and vertical activity, respectively). On average, Tc1 mice achieved 1.5-fold more horizontal and 2.1-fold more vertical activity than WT mice. These locomotor responses were day-dependent (F2,40=3.62, P < 0.05 and F2,40=4.17, P < 0.05, for horizontal and vertical activity, respectively), indicating habituation for both groups of mice. In the same way, Tc1 mice walked faster and spent less time walking slowly compared with their WT littermates (F1,20 = 4.86, P < 0.05 and F1,20=4.48, P < 0.05, respectively) and statistical analysis also revealed a significant effect of day (F2,40=3.52, P < 0.05 and F2,40=3.61, P < 0.05, for speed and time walking slowly, respectively). For all these variables, the genotype effect persisted during the 3 days of exposure. In addition, Tc1 mice failed to show within-session habituation, whereas WT mice exhibited a decrease in motor activity with time (Fig. 1B; genotype–time interaction: F1,60=9.73, P < 0.01 for horizontal activity). As expected, spontaneous locomotion was also genotype- and time-dependent (respectively, F1,60=12.31, P < 0.05 and F1,60=15.02, P < 0.001).
Figure 1.

Locomotor activity in WT (open circles) and Tc1 (filled circles) mice exposed to an open-field. (A) Spontaneous horizontal (locomotion) and vertical (rearing) activity of mice introduced in the open-field test. The results are expressed as distance travelled (m) and number of rearings, and show a significant hyperactivity in Tc1 mice compared with WT littermates. In addition, the mean speed (m/s) and the percentage of time walking slowly (≤5 cm/s) are shown below, and confirm the generalized hyperactive phenotype observed in Tc1 mice. (B) Distance travelled as a function of time in the open-field test. The distance travelled by animals was recorded daily every 5 min over a 10-min period. In contrast to WT mice (left), no habituation was observed in Tc1 mice (right). (C) Open-field exploration pattern and thigmotaxis behaviour. Mice are scored for the percentage of time spent in the central (a, white bars), intermediate (b, grey bars) and peripheral (c, black bars) areas (a, b and c, respectively, in inset diagram). Moreover, the percentage of distance travelled close to vertical surfaces was recorded in WT and Tc1 mice (right-hand graph). The zone analysis reveals a difference of exploration pattern between Tc1 and WT mice in the open-field, with Tc1 mice showing a greater tendency to explore the centre of the field and a reduced tendency for thigmotaxis. Values represent means ± S.E.M.
Stereotypic behaviour is described as abnormal and repetitive motor activity that serves no apparent purpose. As stereotypies are common in individuals with mental retardation and have been observed in approximately one-third of persons with DS (40), we have assessed the stereotypic phenotypes of the Tc1 mice in the open-field test. In rodents, stereotypies include repetitive grooming, sniffing, licking and gnawing. The evaluation of the degree of spontaneous stereotyped behaviour revealed increased grooming behaviour in Tc1 mice compared with WT mice (WT = 5 and Tc1 = 7 grooming in average, z = −2.14, P < 0.05).
The zone analysis (spatial distribution of locomotion, e.g. periphery versus centre of the open-field) revealed that all mice showed a strong preference for the periphery (F2,60=325.36, P < 0.0001). However, the open-field exploration pattern is different between Tc1 and WT mice (Fig. 1C; genotype–area interaction: F2,60=27.10, P < 0.0001). Compared with WT, Tc1 mice spent less time in the periphery ring and more in the central and intermediate areas. Day–area interaction has also been observed (F4,120=9.82, P < 0.0001). Moreover, Tc1 mice showed less thigmotaxis (e.g. avoidance of the centre) than WT mice (F1,20=4.81, P < 0.05). Statistical analysis also revealed a day effect (F2,40=3.18, P = 0.05).
Severe deficits in motor skills and learning in different motor coordination tasks in Tc1 mice
We next examined motor coordination of Tc1 mice on a static rod. To determine whether Tc1 and WT mice differed on their initial performance in this task, differences between groups in the latency to reach the table on day 1 were examined. There was no significant difference between the groups for this measure of initial motor skill. However, after an average of 10 days of training, our data also showed that Tc1 mice needed significantly more time to reach the home table (Fig. 2; F1,16=6.29, P = 0.05). Moreover, 19% of Tc1 mice, but only 4% of WT mice fell off the rod. We also noticed that Tc1 mice exhibit a great number of hindpaw slips on the static rod. Taken together, these results indicate impaired balance and coordination of movement in Tc1 mice. The analysis of the data was done after exclusion of trials during which the animal remained inactive on the rod. Interestingly, WT mice were more likely to participate in inactive behaviour. On a total of 90 trials per group, only two trials had to be excluded in Tc1 mice, whereas 14 trials were eliminated in WT mice.
Figure 2.
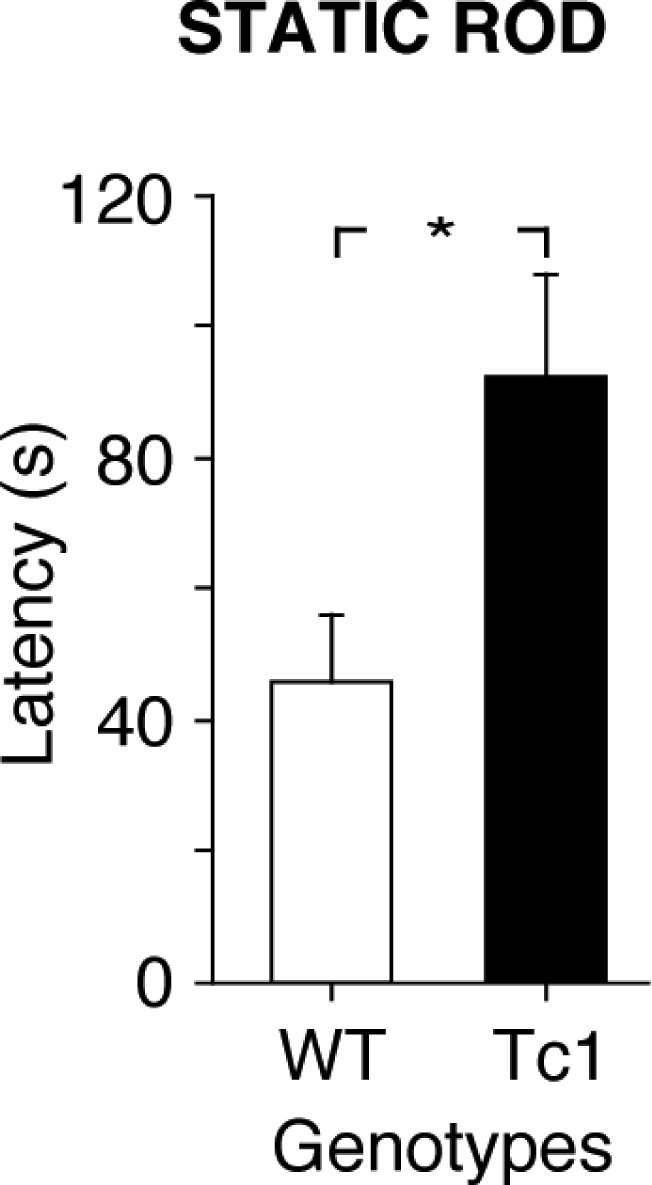
Static rod performance of WT (white bars) and Tc1 (black bars) mice. Mice are scored for the time (s) they took to reach the home table (maximum time allowed: 5 min). The results show an increased latency in Tc1 mice. Values represent means ± S.E.M. *P < 0.05, compared with WT mice.
To further assess motor coordination and to prevent inactive behaviour, Tc1 mice and their control littermates of 2–2.5 months were tested on an accelerating rod. There was a significant difference in the latency to fall on trial 1 of day 1 between the groups for this measure of initial motor skill (WT = 38.2 ± 5.19 and Tc1 = 12.67 ± 2.16, F1,20=23.38, P < 0.0001). In addition, during the training phase, the latency and speed (in rpm) at which Tc1 mice fell from the rod were much lower than those of WT mice (Fig. 3A left and middle; F1,20=38.01, P < 0.0001 and F1,20=40.96, P < 0.0001, respectively). Even at the end of the training (third day), Tc1 mice could not stay on the rod longer than 17 s and could not balance on the rod when the speed exceeded 6 rpm (63 s and 11 rpm for WT mice). The main statistical analysis also revealed a day effect (for latency F2,40=8.31, P = 0.001 and for speed F2,40=8.22, P = 0.001) and a significant genotype–day interaction (for latency F2,40=3.81, P < 0.05 and for speed F2,40=3.51, P < 0.05) which was further analysed. Post hoc analysis revealed a significant effect of day for WT mice (for latency F2,18=5.57, P < 0.05 and for speed F2,18=5.24, P < 0.05) but not for Tc1 mice, indicating that only WT mice exhibited an improvement of their performance across days. During the testing phase at constant speeds, the performances of Tc1 mice are significantly worse than WT mice (Fig. 3A right; F1,20=30.47, P < 0.0001). Furthermore, although all mice show better performances at lower speeds (F6,120=103.83, P < 0.0001), Tc1 mice are systematically worse for all speeds than WT mice (genotype–speed interaction: F6,120=35.08, P < 0.0001). For example, at the lowest speed, Tc1 mice fell off the rod more than three times quicker compared with WT mice. The whole of this experiment has been replicated on an independent group of 7–9-month-old mice (n = 9 per group). Similar results have been observed in this new group of animals (data not shown), showing the robustness of our results and reinforcing our conclusion of major impairment of motor skill and learning in Tc1 mice.
Figure 3.

Rota rod performance of WT (open circles) and Tc1 (filled circles) mice. (A, left, centre) Training phase. Results are expressed as time (s), that mice remained on an accelerating rota rod (4–40 rpm over 5 min) before falling (left panel), and the mean rotational velocity at the time of falling (middle panel). (A, right) Test phase. The graphs plot the time (s) that mice stayed on the rota rod when tested at constant speeds between 4 and 40 rpm (2 min in each case). (B) During training at a constant speed (4 rpm for 5 min), mice were scored for the time (s) they remained on the rota rod. The major conclusion from these experiments is that Tc1 mice show impaired motor performance and learning in the rota rod task. Values represent means ± S.E.M.
The accelerating mode used in the preceding experiment could have prevented the learning of Tc1 mice on the rota rod task. To test the effect of the training difficulty on the learning performances of Tc1 mice, we trained a new group of mice on a rota rod turning at the lowest constant speed (4 rpm). Contrary to what was observed in the accelerating version of the rota rod, there was no significant difference in the latency to fall on trial 1 of day 1 between the groups, demonstrating that this version of the task is indeed simpler. However, during the 4 training days, analysis of the time mice could balance on the rod revealed a genotype effect (Fig. 3B; F1,18=7.96, P < 0.05) and a day effect (F3,54=5.16, P < 0.01). Even under less difficult conditions, Tc1 mice still spent significantly less time on the rod compared with WT mice. In addition, further post hoc analysis revealed a significant effect of day for WT mice but not for Tc1 mice, indicating that WT mice improved the time they could balance on the rod (F3,27=3.88, P < 0.05), whereas Tc1 mice showed no improvement, and never approached the performance of WT mice. These data strongly suggest that the poor performance of the Tc1 mice in the rota rod test is due to a general impaired motor learning.
Note that the observed differences cannot be attributed to passive rotation (grabbing the rod and rotating without having to ambulate) because this behaviour was not observed in either group in all the rota rod experiments. Rota rod performance is also sensitive to body weight with mice of smaller strains having longer latencies to fall and mice of larger weight having a shorter latencies (41). However, the deficits of Tc1 mice in rota rod test cannot be ascribed to a difference in body weight. Indeed, at 2–2.5-month-old, no difference in body weight was observed between groups (WT = 29.4 ± 1.0 and Tc1 = 30.8 ± 0.6), and at 7–9-month-old, Tc1 mice displayed a 20% reduction in body weight compared with their littermates (WT = 41.8 ± 1.5 and Tc1 = 34.8 ± 0.9; F1,16=15.43, P < 0.01).
Muscle strength is normal in Tc1 mice
In order to test if poor performances of Tc1 mice on the rota rod were due to abnormal muscle strength, they were assessed with the grip test. Our results revealed no significant difference, either for the front legs (F1,26=2.13, P = 0.16) or for the four legs (F1,26=0.55, P = 0.46), in the grip forces produced by Tc1 and WT mice (Fig. 4). These data demonstrate that Tc1 mice have no impairment in muscle strength and their impaired rota rod motor learning task is not due to differences in grip capability.
Figure 4.

Grip force measurement in WT (white bars) and Tc1 (black bars) mice. The results represent the mean grip force (g) immediately prior to the animal releasing its grasp from the grid (see Methods). No difference was observed between Tc1 and WT mice either for four paws or for front legs, indicating normal muscles strength in Tc1 mice. Values represent means ± S.E.M.
The gait pattern is slightly different in Tc1 mice
Next, to evaluate the gait of Tc1 mice, we analysed footprint patterns and found that Tc1 mice did not exhibit major gait abnormalities. As shown in Table 1, no significant difference between Tc1 and WT mice was observed for stride lengths of fore- and hind-paws. However, the limb base widths trended to be different between Tc1 and WT mice, but only for the forelegs. Indeed, Tc1 mice presented a trend toward increased foreleg width (F1,25 = 3.99, P = 0.0568). In addition, front–hind leg distances were significantly reduced in Tc1 mice compared with WT mice (F1,25 = 10.44, P < 0.01). These observed differences cannot be attributed to a difference in the size of the Tc1 mice. Indeed, the nose-to-base body length was similar in both groups of mice.
Table 1.
Paw print performance in adult WT and Tc1 mice
| WT | Tc1 | |
|---|---|---|
| Nose-to-base body length (cm) | 101.4 ± 1.4 | 102.5 ± 1.6 |
| Right front stride length (cm) | 5.7 ± 0.3 | 5.7 ± 0.3 |
| Right hind stride length (cm) | 6.3 ± 0.3 | 6.0 ± 0.3 |
| Forelegs width (cm) | 1.8 ± 0.1 | 2.0 ± 0.1 |
| Hindlegs width (cm) | 3.2 ± 0.1 | 3.3 ± 0.1 |
| Right front–hind leg distance (cm) | 8.5 ± 0.2 | 7.5 ± 0.2** |
Footprint pattern analysis in WT and Tc1 mice. Data are expressed as mean ± S.E.M.
**P < 0.01, compared with WT mice.
The direction and the degree of lateralization are not affected in Tc1 mice
Since the association between atypical laterality and mental retardation has been reported several times, particularly in DS, we have tested Tc1 mice for paw preference in a food-reaching task. No overall effects of the genotype were observed for the direction of lateralization (data not shown). Whatever the genotype, there were as many right-handed (right paw entries, RPE > 25) as left-handed subjects (RPE < 25) in all groups of mice (frequency of right-handed, WT = 0.48 and Tc1 = 0.44). Moreover, no significant differences were detected for the degree of lateralization between genotypes (data not shown).
When tested in the paw preference test, Tc1 mice showed normal behavioural lateralization but had jerkier and less precise movements compared with the WT mice, suggesting that Tc1 mice have reduced fine motor skills.
Synaptic plasticity and main electrophysiological properties of cerebellar PCs are not impaired in Tc1 mice
The multiple behavioural tests performed onto Tc1 mice show that these mice have deficits in motor learning (see above). Furthermore, it has previously been shown that Tc1 mice, like other animal models of DS, present a lower density of granular cells in the cerebellum compared with their WT littermates (23). We therefore studied cerebellar LTD between PFs and PCs, a form of synaptic plasticity that can be putatively implicated in cerebellar-dependent learning (42,43). The induction protocol consisted in depolarizing PC (−60 to 0 mV), while simultaneously stimulating afferent PF. Figure 5A and B summarizes our results: conjunctive stimulation evoked a robust, long-lasting depression of the excitatory post-synaptic currents (EPSCs) in both animal groups (results are from seven WT and six Tc1 mice). However, despite a tendency to express lower level of cerebellar LTD for the Tc1 mice compared with WT mice, this difference was not statistically significant when assessed 30–40 min after the second conditioned stimulus. In fact, the mean amplitude of the evoked EPSCs was 54.9 ± 5.8% of the control EPSCs in WT (n = 12 cells from 12 slices) and 66.1 ± 8.0% in Tc1 mice (n = 13 cells from 13 slices). To obtain a more comprehensive measure of EPSC depression over time, we compared the EPSC temporal evolution after the second pairing and we found a time effect (F42,840 = 13.77, P < 0.0001) and a significant genotype–time interaction (F42,840 = 4.76, P < 0.0001). Further post hoc analysis to test for a main effect of time in both groups revealed a significant effect only in the WT group (F42,420 = 20.09, P < 0.0001), indicating that the temporal pattern is significantly different between the two animal groups.
Figure 5.

Long-term synaptic plasticity and CF innervation in WT (open circles) and Tc1 (filled circles) PCs. (A) Time course of PF-evoked EPSCs before and after LTD induction (WT: n = 12 cells and Tc1: n = 13 cells). Baseline responses were recorded for 3 min. Then, two successive pairing protocols separated by 5 min were delivered (arrows) and responses were monitored for at least 40 min. Each data point presented is an average of 20 successive EPSCs. The amplitudes of PF-EPSCs were normalized to baseline values, which were the average responses over the 3 min just before the pairing, and LTD was quantified as percentage reduction of baseline EPSCs. Inset traces are EPSCs from a single PC from WT and Tc1 mice recorded before pairing (a) and 34 min after the second pairing (b). Values represent means ± S.E.M. (B) The amount of the EPSC depression, measured 34 min after LTD induction, is displayed for each WT and Tc1 PC. The open bars indicate the mean values for each group. (C) Top: examples of mono- and multi-innervated PCs from WT (left) and Tc1 (right) mice (holding potential: −20 mV) evoked by stimulation of the granular layer. In each example, the average of 5–7 EPSCs above and below threshold is superimposed. Smallest EPSCs are consequence of the stimulation of granule cells while trying to excite CFs. Bottom: plots of CF-EPSC amplitudes against time are shown (same cells as the top). Note the stepwise variation of the response with progressively increasing stimulation strength. In summary, no differences were detected in the magnitude of LTD or in the proportion of PCs multiply innervated by CF between WT and Tc1 mice.
To assess the physiological consequences of the transchromosomic manipulation in the cerebellum of Tc1 animals, we investigated potential alterations in the PF- or CF-evoked EPSCs in mouse cerebellar PCs. EPSCs evoked in PCs by CF stimulation in WT and Tc1 mice presented similar kinetics, whereas PF-EPSCs from Tc1 mice showed significantly slower kinetics when compared with WT littermates (F1,27=7.34, P < 0.05 and F1,27=11,74, P < 0.01 for rise time and decay time, respectively; Table 2). Evoked EPSCs were totally abolished by bath application of 10 µM CNQX (6-cyano-7-nitro-quinoxaline-2,3-dion), an antagonist of α-amino-3-hydroxy-5-methyl-4-propionic acid (AMPA)/Kainate receptors, in both WT and Tc1 mice (n = 3 for each group, data not shown) indicating that they are mainly mediated by the activation of these glutamatergic receptors in both animal groups. In a paired-pulse protocol, the ratio between the mean amplitudes of the second EPSC over the first EPSC (paired-pulse ratio, PPR) is related to the initial release probability. In control experiments on WT mice (five animals), PF to PC synapses show a facilitation (PPR = 1.22 ± 0.03, n = 13 cells from 12 slices), whereas the CF to PC synapse is characterized by a paired-pulse depression (PPD; PPR = 0.73 ± 0.02, n = 13 cells from eight slices). In Tc1 mice (four animals), we found similar values for both parameters: 1.20 ± 0.03 (n = 13 cells from 12 slices) for the paired-pulse facilitation (PPF) and 0.72 ± 0.03 (n = 22 cells from 11 slices) for the PPD suggesting that there is no difference in release probability at those two synapses in Tc1 and WT mice.
Table 2.
Basal electrophysiological parameters of PCs in slices
| WT | Tc1 | |
|---|---|---|
| R input (MΩ) | 338 ± 57 (n = 22) | 363 ± 52 (n = 17) |
| CF-EPSCs | ||
| Amplitude (nA) | 1.7 ± 0.3 (n = 13) | 1.8 ± 0.5 (n = 22) |
| Rise time (ms) | 0.72 ± 0.06 (n = 13) | 0.68 ± 0.05 (n = 18) |
| Decay time constant (ms) | 8.4 ± 0.4 (n = 12) | 7.73 ± 0.33 (n = 21) |
| PF-EPSCs | ||
| Rise time (ms) | 1.18 ± 0.07 (n = 15) | 1.56 ± 0.12 (n = 14)* |
| Decay time constant (ms) | 6.9 ± 0.5 (n = 15) | 10.4 ± 0.9 (n = 14)** |
Properties of EPSCs from WT and Tc1 mice. Rise times are calculated from the interval between 10 and 90% of the EPSC peak amplitude. The decay time was measured onto the averaged EPSC and it is best-fit by a monoexponential function. The number of analysed PCs is indicated by n. For analysis of input resistance, R, PCs were recorded in a total of 18 slices from eight WT mice and in 15 slices from nine Tc1 mice. CF-EPSC kinetics were analysed in PCs recorded in eight slices from five WT mice and in 11 slices from four Tc1 mice, whereas slices from six mice were used to analyse PF-EPSCs kinetics (12 slices for WT mice and 14 slices for Tc1 mice).
*P < 0.05, compared with WT mice.
**P < 0.01, compared with WT mice.
PCs are innervated by multiple CFs at birth but undergo an activity-dependent refinement, such that, by postnatal day 21, most are contacted by a single CF (33,44). A wide variety of naturally occurring and induced mutations in mice can result in persistent multiple CF innervation. Therefore, the presence of a multiple CF innervation was investigated in WT and Tc1 animals (results are from seven and four mice, respectively). Electrical stimulation of the granular layer evoked typical all-or-none CF-mediated EPSCs (Fig. 5C). Once a CF-EPSC was elicited, we gradually increased the stimulus intensity in order to check for possible multiple innervations. In WT mice, in 3 of 19 cells (from 13 slices), a second current step appeared as the stimulus intensity was increased further, indicating the innervation by two CFs (Fig. 5C, left). In Tc1 mice only one PC presented CF multiple innervation, whereas the others (n = 21, from 11 slices) presented the typical all-or-none response (Fig. 5C, right). χ2-test for the frequency data revealed that the different percentage of multinnervated PC between the two animal groups is not statistically significant.
To examine the morphology of recorded PCs in Tc1 mice, we routinely added biocytin to the whole-cell patch pipette. In general, neuronal dendrites appear normal, extending through the molecular layer to reach the pial surface (Fig. 6A). The area of the territory occupied by the complex dendritic arborisation, the perimeter and the cell diameter of the recorded PCs were similar in WT and Tc1 mice (Fig. 6B).
Figure 6.

Light microscopic images of PCs from WT and Tc1 mice. (A) Purkinje neurons recorded with biocytin in the patch pipette show typical PC morphology and no overt differences in the positioning and overall dendritic morphology. The image of the Tc1 PC (right) was reconstructed by superposition of several stacks acquired at different z-planes. (B) Cell body transverse diameter (n = 6 for WT and n = 5 for Tc1) and the area occupied by dendritic tree in the molecular layer (WT: n = 5 and Tc1: n = 8) were not different between the two animal groups. Values represent means ± S.E.M.
DISCUSSION
The present findings clearly demonstrate that Tc1 mice display major changes in novelty-driven spontaneous activity characterized by spontaneous hyperlocomotion, abnormal exploratory behaviour and impaired habituation to the test environment. In addition, although Tc1 mice have an approximately normal gait, they exhibit major impairments in motor coordination in cerebellum-dependent learning tasks. In both static and rota rod tests, they present poor motor skills and learning, which cannot be explained by a deficit in muscle strength. In terms of handedness, no difference was observed between Tc1 and WT mice. To assess physiological changes in the cerebellum of Tc1 mice, several forms of short- and long-term synaptic plasticity at the PF–PC synapse were investigated. We found no detectable abnormalities on measures of pre- and post-synaptic function at CF and PF synapses in Tc1 mice. CF–PC innervation is also normal in Tc1 mice. Moreover, LTD at PF–PC synapses, a phenomenon important for cerebellar motor learning (43), was essentially normal in Tc1 mice, with only a slight difference in time course.
In 2005, O'Doherty et al. (23) analysed generalized activity and motor coordination in Tc1 mice and showed that Tc1 mice present a trend toward hyperactivity in an open-field test and no indication of a motor deficit in the static rod task. Although the two reports present similar findings with respect to hyperactivity, different results have been found for behaviour on the static rod. In the present experiments, performance of Tc1 mice was significantly impaired, whereas no difference was seen in the earlier work. A possible reason for this difference is that the present data were collected from Tc1 mice on a C57BL/6x129S2 (F2) genetic background, whereas the earlier study used Tc1 mice on C3H/HeJ. Alterations in genetic background are known to contribute to the altered phenotypic expression of mutations (45).
Tc1 mice show a high degree of mosaicism (meaning that some nervous cells have lost the Hsa21) and are maintained on a segregating genetic background involving two inbred strains, which increased the genetic background heterogeneity. Although the resulting increased intra-group variability may obscure differences among Tc1 and control mice, we were able to demonstrate very robust significant differences between both the groups. Our study not only extends, but also characterizes more precisely the motor performances of Tc1 mice in tests in which the paradigms and the difficulties are different.
One of the most obvious and highly penetrant motor behavioural phenotypes we observed in Tc1 mice is hyperactivity. Analysis of all parameters indicative of activity level, including number of rearings, total travelled distance, speed and percent of time walking slowly, shows that exposure to the novel environment of the open-field triggered a higher level of spontaneous horizontal and vertical activity in Tc1 mice than in WT littermates. This hyperactivity has also been observed in different tasks, using different paradigms, and under different experimental conditions. Indeed, in a previous study, Tc1 mice were tested for spatial learning and memory performance in the Morris watermaze (27). In all the versions of the maze (spatial, cued and working memory), Tc1 mice swam faster than their WT littermates (data not shown), demonstrating that their heightened activity can be generalized to different environmental conditions under different levels of anxiety. This finding is in accordance with studies showing that DS may be associated with hyperactivity (3,5,46).
Various DS models in mice have been developed in order to study the consequences of increased gene dosage in DS and to specifically address phenotype/genotype relationships. While Tc1 mice are trisomic for 92% of Hsa21, other well-studied models contain a partial mouse trisomy 16 (Mmu16): Ts65Dn (47), Ts1Cje (48) and Ms1Cje/Ts65Dn (49) with, respectively, 132, 85 and 53 orthologs of chromosome 21 genes in three copies. Ms1Cje/Ts65Dn is a mouse segmentally trisomic for the region by which Ts1Cje and Ts65Dn differ. These different DS models also present abnormal spontaneous locomotor activity. As Tc1 mice, Ts65Dn mice have been characterized as hyperactive in the open-field task (47,49–53). In contrast, Ts1Cje mice were found to be hypoactive, and Ms1Cje/Ts65Dn mice were not different from euploid mice in their activity (49). The hypoactive phenotype observed in Ts1Cje mice is surprising and exemplifies the effect of modifier genes on the expression of a given phenotype. In addition, these different animal models for DS with different degrees of phenotypic impact illustrate the fact that we are trying to model a human condition of multidimensional nature. DS affects the central nervous system in many different ways, producing various degrees of disability with variable penetrance.
Preference for the peripheral area and thigmotaxis are behaviours normally observed in mice during their adaptation to an unknown environment. The spatial analysis of the locomotor behaviour shows that Tc1 mice exhibit decreased thigmotaxis and increased exploration of the centre of the open-field compared with WT mice. This pattern of exploration is observed from the very start of the test and persists during the 3 days of exposure. Our findings indicate that Tc1 mice have an unusual reduced behavioural inhibition in response to novelty, which could be explained by their hyperactivity and/or could also suggest that Tc1 mice exhibit a reduced level of anxiety.
Examination of the changing kinetics of locomotor activity during training provides an index of the interaction between locomotion and cognition. Motor activation in response to a novel environment is stimulated by the arousal salience of the novel stimulus. Normally this behaviour decreases when rodents are habituated to the stimulus. A variable representing the change in activity over time (distance travelled in the first 5 min and that in the last 5 min of the 10-min test) was analysed to quantify the locomotor adaptation of Tc1 mice to their environment. The results obtained in the open-field demonstrated not only that locomotor activity of Tc1 mice is higher, but also that its temporal pattern is different from that observed in WT mice. The level of activity dropped after the first 5-min interval in the WT mice, whereas it remained high during the entire 10 min session in Tc1 mice, indicating a failure to adapt to their environment. In addition, in the static rod task, some mice abandoned their attempt to gain the platform and remained stationary on the rod until picked up at the end of the 5-min trial. This behaviour was mainly observed in control mice. The relative absence of such behaviour in Tc1 mice could reflect their insecurity on the rod as a direct consequence of their impaired motor coordination. Alternatively, the behaviour of Tc1 animals could be interpreted as a limited habituation to a new environment. Similar conclusions can be drawn from results observed in different versions of the Morris water maze. Over time, Tc1 mice showed relatively little diminution in swimming speed compared with control mice, pointing again to their limited capacity to adapt to novel stimuli (data not shown). It is possible that the strong hyperactivity of Tc1 mice interferes with the establishment of a normal exploratory behaviour of the novel environment, thereby preventing locomotor habituation following exposure to the same environment. In the open-field task, the lack of within-session habituation to novelty in Tc1 mice may be interpreted as an attention deficit or some form of memory disorder and suggests that Tc1 mice are unable to learn (i.e. became familiar with) novel stimuli. This hypothesis is supported by our previous findings, showing that Tc1 mice are selectively impaired in short-term memories when tested in different behavioural tasks (23,27). Tc1 mice will help to gain insight into the relationships between motor and cognitive dysfunctions.
Another obvious behavioural phenotype observed in Tc1 mice is a general impairment in motor skills and learning. They are affected in balance and motor coordination. These impairments were observed in different tasks involving different levels of difficulties, the static rod and the accelerating and rotating rod tests. Interestingly, depending on the difficulty of the task, assessments of Ts65Dn mice in the rota rod test revealed a range of phenotypes, from moderate-to-severe deficits to improvements in balance and motor coordination compared with their control littermates (21,51,54–57). Compared with Ts65Dn mice, the Tc1 mice displayed more severe alterations in motor or posture control and motor learning in different test situations. Even in the simpler tasks (e.g. static rod and rota rod turning at 4 rpm), they never approached the performance of control mice and they showed almost no improvement in performance over successive trials, indicating a deficit in cerebellar-dependent motor learning. Tc1 mice have many more orthologs of chromosome 21 genes in three copies compared with Ts65Dn mice, which could explain their more pronounced motor impairment.
As in Ts65Dn mice (57), increased stereotypic behaviour is a part of the phenotypic profile of Tc1 mice, strengthening the hypothesis of a cerebellar dysfunction. Interestingly, severity of stereotypic behaviours in DS, specifically those which typify DS with comorbid autism spectrum disorder (58), is correlated with the volume of cerebellar white matter.
Humans with DS exhibit a reduced cerebellar volume and a reduction in granule cell density (17–20). Tc1 mice display similar cerebellar deficits (23) but it is unknown how this anatomical abnormality influences cerebellar function. The importance of the cerebellum for learning motor skills suggested that the motor learning deficits reported in this work might be explained by changes in cerebellar synaptic plasticity. We therefore studied LTD at the PF–PC synapse using an induction protocol that was successful in the vast majority of WT recorded cells. In WT mice, LTD is characterized by a slow onset similar to that seen following conjunctive PF and CF stimulation in adult mice (59). In Tc1 mice, after the first pairing, the EPSC decreased more rapidly than in WT mice suggesting that the mechanisms underlying the first phase of LTD induction are different between WT and Tc1 mice. However, we found no significant changes in the mean amplitude of PF-EPSC depression 30–40 min after the second pairing protocol, though there is a trend toward the expression of reduced LTD in Tc1 mice. Tc1 mice display a significant degree of mosaicism (23), and it is unlikely that every PC cell in Tc1 mice contains Hsa21. As a result, the full extent of the LTD phenotype is probably underestimated across a group of PCs investigated by patch clamp recording. An immunocytochemical assay able to detect Hsa21 in recorded PC would greatly help in overcoming this difficulty because it would allow correlation between the degree of synaptic plasticity in the recorded Tc1-PC and its genetic content.
PC dendrites are characterized by a proximal and a distal compartment on which CFs and PFs, respectively, impinge. The distribution of the PF and CF synapses onto separate regions of the PC dendritic tree is the result of competition during development, the end result of which is that each PC is innervated by a single CF (60). CF–PC synapses in WT and Tc1 mice are indistinguishable at the level of EPSC kinetics, short-term plasticity and in both genotypes only one CF innervates each PC. In contrast, EPSCs evoked by PF stimulation in Tc1 PCs displayed a slower time course than PF-EPSCs in WT mice. Several factors could potentially contribute to this difference. First, inadequate voltage clamp in experiments performed on Tc1 mice relative to WT mice. However, access resistance was similar in the two animal groups (9.1 ± 0.9 and 8.2 ± 0.6 MΩ in WT and Tc1 mice, respectively) and the EPSC kinetics at the CF–PC synapses were not different indicating that the recording conditions were similar in the two set of experiments. The second reason is a change in the electrotonic length between the recording electrode and the site of PF synapses. Even though we observed normal gross PC morphology in Tc1 mice, spine distribution could still differ in Tc1 PCs with PF–PC spines located further from the soma. Finally, it has recently been shown that AMPA receptors trafficking and gating is regulated by a family of transmembrane AMPA receptor regulatory proteins (TARPs). In particular, some TARP subtypes slow down AMPA receptor activation and deactivation kinetics (61,62). It is possible, therefore, that AMPA receptor subunit composition and/or TARP subtype expression might differ in Tc1 mice, explaining the slower time courses of PF-EPSCs.
To our knowledge, this is the first neurophysiological analysis of cerebellar neurons in a mouse model of DS. It is surprising that the robust impairment in motor learning observed in Tc1 mice is not reflected in a concomitant reduction of cerebellar LTD. A correlation of this type has been reported in several types of genetically engineered mice with changes in gene expression affecting cerebellar function [for instance, mGluR1−/− mice: (29,30); PKC−/− mice: (35); α-CAMKII−/− mice: (59)]. However, several types of synaptic plasticity have been recently described in the cerebellar cortex including PF–PC LTP (63–65), CF-PC LTD (66) and LTP at the synapse between PF and molecular layer GABAergic interneurons (67,68). Moreover, several lines of evidence indicate that plasticity mechanisms originating in deep cerebellar nuclei and inferior olive may also contribute to the regulation of motor learning tasks suggesting that multiple mechanisms contribute to the memory formation for cerebellum-dependent forms of motor learning (69,70).
It is possible that some aspects of the motor dysfunction of Tc1 mice are a direct result of the hippocampal defect. It is well known that, in rodents, the hippocampus is a critical structure for information processing in a variety of memory tasks (71–75). However, often underestimated but of equal importance, rodents with hippocampal impairment may display other behavioural abnormalities such as increased locomotor activity. For example, hyperactivity was identified following hippocampal lesions in mice (76,77), and in mouse models of DS associated with hippocampal defects (47,49–53,78–86). As has been observed in all DS models in mice (47–49,51,52,87), Tc1 mice exhibit physiological changes in hippocampus that are concomitant with significant learning deficits in various behavioural tasks that are putatively hippocampus-dependent (23,27). These findings suggest that hyperactivity in Tc1 mice may be due to hippocampal failure. The presence of a hippocampal phenotype is of great interest because a growing body of evidence now suggests that a significant part of the phenotype generated by the genetic disorder in DS can be related to the consequences of hippocampal dysfunction (88–90). It will thus be important to further explore whether hyperactivity is directly related to hippocampal defects in Tc1 animals or alternatively to alterations in other brain regions or neurotransmitter systems. Indeed, a recent meta-analysis show that at least 12 different brain regions can increase locomotor activity and most neurotransmitter systems can give rise to a hyperactive phenotype (77).
The present study expands the behavioural profile of the Tc1 mouse beyond the deficits in working and recognition memory described in our previous reports (23,27). Taken together, the behavioural analysis reported in this paper has revealed a range of significant abnormalities in locomotor activity and motor performance in Tc1 mice, illustrated by their hyperactive, imbalanced and uncoordinated motor behaviour, as well as their increased stereotypic behaviour, consistent with cerebellar and hippocampal dysfunctions. Many, if not all, of these phenotypic features are also found in humans with DS, suggesting that Tc1 mice are affected in similar ways in response to the common genetic insult in DS. The general agreement between these results and observations made on individuals with DS, as well as on mouse models, further support the validity of the Tc1 mouse as a model for DS. Since the discovery of the chromosomal anomaly causing DS and the demonstration of the relationship between increased gene dose and changes in DS brain structure and function (91), a major goal has been to characterize the number and nature of genes involved in determining DS. Future comparative studies with other segmental trisomy strains should help to identify candidate genes from the different triplicated genomic segments that are likely to contribute to the motor behavioural phenotype. In addition, to confirm the involvement of candidate genes in motor impairment, breeding strategies might be used to rescue normal gene dosage by crossing Tc1 mice with mouse strains monosomic for segments of mouse chromosomes syntenic to Hsa21, or with heterozygous mutant mice lacking a single mouse copy of cognate Hsa21 genes. Understanding the mechanisms that underlie the DS motor phenotype will be critical to the successful development of pharmacological or genetic therapies.
MATERIALS AND METHODS
Animals
O'Doherty et al. (23) generated the transchromosomic mouse line Tc1 by using the technique of irradiation microcell-mediated chromosome transfer. This trans-species aneuploid mouse line stably transmits a freely segregating, almost complete copy of Hsa21 in a C57BL/6Jx129S8 (F2) genetic background. Tc1 and their WT littermates are obtained from the mating of C57BL/6Jx129S8 (F1) Tc1 females with C57BL/6Jx129S8 (F1) males. The genotype of the mice was determined by a polymerase chain reaction analysis as previously described (23). Animals were weaned at 3 weeks and were then housed by gender and litter under standard conditions, with food and water available ad libitum.
Experiments were conducted on adult male mice during the light phase of a 12 h light/dark schedule (with lights on at 07:30 h) by experimenters who were blind to genotypes. All experiments were performed in compliance with UK Home Office regulations and guidelines of the French Animal Care Committee. All behavioural studies were conducted on independent groups of naive animals and were replicated several times.
Locomotor activity and exploratory behaviour
Open-field exploration
The open-field test exploits the tendency of rodents to explore new environments, as measured by ambulation. This test assesses spontaneous locomotion, exploratory behaviour and habituation of animals to their environment. Initially, rodents show a strong tendency to stay close to walls that limit their environment [thigmotaxis (92)]. Later, they cross the open-field arena more frequently, but locomotion gradually declines, indicating within-session habituation. This behaviour is classically observed under low anxiogenic environmental conditions.
In our paradigm, qualitative and quantitative analyses of spontaneous activity were assessed over a 10-min period in a circular arena (65 cm in diameter) dimly illuminated during 3 consecutive days. Mice (n = 10–12 per group) were placed at the centre of the open-field at the beginning of each session, and subsequent exploration was recorded and scored every 5 min to assess within-session habituation. During this task, we analysed the temporal characteristics and spatial distribution of mouse locomotion using a video tracking system (HVS Image, Buckingham, UK), allowing the automatic calculation of the mean distance travelled, mean speed, percent of time walking slowly (≤5 cm/s), percent of time spent in three concentric rings (central, intermediate and peripheral) and percent of thigmotaxis. The number of rearings (occasions when an animal rises briefly on its hind feet) and stereotypies, including grooming and jumping, were manually scored.
Motor coordination
Static rod
Balance and coordination of movement were assessed using a wooden rod of 60 cm in length and 2.8 cm in diameter. This rod protruded from a table elevated 80 cm above a padded floor. Mice (n = 9 per group) were placed at the free end of the rod facing away from the home table and were allowed a maximum period of 5 min to turn 180° and reach the table. The time taken to achieve this was scored for each mouse. Animals falling off the rod were allocated a maximum score of 5 min. Mice received one trial per day for 10 consecutive days. In the course of time, it turned out that some mice abandoned the attempt to navigate the rod, presumably because they learned that if they waited without moving for 5 min the experimenter would return them to their home cage. This behaviour interfered with the interpretation of our results because mice conducting themselves in this unsporting fashion were not necessarily motor impaired but would potentially have received the same scores as impaired animals that fell off the rod or were not able to complete the task in under 5 min. Thus, trials in which the animal remained inactive on the rod were excluded from further analysis.
Rota rod
To further investigate motor performance and cerebellum-dependent learning, we used a rota rod apparatus (Bioseb, France). Before testing began, mice (n = 10 WT and 12 Tc1 mice) were given a pre-training trial in order to familiarize them with the procedure. They were trained to grip the rod by placing them on the rod rotating at the lowest speed (4 rpm) for a total of 30 s regardless of the number of falls. The mouse was immediately returned to the rotating rod following each fall. After pre-training, mice were then trained over 3 days to balance on an accelerating rod and on the fourth day were tested at various rotation speeds. For each trial, the mouse was placed on the rod facing opposite to the direction of rotation and was allowed to ambulate until it fell from the rod or the maximum observation time had elapsed. During the training period, mice were placed on the rota rod starting at 4 rpm and slowly accelerating to 40 rpm, so that the longer the mouse remained on the rod, the faster it had to move to maintain balance. The maximum observation time was 5 min. Animals received four trials per day with a 1-h inter-trial interval (ITI). During testing on the fourth day, animals received seven consecutive 2-min trials at constant speeds of 40, 34, 28, 22, 16, 10 and 4 rpm. This protocol was repeated four times with a 1-h ITI.
An independent group of naive animals was assessed in a simplified version of the rota rod in which the speed of the rod was kept constant at 4 rpm. After the familiarization session, animals (n = 10 per group) were given four trials per day (maximum of 5 min on the rota rod, 1-h ITI, for 4 days).
For all experiments, the latency and rotational velocity at which the animal fell from the rota rod were recorded.
Footprint test
The footprint test was used to compare the gait of Tc1 mice with that of WT control mice. Before the test, mice (n = 13–14 per group) received one training run during which they learnt to walk along a white illuminated runway (65-cm long, 8-cm wide), into a narrow plastic corridor (15-cm high) ended in a dark, enclosed ‘safe-house’ (12×9×9 cm3). Immediately after the training session, footprints were recorded on a white paper after applying non-toxic coloured ink to each paw (Daler Rowney, Bracknell, UK). Mice had their front paws painted in red and hind paws in black. Mice were then allowed to walk down the runway, and one set of footprints was collected for each animal. The footprint patterns were analysed using five step parameters (in cm): (1) Stride length was measured as the distance between two successive footprints of the same limb (front and hind legs). (2) The front- or hind-base width was measured as the average distance between the footprints of the same pair of limbs (front or hind pair respectively). These values were determined by measuring the perpendicular distance of a given step to a line connecting its opposite preceding and proceeding steps. (3) The distance from front footprint to ipsilateral hind footprint was also used to measure uniformity of step alternation. Several values were measured from each run and the mean value of each set of values was used in subsequent analysis.
Muscle strength
Grip-strength measurement
The grip-strength test measures the muscle strength of the forelimbs as well as the combined fore- and hind-limb grip strength in rodents. Grip strength was assessed using a commercially available Grip Strength Meter (Bioseb, France). The apparatus is supplied with a wire grid connected to a sensor. For forelimb grip testing, animals (n = 14 per group) were held by the base of the tail above the grid and gently lowered down until the front paws grasped the grid (hind limbs were kept free from contact with the grid). The animal was brought to an almost horizontal position and pulled back gently but steadily until the grip was released. The maximum force (g) achieved by the animal before releasing its grasp from grid was recorded. Measurement of grip strength using all four paws was carried out as above except that all limbs made contact with and grasped the grid initially. Each animal was subjected to three trials testing front paws only and three trials on all four paws (5 min minimum between each trial).
Paw preference test
Animals were tested for behavioural lateralization using Collins' protocol and apparatus (93–95). Mice (n = 31–48 per group) were deprived of food for 20 ± 4 h and then placed individually in a transparent plastic testing chamber (10.5×6×6 cm3). Small pieces of regular food were introduced in the cylindrical tube (0.9 cm in diameter) perpendicular to the front of the box and equally accessible using the right or left paw. Mice were observed individually for a total of 50 consecutive reaches for food. Animals that did not start the test within a maximum of 60 min or that failed to complete the 50 reaches within an additional 60-min period were given a second trial 1 week later. A maximum of four trials were given per mouse. Subjects were assigned a score representing the direction of lateralization and expressed as the number of RPEs, with right-handed mice having a RPE score higher than 25, and left-handed mice, a RPE score lower than 25 (93). Scores for the degree of handedness were given by the absolute value of the difference between the number of entries with right and left paws noted |R−L|. Since 50 reaches for food were observed per mouse, the |R−L| variable is limited to even values between 0 and 50. The higher the value of |R−L| is, the more the subject is lateralized, either on the right or on the left.
Electrophysiology
Slice preparation
Animals were stunned by decapitation and parasagittal slices (250-mm thick) were prepared from the cerebellar vermis as previously described (30). Electrophysiological experiments were performed with slices prepared from 11 WT and 10 Tc1 mice of 4–6 months of age. Cerebellar slices were prepared in the presence of a cold (t = 3°C) sucrose-based solution containing (in mM): sucrose 230, KCl 2.5, KH2PO4 1.25, MgCl2 8, glucose 25, NaHCO3 26, CaCl2 0.8; they were then incubated at room temperature in a normal bicarbonate-buffered saline (BBS) gassed with 95%O2/5%CO2 for at least 30 min before recording. During experiments, the recording chamber was continuously perfused at a rate of 2 ml/min with BBS of the following composition (in mM): KCl 3, NaCl 124, KH2PO4 1.15, MgSO4 1.15, glucose 10, NaHCO3 24, CaCl2 2 and the γ-aminobutyric acid A-type (GABA-A) receptor antagonist bicuculline methochloride (10 µM, Sigma) or bicuculline methiodide (10 µM, Sigma); final pH 7.35 at 28°C, 330 mOsm/l.
Electrophysiological recordings
PCs were visually identified with an upright microscope (Axioskope, Zeiss) equipped with differential interference contrast optics and with ×60 water-immersion objective. Patch-clamp whole-cell recordings in voltage clamp mode were performed with an Axoclamp 1D or an Axopatch 200 amplifier (Axon instruments). Pipettes were pulled from borosilicate glass capillaries and had a resistance of 3–3.5 MW when filled with the intracellular solution. Cells were maintained at a holding potential of −60 mV and all evoked currents were recorded during a negative (−10 mV) voltage step that allowed monitoring of the passive electrical properties of the recorded cells as well as the stability of the series resistances. This parameter was usually <15 MΩ and it was partially compensated (50–70%) according to the procedure described by Llano et al. (96). Data were collected by Elphy or Acquis1 software (G. Sadoc, France). For analysis, electrophysiological data were filtered at 5 kHz and sampled at 12.5 kHz for evoked EPSCs and at 20 kHz for passive membrane current. CF- and PF-mediated responses were analysed off-line by using Clampfit (Axon Instruments) or by Acquis1 custom-written routines.
Pairing experiments
In LTD experiments, the patch pipettes were filled with an internal solution containing in mM: Cs-gluconate 140, HEPES 10, EGTA 1, MgCl2 4.6, CaCl2 0.1, Na2-ATP 4, Na2-GTP 0.4, tetraethylammonium (TEA) 20 (final pH 7.3 with CsOH and osmolarity 300 mOsm/l). PFs were stimulated at 0.33 Hz through a saline-filled monopolar electrode placed at the surface of the slice, in the lower half of the molecular layer at the level of the proximal dendrites of the recorded cells. Two pulses were delivered separated by 36 ms. In these experiments, PF-mediated EPSCs were first evoked in the patched PC for a control period of 5 min to obtain baseline data. Then, two successive pairing protocols separated by 5 min were performed in an attempt to saturate LTD. The duration of each pairing protocol was 2 min, and consisted of 60 repetitive PC depolarisations (0.5 Hz, from −60 to 0 mV for 50 ms) and simultaneous PF electrical stimulation (two pulses separated by 10 ms and applied 20 ms after the beginning of the PC depolarization). After the pairing protocol, the PF stimulations were resumed at 0.33 Hz until the end of the experiment.
CF innervation experiments
Patch pipettes (2–4 MW) were filled with a solution containing (in mM): Cs-gluconate 140, HEPES 10, BAPTA 20, MgCl2 4.6, CaCl2 2, Na2-ATP 4, Na2-GTP 0.4, tetraethylammonium (TEA) 20 (final pH 7.3 with CsOH and osmolarity 300 mOsm/l). Each PC was first recorded at −70 mV and then at −20 mV to inactivate voltage-dependent channels and to reduce CF-EPSC amplitude and consequent space clamp problems. CFs were stimulated at 0.33 Hz through a monopolar electrode placed in the granular layer, near the soma of the recorded cell. Two pulses were delivered separated by 60 ms. For each cell, several locations of the stimulating electrode in this layer and in the lower half of the molecular layer were systematically tested for their ability to evoke potential multi-step CF-mediated EPSCs.
Paired-pulse experiments
For PPF and PPD experiments, test stimulation was done at 0.33 Hz (97). For PPF or PPD experiments, PF or CF stimuli were applied to the cell with an inter-stimulus interval of 30 or 60 ms, respectively. The PPR was calculated for groups of 50 consecutive sweeps as the ratio of the mean amplitude of the second EPSC to the mean of the first EPSC (98). Data from different experiments were averaged to obtain the PPR mean value.
Neuroanatomical assessment
Slices were routinely fixed with 4% paraformaldehyde in experiments in which biocytin (2 mg/ml, Sigma) was injected during electrophysiological experiments. Biocytin was detected using the horse radish peroxidase method. After washing the fixed slices in PBS, they were incubated in peroxidase quenching solution (1.5 ml of 30% hydrogen peroxide in 100 ml of methanol) for 30 min at room temperature. The slices were washed in distilled water and then incubated in 2% triton-PBS for 1 h at room temperature. Following two brief washes in PBS, the slices were incubated in ABC (Vector Laboratories, UK) in PBS 0.1% tween for 2 h. The reaction product was visualized using diaminobenzidine (Sigma, UK). The slices were mounted on a slide and the biocytin-labelled cells were visualized with a light microscope (Axioplan2 imaging, Zeiss) equipped with a camera. Purkinje neuron images were acquired at different z-planes. The morphology reconstruction was performed using ImageJ (NIH, USA) that allowed estimation of the area and perimeter of the region occupied by PC dendrites in the molecular layer as well as the PC soma diameter.
Statistical analysis
Repeated-measures analysis of variance was performed to assess the interaction between genotypes (between-factor) and time (within-factor). For comparisons between two groups, Student's t-test was used. As the number of grooming episodes and the scores of lateralization (RPE and |R−L|) did not follow a normal distribution, statistical analyses were carried out using the nonparametric Mann–Whitney rank sum test (StatView Software, Abacus). The χ2-test was used to assess if the genotype had an effect on the percentage of single-CF innervation. Statistical significance was set at a P-value ≤0.05. Data are given as mean ± S.E.M.
FUNDING
This work was supported by the Wellcome Trust and the Medical Research Council. E.M. was supported by a fellowship from the Fondation Fyssen. Funding to Pay the Open Access charge was provided by the Wellcome Trust (grant number 080174/B/06/Z).
ACKNOWLEDGEMENTS
We are grateful to M. Nosten-Bertrand and M. Herbin for helpful comments on the manuscript, and to F. Crépel and D. Ogden for helpful discussion. We thank C. Brazil and L. Fern for animal care.
Conflict of Interest statement. None of the authors have financial interests that might present a conflict of interest.
REFERENCES
- 1.Lejeune J., Gautier M., Turpin R. Study of somatic chromosomes from 9 mongoloid children. C. R. Hebd. Seances Acad. Sci. 1959;248:1721–1722. [PubMed] [Google Scholar]
- 2.Battaglia F., Quartarone A., Rizzo V., Ghilardi M.F., Di Rocco A., Tortorella G., Girlanda P. Early impairment of synaptic plasticity in patients with Down's syndrome. Neurobiol. Aging. 2008;29:1272–1275. doi: 10.1016/j.neurobiolaging.2007.02.025. [DOI] [PubMed] [Google Scholar]
- 3.Chapman R.S., Hesketh L.J. Behavioral phenotype of individuals with Down syndrome. Ment. Retard. Dev. Disabil. Res. Rev. 2000;6:84–95. doi: 10.1002/1098-2779(2000)6:2<84::AID-MRDD2>3.0.CO;2-P. [DOI] [PubMed] [Google Scholar]
- 4.Chapman R.S., Hesketh L.J. Language, cognition, and short-term memory in individuals with Down syndrome. Downs Syndr. Res. Pract. 2001;7:1–7. doi: 10.3104/reviews.108. [DOI] [PubMed] [Google Scholar]
- 5.Roizen N.J., Patterson D. Down's syndrome. Lancet. 2003;361:1281–1289. doi: 10.1016/S0140-6736(03)12987-X. [DOI] [PubMed] [Google Scholar]
- 6.Silverman W. Down syndrome: cognitive phenotype. Ment. Retard. Dev. Disabil. Res. Rev. 2007;13:228–236. doi: 10.1002/mrdd.20156. [DOI] [PubMed] [Google Scholar]
- 7.Vicari S. Motor development and neuropsychological patterns in persons with Down syndrome. Behav. Genet. 2006;36:355–364. doi: 10.1007/s10519-006-9057-8. [DOI] [PubMed] [Google Scholar]
- 8.Galli M., Rigoldi C., Brunner R., Virji-Babul N., Giorgio A. Joint stiffness and gait pattern evaluation in children with Down syndrome. Gait Posture. 2008;28:502–506. doi: 10.1016/j.gaitpost.2008.03.001. [DOI] [PubMed] [Google Scholar]
- 9.Smith B.A., Ulrich B.D. Early onset of stabilizing strategies for gait and obstacles: older adults with Down syndrome. Gait Posture. 2008;28:448–455. doi: 10.1016/j.gaitpost.2008.02.002. [DOI] [PMC free article] [PubMed] [Google Scholar]
- 10.Fidler D.J., Hepburn S., Rogers S. Early learning and adaptive behaviour in toddlers with Down syndrome: evidence for an emerging behavioural phenotype? Downs Syndr. Res. Pract. 2006;9:37–44. doi: 10.3104/reports.297. [DOI] [PubMed] [Google Scholar]
- 11.Spano M., Mercuri E., Rando T., Panto T., Gagliano A., Henderson S., Guzzetta F. Motor and perceptual-motor competence in children with Down syndrome: variation in performance with age. Eur. J. Paediatr. Neurol. 1999;3:7–13. doi: 10.1053/ejpn.1999.0173. [DOI] [PubMed] [Google Scholar]
- 12.Mon-Williams M., Tresilian J.R., Bell V.E., Coppard V.L., Jobling A., Carson R.G. The preparation of reach to grasp movements in adults with Down syndrome. Hum. Mov. Sci. 2001;20:587–602. doi: 10.1016/s0167-9457(01)00069-0. [DOI] [PubMed] [Google Scholar]
- 13.Carlier M., Stefanini S., Deruelle C., Volterra V., Doyen A.L., Lamard C., de Portzamparc V., Vicari S., Fisch G. Laterality in persons with intellectual disability. I. Do patients with trisomy 21 and Williams–Beuren syndrome differ from typically developing persons? Behav. Genet. 2006;36:365–376. doi: 10.1007/s10519-006-9048-9. [DOI] [PubMed] [Google Scholar]
- 14.Gerard-Desplanches A., Deruelle C., Stefanini S., Ayoun C., Volterra V., Vicari S., Fisch G., Carlier M. Laterality in persons with intellectual disability. II. Hand, foot, ear, and eye laterality in persons with Trisomy 21 and Williams–Beuren syndrome. Dev. Psychobiol. 2006;48:482–491. doi: 10.1002/dev.20163. [DOI] [PubMed] [Google Scholar]
- 15.Groen M.A., Yasin I., Laws G., Barry J.G., Bishop D.V. Weak hand preference in children with Down syndrome is associated with language deficits. Dev. Psychobiol. 2008;50:242–250. doi: 10.1002/dev.20291. [DOI] [PubMed] [Google Scholar]
- 16.Bishop D.V.M. Handedness and Developmental Disorder. Hove: Lawrence Erlbaum; 1990. [Google Scholar]
- 17.Aylward E.H., Habbak R., Warren A.C., Pulsifer M.B., Barta P.E., Jerram M., Pearlson G.D. Cerebellar volume in adults with Down syndrome. Arch. Neurol. 1997;54:209–212. doi: 10.1001/archneur.1997.00550140077016. [DOI] [PubMed] [Google Scholar]
- 18.Pinter J.D., Eliez S., Schmitt J.E., Capone G.T., Reiss A.L. Neuroanatomy of Down's syndrome: a high-resolution MRI study. Am. J. Psychiatry. 2001;158:1659–1665. doi: 10.1176/appi.ajp.158.10.1659. [DOI] [PubMed] [Google Scholar]
- 19.Raz N., Torres I.J., Briggs S.D., Spencer W.D., Thornton A.E., Loken W.J., Gunning F.M., McQuain J.D., Driesen N.R., Acker J.D. Selective neuroanatomic abnormalities in Down's syndrome and their cognitive correlates: evidence from MRI morphometry. Neurology. 1995;45:356–366. doi: 10.1212/wnl.45.2.356. [DOI] [PubMed] [Google Scholar]
- 20.Weis S., Weber G., Neuhold A., Rett A. Down syndrome: MR quantification of brain structures and comparison with normal control subjects. Am. J. Neuroradiol. 1991;12:1207–1211. [PMC free article] [PubMed] [Google Scholar]
- 21.Baxter L.L., Moran T.H., Richtsmeier J.T., Troncoso J., Reeves R.H. Discovery and genetic localization of Down syndrome cerebellar phenotypes using the Ts65Dn mouse. Hum. Mol. Genet. 2000;9:195–202. doi: 10.1093/hmg/9.2.195. [DOI] [PubMed] [Google Scholar]
- 22.Moldrich R.X., Dauphinot L., Laffaire J., Rossier J., Potier M.C. Down syndrome gene dosage imbalance on cerebellum development. Prog. Neurobiol. 2007;82:87–94. doi: 10.1016/j.pneurobio.2007.02.006. [DOI] [PubMed] [Google Scholar]
- 23.O'Doherty A., Ruf S., Mulligan C., Hildreth V., Errington M.L., Cooke S., Sesay A., Modino S., Vanes L., Hernandez D., et al. An aneuploid mouse strain carrying human chromosome 21 with Down syndrome phenotypes. Science. 2005;309:2033–2037. doi: 10.1126/science.1114535. [DOI] [PMC free article] [PubMed] [Google Scholar]
- 24.Olson L.E., Roper R.J., Baxter L.L., Carlson E.J., Epstein C.J., Reeves R.H. Down syndrome mouse models Ts65Dn, Ts1Cje, and Ms1Cje/Ts65Dn exhibit variable severity of cerebellar phenotypes. Dev. Dyn. 2004;230:581–589. doi: 10.1002/dvdy.20079. [DOI] [PubMed] [Google Scholar]
- 25.Moore C.S., Roper R.J. The power of comparative and developmental studies for mouse models of Down syndrome. Mamm. Genome. 2007;18:431–443. doi: 10.1007/s00335-007-9030-8. [DOI] [PMC free article] [PubMed] [Google Scholar]
- 26.Reeves R.H. Down syndrome mouse models are looking up. Trends Mol. Med. 2006;12:237–240. doi: 10.1016/j.molmed.2006.04.005. [DOI] [PubMed] [Google Scholar]
- 27.Morice E., Andreae L.C., Cooke S.F., Vanes L., Fisher E.M., Tybulewicz V.L., Bliss T.V.P. Preservation of long-term memory and synaptic plasticity despite short-term impairments in the Tc1 mouse model of Down syndrome. Learn. Mem. 2008;15:492–500. doi: 10.1101/lm.969608. [DOI] [PMC free article] [PubMed] [Google Scholar]
- 28.Ito M., Sakurai M., Tongroach P. Climbing fibre induced depression of both mossy fibre responsiveness and glutamate sensitivity of cerebellar Purkinje cells. J. Physiol. 1982;324:113–134. doi: 10.1113/jphysiol.1982.sp014103. [DOI] [PMC free article] [PubMed] [Google Scholar]
- 29.Aiba A., Kano M., Chen C., Stanton M.E., Fox G.D., Herrup K., Zwingman T.A., Tonegawa S. Deficient cerebellar long-term depression and impaired motor learning in mGluR1 mutant mice. Cell. 1994;79:377–388. [PubMed] [Google Scholar]
- 30.Conquet F., Bashir Z.I., Davies C.H., Daniel H., Ferraguti F., Bordi F., Franz-Bacon K., Reggiani A., Matarese V., Conde F., et al. Motor deficit and impairment of synaptic plasticity in mice lacking mGluR1. Nature. 1994;372:237–243. doi: 10.1038/372237a0. [DOI] [PubMed] [Google Scholar]
- 31.Hirai H., Pang Z., Bao D., Miyazaki T., Li L., Miura E., Parris J., Rong Y., Watanabe M., Yuzaki M., et al. Cbln1 is essential for synaptic integrity and plasticity in the cerebellum. Nat. Neurosci. 2005;8:1534–1541. doi: 10.1038/nn1576. [DOI] [PubMed] [Google Scholar]
- 32.Uemura T., Kakizawa S., Yamasaki M., Sakimura K., Watanabe M., Iino M., Mishina M. Regulation of long-term depression and climbing fiber territory by glutamate receptor delta2 at parallel fiber synapses through its C-terminal domain in cerebellar Purkinje cells. J. Neurosci. 2007;27:12096–12108. doi: 10.1523/JNEUROSCI.2680-07.2007. [DOI] [PMC free article] [PubMed] [Google Scholar]
- 33.Crepel F., Delhaye-Bouchaud N., Dupont J.L. Fate of the multiple innervation of cerebellar Purkinje cells by climbing fibers in immature control, x-irradiated and hypothyroid rats. Brain Res. 1981;227:59–71. doi: 10.1016/0165-3806(81)90094-8. [DOI] [PubMed] [Google Scholar]
- 34.Mariani J., Changeux J.P. Ontogenesis of olivocerebellar relationships. I. Studies by intracellular recordings of the multiple innervation of Purkinje cells by climbing fibers in the developing rat cerebellum. J. Neurosci. 1981;1:696–702. doi: 10.1523/JNEUROSCI.01-07-00696.1981. [DOI] [PMC free article] [PubMed] [Google Scholar]
- 35.Chen C., Kano M., Abeliovich A., Chen L., Bao S., Kim J.J., Hashimoto K., Thompson R.F., Tonegawa S. Impaired motor coordination correlates with persistent multiple climbing fiber innervation in PKC gamma mutant mice. Cell. 1995;83:1233–1242. doi: 10.1016/0092-8674(95)90148-5. [DOI] [PubMed] [Google Scholar]
- 36.Kano M., Hashimoto K., Kurihara H., Watanabe M., Inoue Y., Aiba A., Tonegawa S. Persistent multiple climbing fiber innervation of cerebellar Purkinje cells in mice lacking mGluR1. Neuron. 1997;18:71–79. doi: 10.1016/s0896-6273(01)80047-7. [DOI] [PubMed] [Google Scholar]
- 37.Benoit P., Delhaye-Bouchaud N., Changeux J.P., Mariani J. Stability of multiple innervation of Purkinje cells by climbing fibers in the agranular cerebellum of old rats X-irradiated at birth. Brain Res. 1984;316:310–313. doi: 10.1016/0165-3806(84)90320-1. [DOI] [PubMed] [Google Scholar]
- 38.Crepel F., Delhaye-Bouchaud N., Guastavino J.M., Sampaio I. Multiple innervation of cerebellar Purkinje cells by climbing fibres in staggerer mutant mouse. Nature. 1980;283:483–484. doi: 10.1038/283483a0. [DOI] [PubMed] [Google Scholar]
- 39.Steinmayr M., Andre E., Conquet F., Rondi-Reig L., Delhaye-Bouchaud N., Auclair N., Daniel H., Crepel F., Mariani J., Sotelo C., et al. Staggerer phenotype in retinoid-related orphan receptor alpha-deficient mice. Proc. Natl Acad. Sci. USA. 1998;95:3960–3965. doi: 10.1073/pnas.95.7.3960. [DOI] [PMC free article] [PubMed] [Google Scholar]
- 40.Haw C.M., Barnes T.R., Clark K., Crichton P., Kohen D. Movement disorder in Down's syndrome: a possible marker of the severity of mental handicap. Mov. Disord. 1996;11:395–403. doi: 10.1002/mds.870110408. [DOI] [PubMed] [Google Scholar]
- 41.McFadyen M.P., Kusek G., Bolivar V.J., Flaherty L. Differences among eight inbred strains of mice in motor ability and motor learning on a rotorod. Genes Brain Behav. 2003;2:214–219. doi: 10.1034/j.1601-183x.2003.00028.x. [DOI] [PubMed] [Google Scholar]
- 42.Crepel F., Jaillard D. Pairing of pre- and postsynaptic activities in cerebellar Purkinje cells induces long-term changes in synaptic efficacy in vitro. J. Physiol. 1991;432:123–141. doi: 10.1113/jphysiol.1991.sp018380. [DOI] [PMC free article] [PubMed] [Google Scholar]
- 43.Ito M. Long-term depression. Annu. Rev. Neurosci. 1989;12:85–102. doi: 10.1146/annurev.ne.12.030189.000505. [DOI] [PubMed] [Google Scholar]
- 44.Nishiyama H., Linden D.J. Differential maturation of climbing fiber innervation in cerebellar vermis. J. Neurosci. 2004;24:3926–3932. doi: 10.1523/JNEUROSCI.5610-03.2004. [DOI] [PMC free article] [PubMed] [Google Scholar]
- 45.Morice E., Denis C., Giros B., Nosten-Bertrand M. Phenotypic expression of the targeted null-mutation in the dopamine transporter gene varies as a function of the genetic background. Eur. J. Neurosci. 2004;20:120–126. doi: 10.1111/j.1460-9568.2004.03465.x. [DOI] [PubMed] [Google Scholar]
- 46.Maatta T., Tervo-Maatta T., Taanila A., Kaski M., Iivanainen M. Mental health, behaviour and intellectual abilities of people with Down syndrome. Downs Syndr. Res. Pract. 2006;11:37–43. doi: 10.3104/reports.313. [DOI] [PubMed] [Google Scholar]
- 47.Reeves R.H., Irving N.G., Moran T.H., Wohn A., Kitt C., Sisodia S.S., Schmidt C., Bronson R.T., Davisson M.T. A mouse model for Down syndrome exhibits learning and behaviour deficits. Nat. Genet. 1995;11:177–184. doi: 10.1038/ng1095-177. [DOI] [PubMed] [Google Scholar]
- 48.Sago H., Carlson E.J., Smith D.J., Kilbridge J., Rubin E.M., Mobley W.C., Epstein C.J., Huang T.T. Ts1Cje, a partial trisomy 16 mouse model for Down syndrome, exhibits learning and behavioral abnormalities. Proc. Natl Acad. Sci. USA. 1998;95:6256–6261. doi: 10.1073/pnas.95.11.6256. [DOI] [PMC free article] [PubMed] [Google Scholar]
- 49.Sago H., Carlson E.J., Smith D.J., Rubin E.M., Crnic L.S., Huang T.T., Epstein C.J. Genetic dissection of region associated with behavioral abnormalities in mouse models for Down syndrome. Pediatr. Res. 2000;48:606–613. doi: 10.1203/00006450-200011000-00009. [DOI] [PubMed] [Google Scholar]
- 50.Coussons-Read M.E., Crnic L.S. Behavioral assessment of the Ts65Dn mouse, a model for Down syndrome: altered behavior in the elevated plus maze and open field. Behav. Genet. 1996;26:7–13. doi: 10.1007/BF02361154. [DOI] [PubMed] [Google Scholar]
- 51.Escorihuela R.M., Fernandez-Teruel A., Vallina I.F., Baamonde C., Lumbreras M.A., Dierssen M., Tobena A., Florez J. A behavioral assessment of Ts65Dn mice: a putative Down syndrome model. Neurosci. Lett. 1995;199:143–146. doi: 10.1016/0304-3940(95)12052-6. [DOI] [PubMed] [Google Scholar]
- 52.Holtzman D.M., Santucci D., Kilbridge J., Chua-Couzens J., Fontana D.J., Daniels S.E., Johnson R.M., Chen K., Sun Y., Carlson E., et al. Developmental abnormalities and age-related neurodegeneration in a mouse model of Down syndrome. Proc. Natl Acad. Sci. USA. 1996;93:13333–13338. doi: 10.1073/pnas.93.23.13333. [DOI] [PMC free article] [PubMed] [Google Scholar]
- 53.Stewart L.S., Persinger M.A., Cortez M.A., Snead O.C., III Chronobiometry of behavioral activity in the Ts65Dn model of Down syndrome. Behav. Genet. 2007;37:388–398. doi: 10.1007/s10519-006-9119-y. [DOI] [PubMed] [Google Scholar]
- 54.Costa A.C., Walsh K., Davisson M.T. Motor dysfunction in a mouse model for Down syndrome. Physiol. Behav. 1999;68:211–220. doi: 10.1016/s0031-9384(99)00178-x. [DOI] [PubMed] [Google Scholar]
- 55.Hyde L.A., Crnic L.S., Pollock A., Bickford P.C. Motor learning in Ts65Dn mice, a model for Down syndrome. Dev. Psychobiol. 2001;38:33–45. doi: 10.1002/1098-2302(2001)38:1<33::aid-dev3>3.0.co;2-0. [DOI] [PubMed] [Google Scholar]
- 56.Klein S.L., Kriegsfeld L.J., Hairston J.E., Rau V., Nelson R.J., Yarowsky P.J. Characterization of sensorimotor performance, reproductive and aggressive behaviors in segmental trisomic 16 (Ts65Dn) mice. Physiol. Behav. 1996;60:1159–1164. doi: 10.1016/0031-9384(96)00218-1. [DOI] [PubMed] [Google Scholar]
- 57.Turner C.A., Presti M.F., Newman H.A., Bugenhagen P., Crnic L., Lewis M.H. Spontaneous stereotypy in an animal model of Down syndrome: Ts65Dn mice. Behav. Genet. 2001;31:393–400. doi: 10.1023/a:1012226603255. [DOI] [PubMed] [Google Scholar]
- 58.Carter J.C., Capone G.T., Kaufmann W.E. Neuroanatomic correlates of autism and stereotypy in children with Down syndrome. Neuroreport. 2008;19:653–656. doi: 10.1097/WNR.0b013e3282faa8d8. [DOI] [PubMed] [Google Scholar]
- 59.Hansel C., de Jeu M., Belmeguenai A., Houtman S.H., Buitendijk G.H., Andreev D., De Zeeuw C.I., Elgersma Y. alphaCaMKII is essential for cerebellar LTD and motor learning. Neuron. 2006;51:835–843. doi: 10.1016/j.neuron.2006.08.013. [DOI] [PubMed] [Google Scholar]
- 60.Crepel F., Mariani J., Delhaye-Bouchaud N. Evidence for a multiple innervation of Purkinje cells by climbing fibers in the immature rat cerebellum. J. Neurobiol. 1976;7:567–578. doi: 10.1002/neu.480070609. [DOI] [PubMed] [Google Scholar]
- 61.Cho C.H., St-Gelais F., Zhang W., Tomita S., Howe J.R. Two families of TARP isoforms that have distinct effects on the kinetic properties of AMPA receptors and synaptic currents. Neuron. 2007;55:890–904. doi: 10.1016/j.neuron.2007.08.024. [DOI] [PubMed] [Google Scholar]
- 62.Milstein A.D., Zhou W., Karimzadegan S., Bredt D.S., Nicoll R.A. TARP subtypes differentially and dose-dependently control synaptic AMPA receptor gating. Neuron. 2007;55:905–918. doi: 10.1016/j.neuron.2007.08.022. [DOI] [PMC free article] [PubMed] [Google Scholar]
- 63.Lev-Ram V., Wong S.T., Storm D.R., Tsien R.Y. A new form of cerebellar long-term potentiation is postsynaptic and depends on nitric oxide but not cAMP. Proc. Natl Acad. Sci. USA. 2002;99:8389–8393. doi: 10.1073/pnas.122206399. [DOI] [PMC free article] [PubMed] [Google Scholar]
- 64.Linden D.J., Ahn S. Activation of presynaptic cAMP-dependent protein kinase is required for induction of cerebellar long-term potentiation. J. Neurosci. 1999;19:10221–10227. doi: 10.1523/JNEUROSCI.19-23-10221.1999. [DOI] [PMC free article] [PubMed] [Google Scholar]
- 65.Salin P.A., Malenka R.C., Nicoll R.A. Cyclic AMP mediates a presynaptic form of LTP at cerebellar parallel fiber synapses. Neuron. 1996;16:797–803. doi: 10.1016/s0896-6273(00)80099-9. [DOI] [PubMed] [Google Scholar]
- 66.Hansel C., Linden D.J. Long-term depression of the cerebellar climbing fiber–Purkinje neuron synapse. Neuron. 2000;26:473–482. doi: 10.1016/s0896-6273(00)81179-4. [DOI] [PubMed] [Google Scholar]
- 67.Rancillac A., Crepel F. Synapses between parallel fibres and stellate cells express long-term changes in synaptic efficacy in rat cerebellum. J. Physiol. 2004;554:707–720. doi: 10.1113/jphysiol.2003.055871. [DOI] [PMC free article] [PubMed] [Google Scholar]
- 68.Smith S.L., Otis T.S. Pattern-dependent, simultaneous plasticity differentially transforms the input–output relationship of a feedforward circuit. Proc. Natl Acad. Sci. USA. 2005;102:14901–14906. doi: 10.1073/pnas.0505028102. [DOI] [PMC free article] [PubMed] [Google Scholar]
- 69.Boyden E.S., Katoh A., Raymond J.L. Cerebellum-dependent learning: the role of multiple plasticity mechanisms. Annu. Rev. Neurosci. 2004;27:581–609. doi: 10.1146/annurev.neuro.27.070203.144238. [DOI] [PubMed] [Google Scholar]
- 70.De Zeeuw C.I., Yeo C.H. Time and tide in cerebellar memory formation. Curr. Opin. Neurobiol. 2005;15:667–674. doi: 10.1016/j.conb.2005.10.008. [DOI] [PubMed] [Google Scholar]
- 71.Kim J.J., Clark R.E., Thompson R.F. Hippocampectomy impairs the memory of recently, but not remotely, acquired trace eyeblink conditioned responses. Behav. Neurosci. 1995;109:195–203. doi: 10.1037//0735-7044.109.2.195. [DOI] [PubMed] [Google Scholar]
- 72.Morris R.G., Garrud P., Rawlins J.N., O'Keefe J. Place navigation impaired in rats with hippocampal lesions. Nature. 1982;297:681–683. doi: 10.1038/297681a0. [DOI] [PubMed] [Google Scholar]
- 73.O'Keefe J., Nadel L. The Hippocampus as a Cognitive Map. Oxford: Oxford University Press; 1978. [Google Scholar]
- 74.Olton D.S., Papas B.C. Spatial memory and hippocampal function. Neuropsychologia. 1979;17:669–682. doi: 10.1016/0028-3932(79)90042-3. [DOI] [PubMed] [Google Scholar]
- 75.Phillips R.G., LeDoux J.E. Differential contribution of amygdala and hippocampus to cued and contextual fear conditioning. Behav. Neurosci. 1992;106:274–285. doi: 10.1037//0735-7044.106.2.274. [DOI] [PubMed] [Google Scholar]
- 76.Goddyn H., Leo S., Meert T., D'Hooge R. Differences in behavioural test battery performance between mice with hippocampal and cerebellar lesions. Behav. Brain Res. 2006;173:138–147. doi: 10.1016/j.bbr.2006.06.016. [DOI] [PubMed] [Google Scholar]
- 77.Viggiano D. The hyperactive syndrome: metanalysis of genetic alterations, pharmacological treatments and brain lesions which increase locomotor activity. Behav. Brain Res. 2008;194:1–14. doi: 10.1016/j.bbr.2008.06.033. [DOI] [PubMed] [Google Scholar]
- 78.Belichenko P.V., Kleschevnikov A.M., Salehi A., Epstein C.J., Mobley W.C. Synaptic and cognitive abnormalities in mouse models of Down syndrome: exploring genotype–phenotype relationships. J. Comp. Neurol. 2007;504:329–345. doi: 10.1002/cne.21433. [DOI] [PubMed] [Google Scholar]
- 79.Belichenko P.V., Masliah E., Kleschevnikov A.M., Villar A.J., Epstein C.J., Salehi A., Mobley W.C. Synaptic structural abnormalities in the Ts65Dn mouse model of Down syndrome. J. Comp. Neurol. 2004;480:281–298. doi: 10.1002/cne.20337. [DOI] [PubMed] [Google Scholar]
- 80.Costa A.C., Grybko M.J. Deficits in hippocampal CA1 LTP induced by TBS but not HFS in the Ts65Dn mouse: a model of Down syndrome. Neurosci. Lett. 2005;382:317–322. doi: 10.1016/j.neulet.2005.03.031. [DOI] [PubMed] [Google Scholar]
- 81.Insausti A.M., Megias M., Crespo D., Cruz-Orive L.M., Dierssen M., Vallina I.F., Insausti R., Florez J. Hippocampal volume and neuronal number in Ts65Dn mice: a murine model of Down syndrome. Neurosci. Lett. 1998;253:175–178. doi: 10.1016/s0304-3940(98)00641-7. [DOI] [PubMed] [Google Scholar]
- 82.Kleschevnikov A.M., Belichenko P.V., Villar A.J., Epstein C.J., Malenka R.C., Mobley W.C. Hippocampal long-term potentiation suppressed by increased inhibition in the Ts65Dn mouse, a genetic model of Down syndrome. J. Neurosci. 2004;24:8153–8160. doi: 10.1523/JNEUROSCI.1766-04.2004. [DOI] [PMC free article] [PubMed] [Google Scholar]
- 83.Kurt M.A., Kafa M.I., Dierssen M., Davies D.C. Deficits of neuronal density in CA1 and synaptic density in the dentate gyrus, CA3 and CA1, in a mouse model of Down syndrome. Brain Res. 2004;1022:101–109. doi: 10.1016/j.brainres.2004.06.075. [DOI] [PubMed] [Google Scholar]
- 84.Lorenzi H.A., Reeves R.H. Hippocampal hypocellularity in the Ts65Dn mouse originates early in development. Brain Res. 2006;1104:153–159. doi: 10.1016/j.brainres.2006.05.022. [DOI] [PubMed] [Google Scholar]
- 85.Siarey R.J., Stoll J., Rapoport S.I., Galdzicki Z. Altered long-term potentiation in the young and old Ts65Dn mouse, a model for Down syndrome. Neuropharmacology. 1997;36:1549–1554. doi: 10.1016/s0028-3908(97)00157-3. [DOI] [PubMed] [Google Scholar]
- 86.Siarey R.J., Villar A.J., Epstein C.J., Galdzicki Z. Abnormal synaptic plasticity in the Ts1Cje segmental trisomy 16 mouse model of Down syndrome. Neuropharmacology. 2005;49:122–128. doi: 10.1016/j.neuropharm.2005.02.012. [DOI] [PubMed] [Google Scholar]
- 87.Stasko M.R., Costa A.C. Experimental parameters affecting the Morris water maze performance of a mouse model of Down syndrome. Behav. Brain Res. 2004;154:1–17. doi: 10.1016/j.bbr.2004.01.012. [DOI] [PubMed] [Google Scholar]
- 88.Aylward E.H., Li Q., Honeycutt N.A., Warren A.C., Pulsifer M.B., Barta P.E., Chan M.D., Smith P.D., Jerram M., Pearlson G.D. MRI volumes of the hippocampus and amygdala in adults with Down's syndrome with and without dementia. Am. J. Psychiatry. 1999;156:564–568. doi: 10.1176/ajp.156.4.564. [DOI] [PubMed] [Google Scholar]
- 89.Pennington B.F., Moon J., Edgin J., Stedron J., Nadel L. The neuropsychology of Down syndrome: evidence for hippocampal dysfunction. Child Dev. 2003;74:75–93. doi: 10.1111/1467-8624.00522. [DOI] [PubMed] [Google Scholar]
- 90.Pinter J.D., Brown W.E., Eliez S., Schmitt J.E., Capone G.T., Reiss A.L. Amygdala and hippocampal volumes in children with Down syndrome: a high-resolution MRI study. Neurology. 2001;56:972–974. doi: 10.1212/wnl.56.7.972. [DOI] [PubMed] [Google Scholar]
- 91.Epstein C.J. The consequences of chromosome imbalance. Am. J. Med. Genet. Suppl. 1990;7:31–37. doi: 10.1002/ajmg.1320370706. [DOI] [PubMed] [Google Scholar]
- 92.Lamprea M.R., Cardenas F.P., Setem J., Morato S. Thigmotactic responses in an open-field. Br. J. Med. Biol. Res. 2008;41:135–140. doi: 10.1590/s0100-879x2008000200010. [DOI] [PubMed] [Google Scholar]
- 93.Collins R.L. Reimpressed selective breeding for lateralization of handedness in mice. Brain Res. 1991;564:194–202. doi: 10.1016/0006-8993(91)91455-a. [DOI] [PubMed] [Google Scholar]
- 94.Morice E., Denis C., Macario A., Giros B., Nosten-Bertrand M. Constitutive hyperdopaminergia is functionally associated with reduced behavioral lateralization. Neuropsychopharmacology. 2005;30:575–581. doi: 10.1038/sj.npp.1300570. [DOI] [PubMed] [Google Scholar]
- 95.Signore P., Nosten-Bertrand M., Chaoui M., Roubertoux P.L., Marchaland C., Perez-Diaz F. An assessment of handedness in mice. Physiol. Behav. 1991;49:701–704. doi: 10.1016/0031-9384(91)90305-8. [DOI] [PubMed] [Google Scholar]
- 96.Llano I., Dreessen J., Kano M., Konnerth A. Intradendritic release of calcium induced by glutamate in cerebellar Purkinje cells. Neuron. 1991;7:577–583. doi: 10.1016/0896-6273(91)90370-f. [DOI] [PubMed] [Google Scholar]
- 97.Atluri P.P., Regehr W.G. Determinants of the time course of facilitation at the granule cell to Purkinje cell synapse. J. Neurosci. 1996;16:5661–5671. doi: 10.1523/JNEUROSCI.16-18-05661.1996. [DOI] [PMC free article] [PubMed] [Google Scholar]
- 98.Kim J., Alger B.E. Random response fluctuations lead to spurious paired-pulse facilitation. J. Neurosci. 2001;21:9608–9618. doi: 10.1523/JNEUROSCI.21-24-09608.2001. [DOI] [PMC free article] [PubMed] [Google Scholar]