Abstract
Study Design
Cluster analysis of existing database of spinal shape of patients attending a scoliosis clinic.
Objective
To determine whether patients with scoliosis can be classified into distinct groups by 3-D curve shape.
Summary of Background Data
Subjective or semi-quantitative methods can be used to classify curve types in scoliosis with the goal of rationalizing surgical planning. There are very few reports of using objective methods such as cluster analysis to improve this process.
Methods
110 patients whose spine was radiographed by a stereo technique at a scoliosis clinic in the period 1982–1990 were studied. Fifty-six were studied longitudinally (average 3.4 clinic visits each), providing 245 total observations. Selected patients had two scoliosis curves with apex between T4 and L3, and both Cobb angles >9 degrees by an automated measurement. The 3-D spinal shape was reconstructed from stereo radiographs. Each curve was quantified by its Cobb angle, apex level, apex vertebra rotation and rotation of the plane of maximum curvature (8 variables). Cluster analysis classified each patient at each visit by these variables.
Results
When the analysis searched for four clusters, the largest cluster (148 of 245 observations) was the pattern having counter-clockwise rotation of the planes of maximum curvature of both curves (typically a right upper scoliosis curve with kyphosis, and left lower scoliosis curve with lordosis). The other 3 clusters (48, 34, 15 observations) were the other permutations of these variables. Substantial overlap of all the other variables between groups was observed. Of the 56 patients seen longitudinally 25 were consistently grouped at all clinic visits.
Conclusion
Spinal shape of patients in a clinic population with two scoliosis curves forms distinct groups according to the 4 permutations of the signs of the rotations of the planes of maximum curvature in two curve regions. The pattern can change with repeated observation, often because a slight curvature in the sagittal plane can change because of postural variation and measurement errors. Overlap of the other curve-shape variables between groups suggests that these spinal deformity classifications alone should not determine treatment strategy.
Keywords: Scoliosis, Classification, Spinal shape, Cluster analysis, Plane of maximum curvature
Key Points
A Cluster analysis of the three-dimensional shape of spines of clinic patients with scoliosis revealed four distinct groupings with differing permutations of positive and negative rotations of the plane of maximum curvature (PMC) of the two curve regions.
The PMC rotation depends on the signs of the sagittal and coronal plane curvatures (kyphosis/lordosis, and right/left scoliosis).
For 56 patients observed longitudinally the classification groupings were only consistent in 25 patients. A slight curvature in the sagittal plane is liable to postural variations and effects of measurement errors that can change the assigned group.
Other major spinal shape parameters (curve apex levels, Cobb angle, apical vertebral rotation) had substantial overlap the four groups identified, indicating that groupings based on PMC rotation alone should not be used in planning management of these patients.
The study draws attention to the plane of maximum curvature of scoliosis curves.
INTRODUCTION
Classification of patients according to their clinical presentation is used to assist in planning their management. Grouping of patients according to a classification scheme provides guidelines as to the appropriateness of different treatment interventions. The information that is used in the classification process may be categorical or binary (e.g. gender), ordinal (e.g. anatomical level of a scoliosis curve apex), or continuous (e.g. Cobb angle). To be effective, a classification should be exhaustive (no patient excluded), mutually exclusive (each patient assigned to one group only), patients should be assigned to their group consistently, and the classification should be useful in guiding management. Also, classification should be easily applicable (i.e. ‘user-friendly’).
Classification of patients with thoraco-lumbar scoliosis was proposed by King et al. [1] to assist in decisions concerning the length of surgical arthrodesis, and providing criteria for ‘selective fusion’ of the thoracic curve. This classification was extended by Lenke et al. [2]. The King et al. classification employed measurements of relative magnitudes of Cobb angles, proportion of curve correction on lateral bending, presence of vertebral tilt (binary), and position of the neutral vertebra relative to the center-sacral line (ordinal). This classification has relatively poor reliability, associated with difficulty in distinguishing between patients whose curve shape lies very close to one of the classification boundaries [3]. Accurate classification requires that there is a distinct boundary between the groups - i.e. few patients lie at or close to the classification boundaries.
Cluster analysis is an objective method to identify groupings of individuals according to a set of measurements or observations. With this statistical tool, it is possible to analyze a dataset that combines several grouping variables, and to search for clusters of patients having similar characteristics. Further, it is possible to determine whether the groupings are statistically significant. Duong et al. [4] presented the use of cluster analysis to identify groupings of patients with scoliosis according to measurements of spinal shape made by stereo radiography. They studied 409 sets of spinal shape data of patients with AIS aged between 10 and 18 years, with a Cobb angle (main curve) > 40 degrees. The parameters of curve spinal shape were three curvatures (frontal, sagittal planes, and plane of maximum curvature) for each of two curve regions. It was found that five groupings could be reliably identified, and these resembled the five major curve types in the Lenke et al. [2] classification. However, these analyses did not include curve-shape measurements in the transverse plane, and only considered large magnitude deformities.
The purpose of this study was to employ cluster analysis of spinal shape measurements of a diverse group of patients with idiopathic scoliosis to determine whether distinct groupings existed. The curve shape included measurements from the frontal, sagittal and transverse planes. A secondary objective was to determine whether patients seen more than once retained the same group assignment (longitudinal study). The patients’ spinal shape had been recorded by stereo-radiography during a visit to a scoliosis clinic.
METHODS
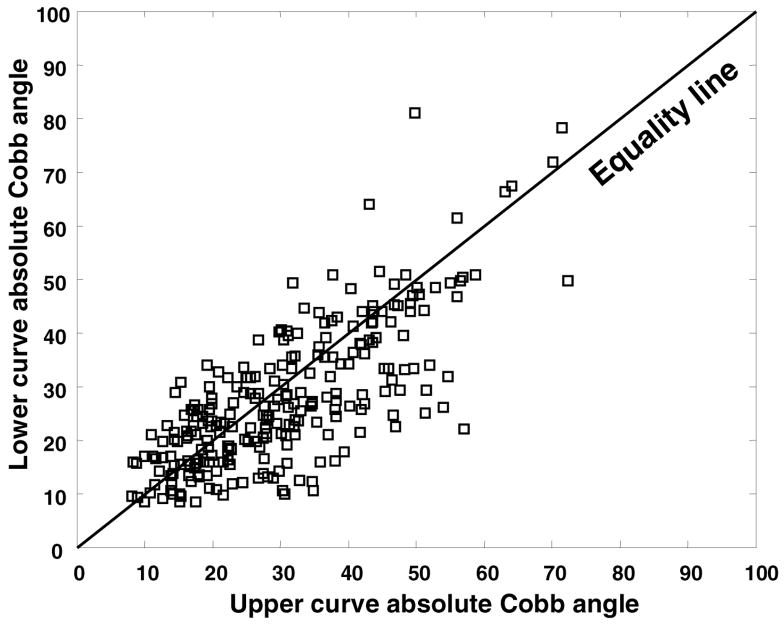
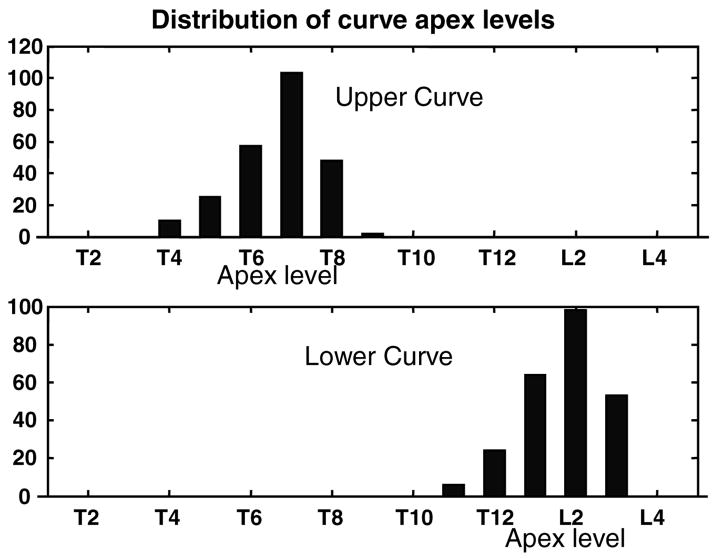
The dataset consisted of stereoradiographic reconstructions of the spines of 110 patients with adolescent idiopathic scoliosis whose radiographs indicated that they had two scoliosis curves with apex between T4 and L3, and both Cobb angles larger than 9 degrees by automatic measurement [5]. The range of Cobb angles was 9 to 81 in the upper curves and 9 to 72 in the lower curves (Figures 1 and 2). Fifty-six patients had repeat measurements from multiple clinic visits. Each of these patients had an average of 3.4 observations, for a total of 245 observations. Patients were standing at the time of radiography, with their clavicle and anterior superior iliac spine regions in contact with four adjustable pads that helped maintain a constant position and posture while the stereo pair of radiographs was made.
Figure 1.
Scatter plot of the lower versus the upper Cobb angles (absolute values). In the King et al. classification, the relative magnitudes of the Cobb angles can be used to distinguish between Type 1 and Type 2 (King 1 requires lower curve Cobb angle > thoracic - i.e. above the equality line in the scatterplot.)
Figure 2.
Histogram of the distribution of levels of scoliosis curve apices.
Four shape parameters of each of the two curves were measured (Figure 3). The shape parameters were calculated from the three-dimensional coordinates of six landmarks on each vertebra from T1 to L5 (total 102 landmarks) as defined by Stokes et al. [5]. These coordinates were determined by stereo-radiographic reconstructions of digitized landmarks in the stereo-radiographic film pairs. Marking and digitizing the films took about 25 minutes per film pair. The spinal shape measurements used in the cluster analysis were the automatically determined Cobb angle [5], the anatomical level of the apical vertebra, the axial rotation of the apical vertebra [6], and the axial rotation of the plane of maximum curvature (PMC) [5,7], relative to the sagittal plane of a spinal axis system [8]. The plane of maximum curvature was defined as the plane passing through the vertebral body centers of the two end vertebrae and the apical vertebrae of the curve [7, 8]. These four parameters were recorded for each of the two curves, hence there was a total of 8 measurements per patient visit.
Figure 3.
Spinal shape measurements of each patient that were used in the cluster analysis. The Figure shows the classic pattern having right thoracic scoliosis in a kyphotic region, and left lower scoliosis curve in a lordotic region. This produces a Plane of Maximum Curvature (PMC) in the curve region that is rotated from the sagittal plane in a direction counter-clockwise as viewed from above. This was considered as a positive rotation in the present study. The normally observed rotation of the apical vertebra is clockwise (negative) in the upper curve region (counter to the PMC rotation) and counter-clockwise (positive) in the lower curve region. (Adapted from Stokes et al. [5])
Each of the variables had either positive or negative sign. By convention here, positive indicated the Cobb angle of a scoliosis curve that was to the right, and positive indicated rotation of the apical vertebra or plane of maximum curvature that was counterclockwise as seen from above. The rotation of the PMC was calculated in the range −90 degrees to +90 degrees, with zero degrees indicating that the PMC lay in the sagittal plane (no scoliosis, only lordosis or kyphosis present). Positive rotation of both planes of maximum curvature occurs with the typical pattern having right thoracic scoliosis in a kyphotic region and left lumbar or thoraco-lumbar scoliosis in a lordotic region (Figure 3). Other complementary permutations can produce rotation of the PMC in the opposite sense.
The cluster analysis was performed in the SPSS version 12.0.1 for Windows (SPSS inc., Chicago, IL), using the K-Means cluster analysis routine. In the K-Means method performs unsupervised clustering in which there are no prior assumptions about grouping tendencies, except that the number of clusters (groups) must be predefined. The analyses were performed for each of the values 3,4, and 5 for the number of clusters sought, and the resulting groupings were then examined to determine whether they were distinct (statistically significant differences between groups), and which variables used in the cluster analysis were the important ones in establishing the group-wise differences.
RESULTS
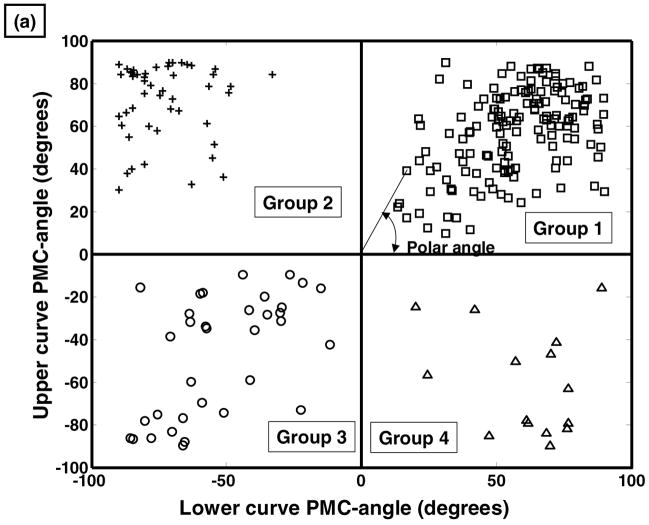
The cluster analysis identified distinct groupings within the entire dataset when it searched for 4 groups. The rotations of the planes of maximum curvature of the two curve regions were the variables that distinguished between groups (Figure 4). The mean values of each parameter for each of the four groups (Table 1) followed a different pattern whereby each group included one of of the four permutations of positive or negative mean values of the rotations of the PMC. Further, the group assignments were consistent according to the sign of the PMC rotations (Figure 4). The group assignment could be uniquely determined by the signs of the PMC rotations -each group corresponded to one of the four quadrants in the scatterplot of the rotations of the upper and lower curve plane of maximum curvature (PMC). There were group-wise differences in the other parameters (apex levels, Cobb angles and apical vertebral axial rotation) between groups by Analysis of Variance, but with substantial overlap of values. These other variables were not required in the cluster analysis to identify the distinct groups. When the curve shapes were examined in the frontal, sagittal and axial planes (Figures 5–8) there was substantial variability in the shapes - the Figures are for illustrative cases that demonstrate curve features producing the four characteristic combinations of PMC rotation.
Figure 4.
(a) Scatter plot of the angle of plane of maximum curvature of the upper curve, versus the angle of plane of maximum curvature lower curve. The cluster analysis identified distinct groups in each of the four quadrants of this graph. The location of any observation on this graph can be identified by the ‘polar angle’. (b) histogram of the polar angles, demonstrating distinct differences between the four groups.
Table 1.
Characteristics of the four groups identified by cluster analysis (mean values and standard deviations of the 8 parameters). Note that the Cobb angles are for signed values (left curve has a negative Cobb angle).
| Group 1 | Group 2 | Group 3 | Group 4 | |
|---|---|---|---|---|
| Mean (S.D.) | Mean (S.D.) | Mean (S.D.) | Mean (S.D.) | |
| Apex level (upper curve) | 6.9 (0.9) | 6.5 (1.0) | 6.4 (1.0) | 5.73 (1.5) |
| Apex level (lower curve) | 13.9 (0.9) | 13.4 (1.0) | 13.6 (1.0) | 13.0 (1.5) |
| Cobb angle (upper curve) | 26.9 (14.0) | 33.5 (16.1) | 2.4 (24.2) | 4.55 (24.5) |
| Cobb angle (lower curve) | −30.6 (15.9) | −33.3 (14.6) | 1.7 (27.0) | −7.75 (26.7) |
| Apex vertebra rotation (upper curve) | 5.0 (7.0) | 6.7 (6.8) | 2.9 (7.7) | 4.30 (7.4) |
| Apex vertebra rotation (lower curve) | −3.6 (6.2) | −7.9 (8.6) | 3.1 (6.9) | 2.84 (8.4) |
| Rotation of PMC (upper curve) (degrees) | 57.0 (19.6) | 71.7 (17.6) | −46.7 (27.9) | −60.3 (24.8) |
| Rotation of PMC (lower curve) (degrees) | 57.1 (18.9) | −73.0 (13.8) | −52.5 (21.2) | 60.9 (19.7) |
| Number of observations in group | 148 | 48 | 34 | 15 |
Figure 5.
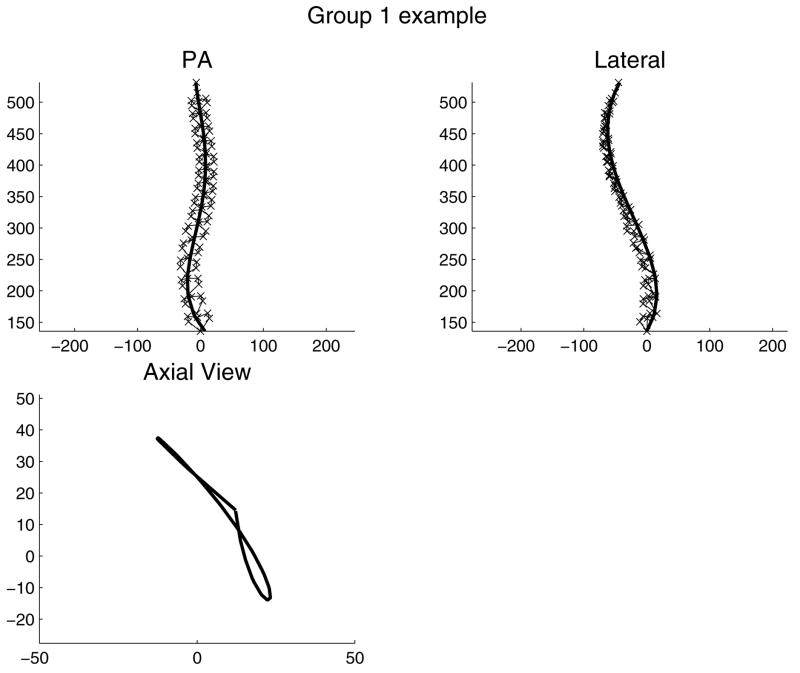
Illustrative example of a patient’s spinal shape in Group 1. ‘x’ = each of six landmarks (vertebral endplate centers and bases of pedicles) on each of 17 vertebrae (omitted from axial view for clarity). Solid line: a smoothed line fitted to the positions of landmarks at vertebral endplate centers. This spinal shape was classified as Group 1 because the combination of right upper scoliosis curve with kyphosis, and left lower curve with lordosis provided the positive rotations of both planes of maximum curvature in the two respective scoliosis curve regions.
Figure 8.
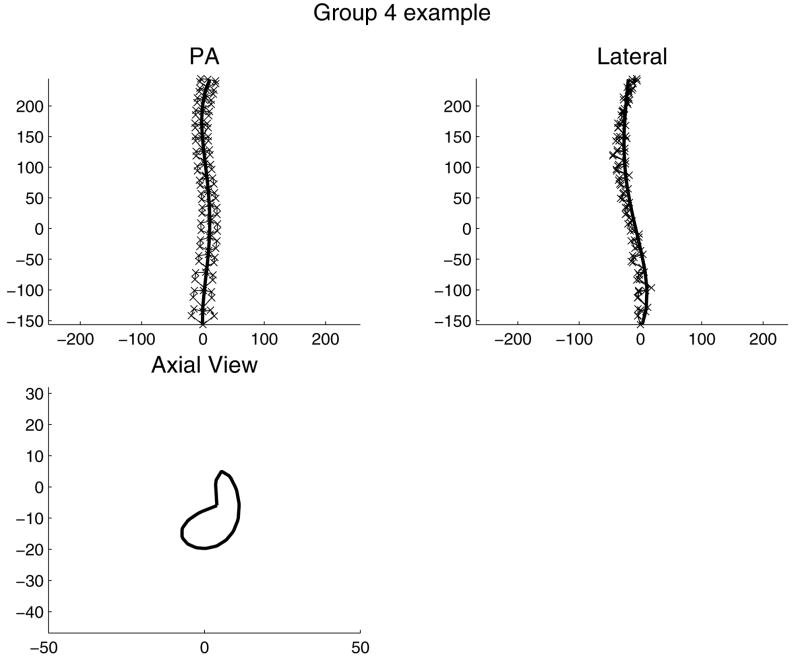
Illustrative example of a patient’s spinal shape in Group 4. ‘x’ = each of six landmarks (vertebral endplate centers and bases of pedicles) on each of 17 vertebrae (omitted from axial view for clarity). Solid line: a smoothed line fitted to the positions of landmarks at vertebral endplate centers. This spinal shape was classified as Group 4 because the combination of left upper scoliosis curve with kyphosis, and right lower curve with kyphosis provided the negative and positive rotations of the two planes of maximum curvature in the two respective scoliosis curve regions.
There were different numbers of patients in each group. Group 1 was the largest group (148 observations), and 144 had the ‘typical’ right upper curve and left lower curve pattern, in regions having kyphosis and lordosis respectively (Figure 5) such that both curve regions had a plane of maximum curvature rotated counter- clockwise viewed from above (Figure 3).
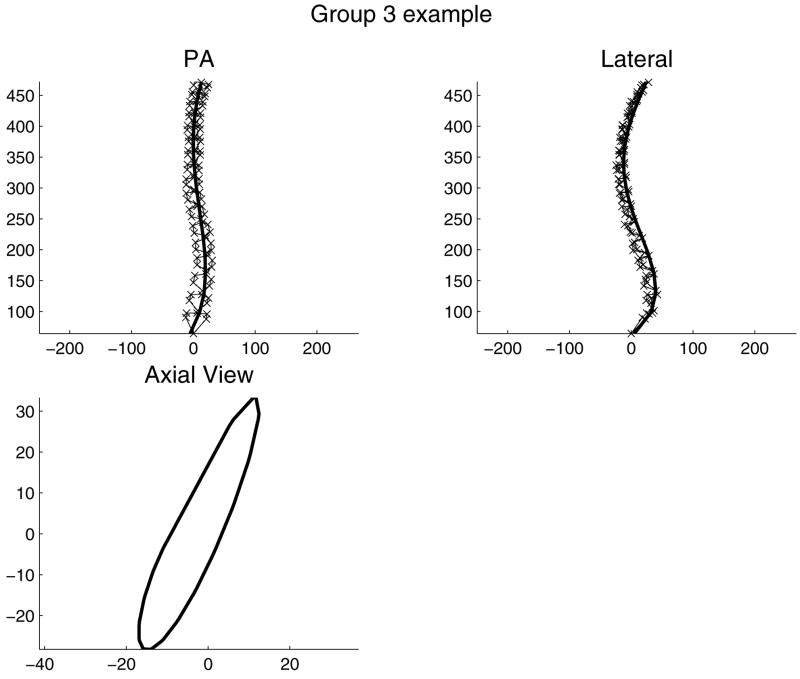
Group 3 (34 observations) had a pattern that was the reverse of this norm, with both PMC rotations negative. In fourteen of these cases the right upper curve and left-lower scoliosis curve pattern was present, but the sagittal plane curvatures in the curve regions was reversed. The other 20 cases had reversed pattern of side of the scoliosis.
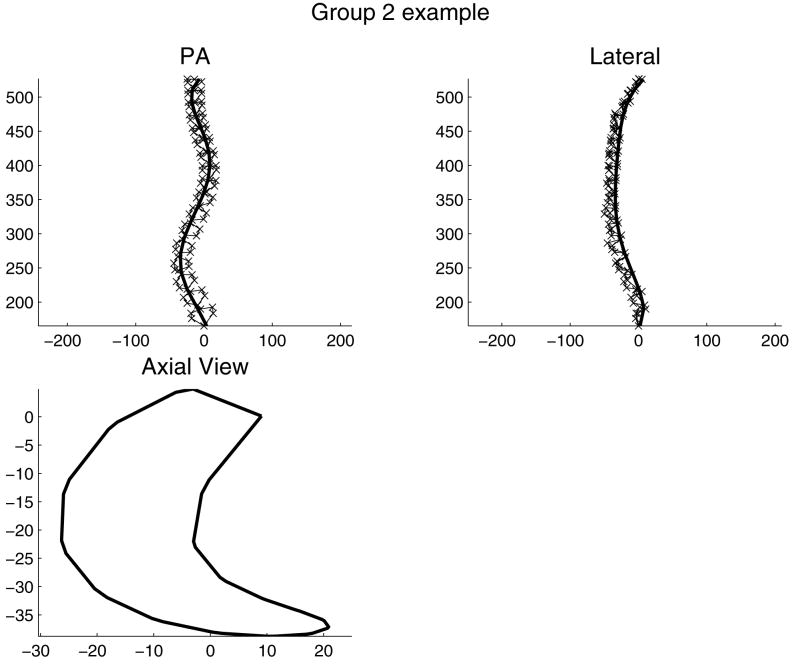
Group 2 (48 observations) had negative (clockwise) rotation of the PMC in the lower curve region. In all cases the curve pattern was right upper curve and left lower curve, with kyphosis in both curve regions. Group 4 was the smallest group (15 observations) with negative rotation of the PMC in the upper curve region. These had either the right upper curve and left lower curve pattern with lordosis in both curve regions (8 cases), or a left upper and right lower curve pattern with kyphosis in both curve regions (7 cases).
When the number of clusters was set to three, the two smallest groups of the 4-group analysis (Groups 3 and 4) were combined except that one member of Group 4 was combined with Group 1. When the number of clusters was set to five, Groups 1 and 2 remained unchanged; and one observation in Group 4 together with 20 observations in Group 3 created a new group. These additional analysis of 3 and 5 groups did not appear useful relative to the four-group analysis.
In the four-group analysis the groupings were consistent when two subsets of observations with larger curves (greater than 18 degrees, then greater than 27 degrees by automated [5] Cobb measurement) were selected and a cluster analysis was performed again. In these analyses the group assignments were identical to those determined in the analysis of the full dataset.
Among the 56 patients observed longitudinally, there were 25 who remained in the same group (same quadrant of the upper and lower curve PMC rotation scatterplot in Figure 4). The 31 who did not remain in the same group on repeat examination were not different on average with respect to scoliosis curve magnitude or change in curve magnitude. The mean (SD) Cobb angles for those who did not and those who did change grouping were 32 (4.8) and 30 (4.2) degrees respectively. Instead, the grouping changes were most commonly associated with a large change in the angle of the plane of maximum curvature of the upper curve, and this resulted from a change in sagittal plane curvature, not the Cobb angle. Among the patients who did not remain in the same group the mean sagittal curvature was 24% less, and the standard deviation (between examination variability) was 5 times greater than those patients who remained in the same group.
The single variable ‘curve apex’ (Figure 2) indicated that there was a bimodal distribution of the levels of apical vertebrae, indicating that curves (not patients) can be reliably grouped as ‘upper’ or ‘lower’ (with a level of T10 (no observations) identifying the boundary value between the groups. Conversely, in the plot of the absolute (unsigned) values of the two variables ‘upper Cobb angle’ and ‘lower Cobb angle’ (Figure 1) there was no evidence of any groupings, indicating that there is no clear distinction between the King-1 and King-2 groups if Cobb angle alone is used as the grouping criterion.
DISCUSSION
It was found that the spinal shape of patients with idiopathic scoliosis in a clinic population could be divided into four groups, according to the direction of rotation of the plane of maximum curvature in each of two curve regions. The direction of this rotation depends on the relative magnitudes and signs of the scoliotic and sagittal curvatures. It should be noted that the groupings identified here were very different from those that are commonly used in treatment planning. The present study was based on different curve shape parameters. The PMC is not used in any other existing classifications, but it was the key variable in determining the groupings identified here. The present study did not employ any measures of curve flexibility, or of spinal alignment relative to the vertical axis.
The cluster analysis of Duong et al. [4] had different findings in a less diverse group of patients with large (> 40 degrees Cobb) scoliosis. They performed a cluster analysis using curvatures in frontal, sagittal and maximum curvature planes, but did not include transverse plane rotation measurements and here the PMC rotation was found here to be the key parameter in determining group assignment.
The changes in group assignments of individual patients over multiple clinic visits (longitudinal study) were not associated with differing magnitudes of scoliosis, or changes in curve magnitude. The changed (inconsistent) group assignments were not more likely in either small or large curves, or with larger changes in curve magnitude (the standard deviations of the Cobb angles did not differ between those who did and did not retain consistent group assignment). Instead, the changes in group assignments resulted from changes in measurements of the rotation of the plane of maximum curvature, associated with larger changes in sagittal plane curvature in patients having lesser sagittal plane curvature. The rotation of the plane of maximum curvature is very sensitive to small changes in the sagittal profile when the sagittal plane curvature in the curve region is small, which was observed frequently. Small changes in the sagittal curvature could result from errors in measurements of vertebral landmark positions, and from small postural changes. Both were probably present in this study. The measurement of vertebral landmarks in three-dimensions was reported as having a standard deviation of 1.5 mm in the vertical direction, 0.9 mm in the horizontal (left-right) direction, and 3.8 mm in the horizontal (front-back) direction in a study of combined inter- and intra-observer variability [5]. Thus the errors are greater in the antero-posterior direction in the stereoradiography method employed here. Delorme et al. [9] reported that inter- and intra-observer variabilities were of approximately equal magnitude in measuring radiographs by a similar technique. The accuracy with which the spinal shape could be measured, together with changes resulting from postural variability were likely the main limitations of this study.
Patients with small scoliosis curvatures were included, by selecting those with two curves each having a curvature greater than 9 degrees by automatic Cobb angle measurement using the normals to the curved line passing through the centers of the vertebrae in the coronal plane. This threshold value corresponds to the 10 degrees value conventionally used to indicate presence of a scoliosis because the automatic Cobb angle measurement is about 12% greater than the Cobb angle values obtained from relative inclinations of the endplates [5]. Similarly the threshold values of 18 and 27 degree Cobb angles were selected for the evaluations of classification consistency to correspond to 20 and 30 degrees by the conventional measurement.
Patients studied here represent a diverse group probably representative of those seen in a scoliosis clinic, and included a large range of Cobb angle magnitudes. In each instance there were two (and only two) scoliosis curves of significant magnitude, with curve apices in the range T4 to L3. In selecting the 245 cases that met these criteria, eight cases with a single curve were excluded. In the selected cases, the two curves were designated as ‘upper’ and ‘lower’ to avoid using classifications based on the anatomical level of the curve apex. There were 35 instances of a ‘proximal thoracic’ curve (apex at T4 or T5), and of these 19 were left-convex, but in all cases they were paired with a curve to the opposite side, and having an apex at T11 or below. No curve had an apex at T10, and there were no double thoracic curves.
These findings from a clinic population having a large range of scoliosis magnitude may have implications for management and treatment of patients having either small or large curves. The classification draws attention to the importance of the rotation of the plane of maximum curvature, which represents the interaction between curvatures in the frontal and sagittal planes. This shape property may be helpful in planning surgery, but patient groupings based on it should not be the sole determinant of surgical planning.
Classification of scoliosis has traditionally been used primarily in surgical planning for patients having large curves. It is also possible that classification of curve types that includes measurements of the plane of maximum curvature could be used in assessing the likelihood of progression and indications for bracing for patients having small curves.
The finding that most of the other spinal shape measurements (Cobb angle, apex levels and axial rotation of apical vertebrae) did not show distinct groupings suggests that spinal deformity classifications based on those variables are not distinct, and that there is a continuous distribution of patients’ spinal shape. Management decisions should be treated individually according to continuous variable measurements, not by arbitrarily determined groupings.
Figure 6.
Illustrative example of a patient’s spinal shape in Group 2. ‘x’ = each of six landmarks (vertebral endplate centers and bases of pedicles) on each of 17 vertebrae (omitted from axial view for clarity). Solid line: a smoothed line fitted to the positions of landmarks at vertebral endplate centers. This spinal shape was classified as Group 2 because the combination of right upper scoliosis curve with kyphosis, and left lower curve with kyphosis provided the positive and negative rotations of the two planes of maximum curvature in the two respective scoliosis curve regions.
Figure 7.
Illustrative example of a patient’s spinal shape in Group 3. ‘x’ = each of six landmarks (vertebral endplate centers and bases of pedicles) on each of 17 vertebrae (omitted from axial view for clarity). Solid line: a smoothed line fitted to the positions of landmarks at vertebral endplate centers. This spinal shape was classified as Group 3 because the combination of left upper scoliosis curve with kyphosis, and right lower curve with lordosis provided the negative rotations of both planes of maximum curvature in the two respective scoliosis curve regions.
Acknowledgments
This work was made possible by support from NIH grant R01 AR 053132. We acknowledge helpful discussion with members of the SRS Working Group on Three-Dimensional Analysis (Lawrence Lenke, Hubert Labelle and Roger Jackson, Peter Newton).
References
- 1.King HA, Moe JH, Bradford DS, Winter RB. The selection of fusion levels in thoracic idiopathic scoliosis. J Bone Joint Surg. 1983;65:1302–1313. [PubMed] [Google Scholar]
- 2.Lenke LG, Betz RR, Harms J, et al. Adolescent idiopathic scoliosis: a new classification to determine extent of spinal arthrodesis. J Bone Joint Surg Am. 2001;83:1169–81. [PubMed] [Google Scholar]
- 3.Stokes IA, Aronsson DD. Computer-assisted algorithms improve reliability of King classification and Cobb angle measurement of scoliosis. Spine. 2006;31(6):665–670. doi: 10.1097/01.brs.0000203708.49972.ab. [DOI] [PubMed] [Google Scholar]
- 4.Duong L, Chariet F, Labelle H. Three-dimensional classification of spinal deformities using fuzzy clustering. Spine. 2006;31(8):923–930. doi: 10.1097/01.brs.0000209312.62384.c1. [DOI] [PubMed] [Google Scholar]
- 5.Stokes IAF, Bigalow LC, Moreland MS. Three-dimensional spinal curvature in idiopathic scoliosis. J Orthop Res. 1987;5:102–113. doi: 10.1002/jor.1100050113. [DOI] [PubMed] [Google Scholar]
- 6.Stokes IA. Axial rotation component of thoracic scoliosis. J Orthop Res. 2005;7(5):702–708. doi: 10.1002/jor.1100070511. [DOI] [PubMed] [Google Scholar]
- 7.Aubin CÉ, Lobeau D, Labelle H, Maquinghen-Godillon AP, LeBlanc R, Dansereau J, Stokes IAF. Research into Spinal Deformities 2. Amsterdam: IOS Press; 1999. Planes of Maximum Deformity in the Scoliotic Spine; pp. 45–48. [Google Scholar]
- 8.Stokes (chair) IAF. Scoliosis Research Society Working Group on 3-D terminology of spinal deformity: Three-dimensional terminology of spinal deformity. Spine. 1994;19:236–248. [PubMed] [Google Scholar]
- 9.Delorme S, Petit Y, de Guise JA, Labelle H, Aubin CE, Dansereau J. Assessment of the 3-D reconstruction and high-resolution geometrical modeling of the human skeletal trunk from 2-D radiographic images. IEEE Trans Biomed Eng. 2003;50(8):989–98. doi: 10.1109/TBME.2003.814525. [DOI] [PubMed] [Google Scholar]


