Abstract
We introduce a multimodal facial color imaging modality that provides a conventional color image, parallel and cross-polarization color images, and a fluorescent color image. We characterize the imaging modality and describe the image analysis methods for objective evaluation of skin lesions. The parallel and cross-polarization color images are useful for the analysis of skin texture, pigmentation, and vascularity. The polarization image, which is derived from parallel and cross-polarization color images, provides morphological information of superficial skin lesions. The fluorescent color image is useful for the evaluation of skin chromophores excited by UV-A radiation. In order to demonstrate the validity of the new imaging modality in dermatology, sample images were obtained from subjects with various skin disorders and image analysis methods were applied for objective evaluation of those lesions. In conclusion, we are confident that the imaging modality and analysis methods should be useful tools to simultaneously evaluate various skin lesions in dermatology.
Keywords: digital photography, fluorescence, polarization, facial skin image, wood’s lamp
1 Introduction
Various noninvasive point measurement devices (NPMDs) have been widely used to quantitatively evaluate skin lesions.1–6 However, the NPMDs cause user-dependent measurement errors due to contact mode and have limitations in their evaluation of widely distributed skin lesions due to poor spatial resolution and of skin lesions that require an extended treatment protocol due to poor reproducibility of the measurement on the identical skin site.7–9 As a result, digital color imaging modalities based on fluorescence and polarization have been introduced to complement the limitations of the NPMDs.10–17
Conventional digital color imaging has been routinely used as an essential evaluation tool of skin lesions in dermatology. However, the conventional digital color image has been qualitatively and subjectively evaluated due to poor reproducibility in the image acquisition. In order to minimize the user-dependent error in clinical practice, it is necessary to develop reproducible imaging modalities and objective image analysis methods.
Recently, there has been literature published to address such issues.8,9,18–20 Pigmented and vascular skin lesions were evaluated with a reproducible cross-polarization color imaging modality.18,20 Parallel-polarization images have been utilized in the analysis of skin surface texture, such as altered keratinization, hydration, wrinkling, and photoaging.21–23 Han et al.19 developed a reproducible UV-A (ultraviolet-A: 320–380 nm) excited fluorescent imaging modality and image analysis methods to quantitatively analyze sebum information. Such imaging modalities provide objective information for the evaluation of widely distributed skin lesions. In order to maximize the clinical utility of this approach to evaluate skin lesions, it is necessary to integrate independent imaging modalities into one imaging modality.
In this study, we developed a multimodal facial color imaging modality (MFCIM) that integrates four imaging methods into one imaging modality. The MFCIM provides a conventional digital color image (CDCI), parallel and cross-polarization color image (PPCI and CPCI), and a UV-A–excited fluorescent color image (FCI). The CDCI provides both surface morphological and subsurface chromophore information on skin lesions.22 Separately, the PPCI and CPCI can differentiate surface and subsurface information on skin lesions, respectively.21,23 UV-A excited FCI can simultaneously evaluate various skin disorders, such as photodamage, dyspigmentation, sebum, acne, bacterial invasion, and keratosis.10,11
The MFCIM takes four different color images from a subject in which each image presents different functional information on facial skin lesions. The images are analyzed with digital image processing to maximize the evaluation efficacy of skin lesions. In this study, we characterized the MFCIM and investigated its usefulness in dermatology by objectively evaluating various skin lesions.
2 Materials and Methods
2.1 MFCIM
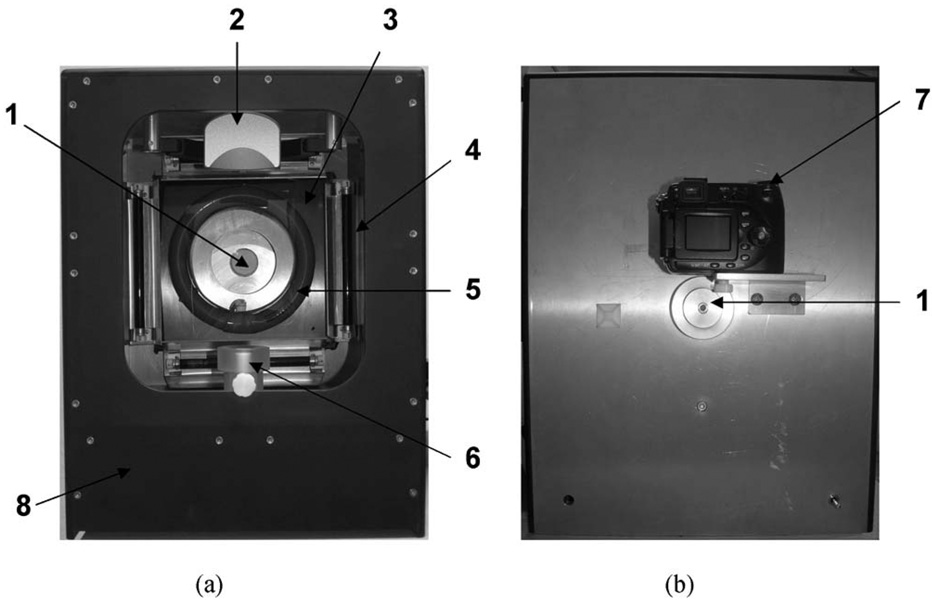
Figure 1 shows pictures of the MFCIM. Four UV-A lamps (320–380 nm, 6 W each, F6T5, Sankyo Denki, Japan) and a ring-shaped white light (400–700 nm, 30 W, FCL32S EX-D/30, WOOREE, Korea) were employed as light sources. The UV-A lamps have an identical optical spectrum to that reported in our previous study.19 The total power of the lamps was measured with a UV meter (Solarmeter® Model 5.0, So-lartech Inc., USA). The spectrum of the white light source was measured with a spectrometer (USB4000, Ocean Optics Inc., Florida, USA) equipped with an integrating sphere (ISP-REF, Ocean Optics Inc., Florida, USA). A linear polarizer was placed in front of the white light source to produce linearly polarized light. A laboratory-built, four-position filter wheel was integrated into the instrument. Three linear polarizers were integrated into the filter wheel at angles of 90 deg for CPCIs, 0 deg for PPCIs, and 45 deg for CDCIs over the polarization direction of the white light source. One filter position was utilized for the FCIs. A digital color camera (Coolpix 8400, Nikon, Tokyo, Japan) was placed in the center of the light sources and operated in manual mode. To ensure reproducible image acquisition, a custom-built head positioning device was integrated into the imaging box.
Fig. 1.
(a) Front and (b) rear view of the multimodal facial color imaging system, which consists of (1) four optical filters for conventional color imaging, cross and parallel polarization color imaging, and fluorescent color imaging; (2) a headrest, (3) a linear polarizer, (4) four UV-A lamps, (5) a ring-shaped white light, (6) a chin rest, and (7) a digital color camera. All compartments were integrated into (8) an imaging box.
2.1.1 Light distribution and reproducibility
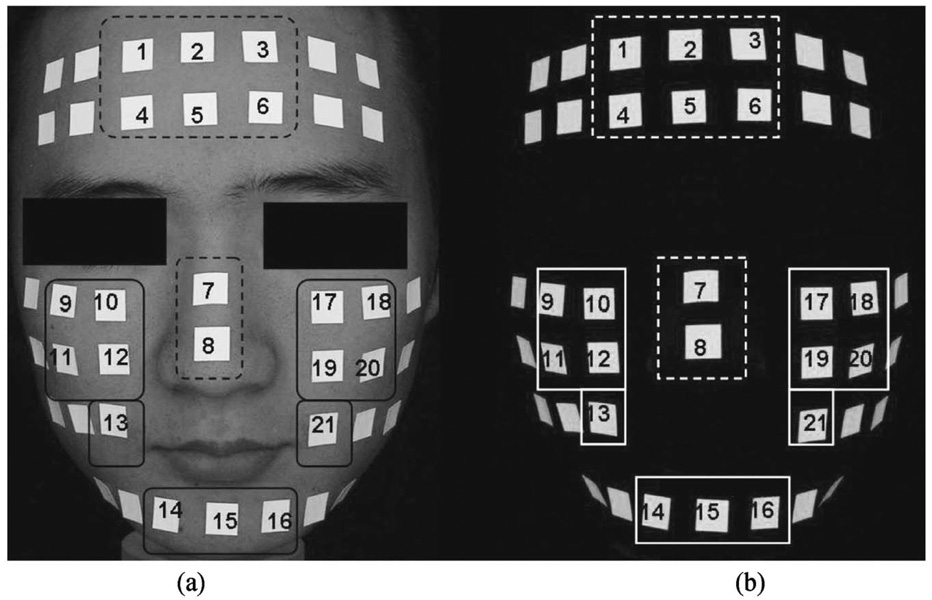
Uniform light distribution on facial skin is important for accurate comparison of skin lesions.8 Fluorescent patches (2×2 cm2) were placed on a subject’s face and sequentially numbered in the T-zone (forehead and nose) and U-zone (both cheeks and chin) as shown in Fig. 2. Fluorescent patch images for the UV-A lamp and white light source were acquired using different camera parameters to avoid saturation of the patches: ISO 100, aperture size F/2.9, and shutter speed 1/15 s (1/125 s) for white light source (UV-A lamp). Three replicate images were acquired from the subject. Light distribution was determined by evaluating coefficient of variation (CV) of the fluorescent patches in the T-zone (patch numbers 1–8) and U-zone (patch numbers 9–21).8,19 In addition, reproducibility of the instrument was evaluated to investigate the stability of the light sources and head positioning device.
Fig. 2.
(a) White light and (b) fluorescent images of a human facial model that were used to investigate the uniformity of light distribution and the reproducibility of the imaging modality. Fluorescent patches were placed in the T-zone (dotted line) and the U-zone (solid line) of a human face.
| (1) |
where μ and σ indicate the mean and standard deviation of selected patches, respectively. Lower CV values indicate better uniformity of light distribution.
2.1.2 Acquisition of sample images
Sample images of a 71-year-old Asian female were acquired in four different imaging modes. The white light source was utilized to obtain CCIs, CPCIs, and PPCIs; the UV-A lamp was used to obtain FCIs. Optimal camera parameters were as follows: ISO 100, aperture size F/2.9, and shutter speed 1/8 s (1 s) for the white light source (UV-A lamp). In addition, various facial skin lesion (wrinkle, hyper-, and hypopigmentation) images were acquired by the appropriate imaging mode as listed in Table 1 and utilized for objective analysis.
Table 1.
Dermatological applications of multimodal color images
| Imaging mode | Dermatologic applications |
|---|---|
| PPCI | Altered keratinization, hydration, wrinkle, photoaging, surface resurfacing of the skin, and wound-heal assessment. |
| CPCI | Port wine stain, rosacea, necrobioisis lipoidica diabeticorum, erythema, ichthyosis, psoriasis, dermatomyositis with calcinosis cutis, granuloma annulare lesions, melanoma, basal cell carcinoma, squamous cell carcinoma, and actinic keratosis. |
| FCI | Acne, solar lentigo, sun damage, keratosis, bacterial invasion, tinea capitas, hyper-pigmentation, and hypopigmentation |
| PI | Pigmented skin lesions (freckles, tattoo, pigmented nevi), unpigmented skin lesions [nonpigmented intradermal nevus, neurofibroma, actinic keratosis, malignant basal cell carcinoma, squamous cell carcinoma, vascular abnormality (venous lake), burn scar]. |
2.2 Examples of Image Analysis
Before image analysis, a shade-correction algorithm was applied to each color (red, green, and blue) channel image to minimize nonhomogeneity of illumination and CCD sensors as follows:
| (2) |
where A[m,n] is a shade-corrected color channel image; c[m,n] is each color channel image; white[m,n] and black[m,n] are reference images that represent bright and dark fields, respectively. A diffuse reflectance white target plate (Model No. R58-610, Edmund Optics, USA) was used to obtain the reference images. In this study, all images were acquired at optimal view angles,8 which provides relatively flat facial sites in order to minimize the artifacts caused by facial curvature in normalized values.
2.2.1 PPCIs
PPCIs effectively provide surface skin texture information.21–23 As an example, we analyzed skin wrinkles, particularly “crow’s feet” adjacent to the orbit. Skin textural features were enhanced by applying a spatial low-frequency pass filter to the blue channel image of PPCI [see Eq. (3)].24 The size of the filter depends on the size of the morphological features to be extracted. The radius of the disk filter was 10 pixels. The final image maintains only high-frequency spatial information by removing global contouring caused by facial geometry,
| (3) |
where I(x, y) is a morphologically enhanced image; IB(x, y) and B(x, y) are the original image and the blurred image processed with the spatial low-frequency pass filter, respectively. For quantitative analysis of wrinkles, the “shape factor” (SF) algorithm based on an object’s perimeter and area was applied to I(x, y).24.
2.2.2 CPCIs
The CPCIs were objectively analyzed by computing the erythema index (EI) and melanin index (MI) images, which were computed using the red and green channel images of the CPCIs.3 The EI and MI images can be utilized to objectively evaluate vascular and pigmented skin lesions, respectively. Higher index values indicate the skin lesions containing greater concentrations of blood and melanin,
| (4) |
| (5) |
where R and G indicate normalized red and green channel images, respectively. In the normalization process, red and green channel images were divided by average red and green values of the reflectance image, respectively.
2.2.3 Polarization images
Polarization images (PIs)25,26 were derived from PPCIs (Pparallel) and CPCIs (Pcross) as follows:
| (6) |
where Rs and Rd represent the superficially reflected light and the diffused light, respectively. The shorter wavelength of the white light source tends to represent very well the characteristics of superficial chromophores. Therefore, blue channel images of PPCIs and CPCIs were used to compute the PI. To minimize the computation error caused by motion artifact between Pparallel and Pcross, we computed the normalized cross-correlation matrix and its peak value, which provides the best correlation between the Pparallel and Pcross images.27.
2.2.4 FCIs
In a previous study, we presented fluorescent image analysis methods for quantitative evaluation of sebum-related parameters (pattern, area and density, average size and diameter of spots, condition of sebaceous follicles based on fluorescent color analysis of sebum).19 In addition to the sebum analysis, other skin lesions can be objectively analyzed using fluorescent imaging. As an example, vitiligo (which is a hypopigmented skin lesion) was analyzed. According to Schallreuter et al.,28 6- and 7-biopterins represent the principal endogenous fluorophores in vitiligo, whereas other depigmented skin lesions do not have a characteristic fluorescence. Therefore, green and red channel images of FCI were used to extract out information on the biopterins, which have 350 nm excitation and 450 nm emission wavelengths while at the same time minimizing the porphyrins contribution, which has 400–450 nm excitation and 630 and 690 nm emission wavelengths.29,30 In order to objectively evaluate the degree of vitiligo, a vitiligo index (VI) image was computed as follows:
| (7) |
where G and R represent the normalized green and red channel images of the FCI, respectively. The VI image minimizes the overlapped spectral response between green and red channel images containing the biopterin and porphyrin signals, respectively.
2.3 Clinical Utility
As single-mode imaging modalities, the clinical usefulness of CPCIs and FCIs has previously been well described in our previous studies.9,18–20 Details of the PI have been well demonstrated by Jacques et al..25,26.
In this study, the treatment efficacy of vitiligo and the statistical correlation between total length of wrinkles and chronological age were evaluated to demonstrate the validity of MFCIM and image analysis methods. Fifteen Asian females of age 20–80 years were recruited, and their PPCIs obtained for wrinkle analysis. FCIs of a 23-year-old Asian male on medication [methylon 2 mg, Vit-C 500 mg, and stillen 60 mg were administered/protopic ointment (0.03%)] to treat vitiligo for two months were obtained before and after therapy in order to evaluate treatment efficacy using the VI image. All subjects were requested to clean their face, and the use of any topical cosmetics on the face was prohibited before the images were obtained.
3 Results
3.1 Characterization of Imaging Modality
3.1.1 Light sources
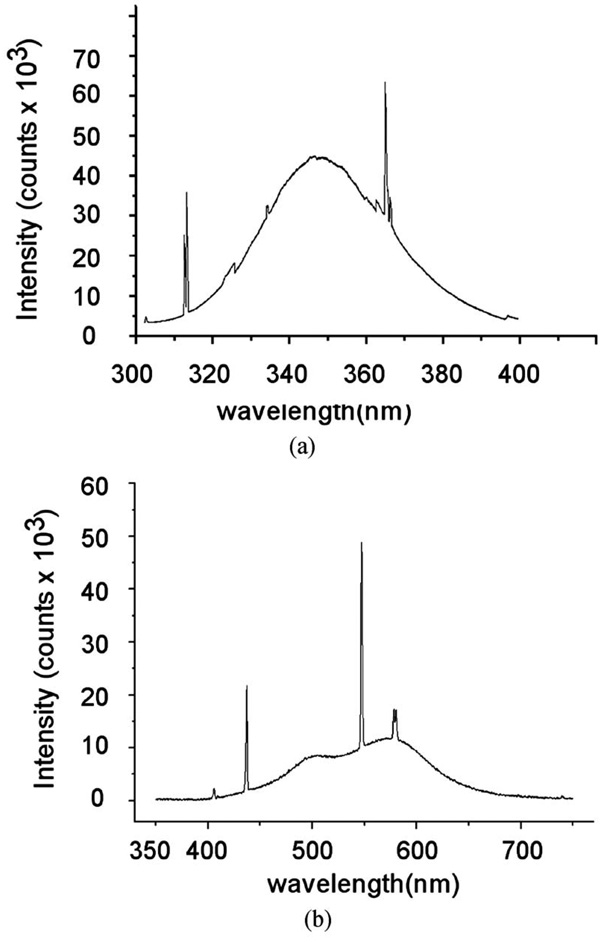
Total power of UV-A lamps on facial skin was 1.2 mW/cm2, which is typical radiation.10 Figure 3 shows the measured spectrum of the UV-A and white light source, which broadly spreads out enough to cover the optical characteristics of various chromophores in the spectral range.
Fig. 3.
Optical spectrum for the (a) UV-A and (b) white light source.
3.1.2 Reproducibility and light distribution
Figures 2(a) and 2(b) show fluorescent patch images due to the white light source and UV-A lamps, respectively. The uniformity of light distribution and reproducibility of MFCIM are summarized in Table 2. The statistics (μ±σ) of reproducibility evaluation in the T-zone (U-zone) were 226.41±2.41 (201.18±1.65) for the white light source and 210.63±6.65 (200.32±4.33) for the UV-A lamps, respectively. In terms of light distribution evaluation, mean CVs in the T-zone (U-zone) were 5.26% (7.63%) for the white light source and 4.70% (5.89%) for the UV-A lamps, respectively. The CV in the U-zone as compared to the T-zone was higher for both light sources.
Table 2.
The uniformity and reproducibility of the light distribution on facial skin. Related parameters are mean (μ), standard deviation (σ), and coefficient of variance [CV(%)=(σ/μ) × 100].
| White light source | UV-A source | |||
|---|---|---|---|---|
| Patch No. (1—21) |
T-zone (Patch No. 1–8) |
U-zone (Patch No. 9—21) |
T-zone (Patch No. 1—8) |
U-zone (Patch No. 9—21) |
| μ | 226.41±2.41 | 201.18±1.65 | 210.63±6.65 | 200.32±4.33 |
| σ | 11.92 | 15.36 | 9.93 | 11.81 |
| CV (%) | 5.26 | 7.63 | 4.70 | 5.89 |
3.2 Sample Images
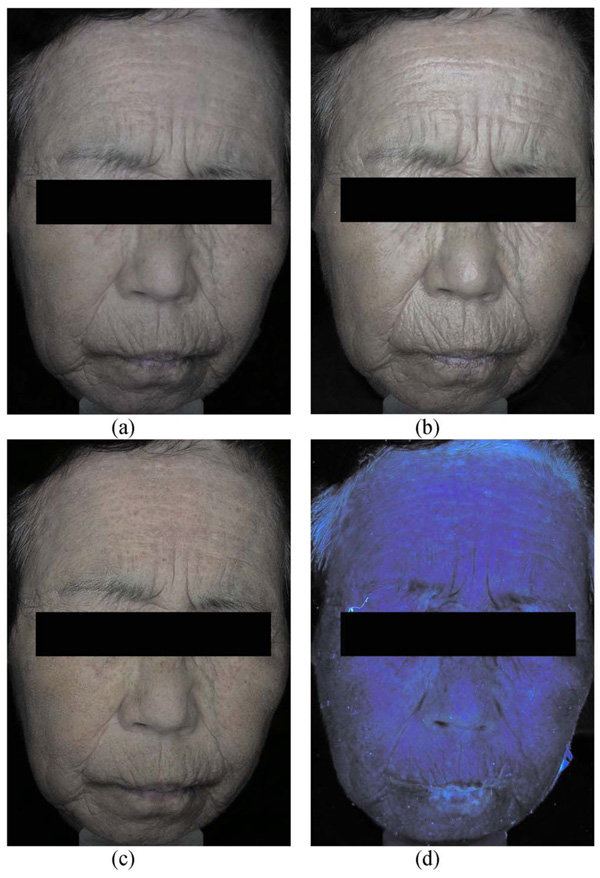
Figure 4 shows sample images acquired using the four imaging modes of MFCIM. CDCI represents both surface and subsurface morphological and chromophore information of skin lesions [see Fig. 4(a)]. Therefore, it affords an opportunity for clinicians to qualitatively evaluate skin lesions and to compare to objective functional images computed with image analysis methods. PPIC effectively emphasizes textural information from the skin surface [see Fig. 4(b)]. CPCI reveals relatively well subsurface vascular and pigmentation information of skin lesions [see Fig. 4(c)]. Because the analysis of the CPCI is fundamentally a color-dependent procedure, the spectrum of the white light source as shown in Fig. 3 should be broad enough to reflect all chromophores that might be present in the skin. An FCI simultaneously shows both autofluorescent and reflection signals of chromophores on skin lesions [see Fig. 4(d)]. Therefore, an optical UV cutoff filter can be used to selectively obtain an autofluorescent signal.
Fig. 4.
Sample images of a subject: (a) conventional color image, (b) PPCI, (c) CPCI, and (d) FCI.
3.3 Examples of Image Analysis
Laboratory written Matlab (version 7.0, The MathWorks, Natick, MA) programs were used for the following image analysis.
3.3.1 Parallel polarization color image
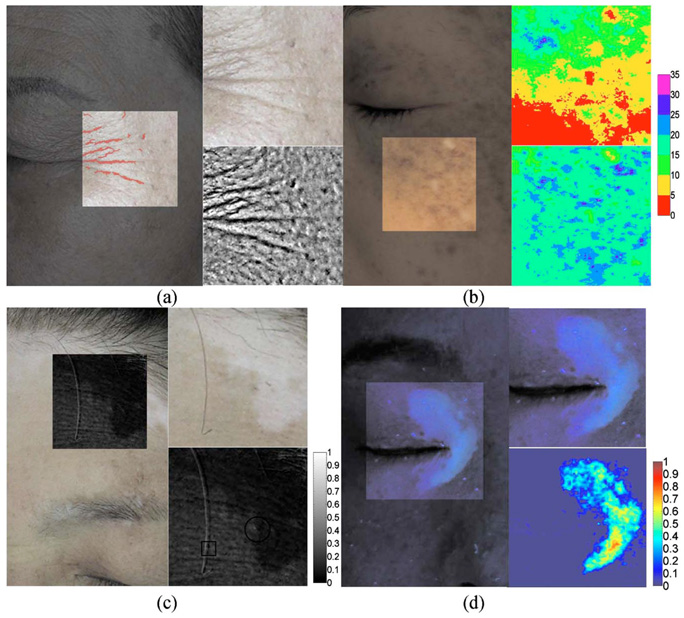
Figure 5(a) shows a PPCI and its corresponding wrinkle mapping image (left) of a 67-year-old Asian female. Upper and lower right images show a region of interest and the spatially filtered image, respectively. The quantitative image analysis was based on the study by Gartstein and Shaya.24 Total lengths of the wrinkle were determined to be 98.08 mm.
Fig. 5.
Objective analysis of multimodal color images: (a) skin wrinkle image computed from PPCIs, (b) EI and MI images computed from CPCIs, (c) polarization image computed from CPCIs and PPCIs, and (d) VI image computed from FCIs.
3.3.2 Cross-polarization color image
Figure 5(b) shows a CPCI (left) and its corresponding MI (upper-right) and EI (lower-right) images of a 38-year-old Asian female. Using a shade-corrected image and Eq. (4) and Eq. (5), the CPCI was objectively evaluated by mapping pseudo colors with the pixel values of the MI and EI images. The color bar denotes relative value of skin erythema and melanin content. Higher index values indicate higher erythema and melanin content.
3.3.3 Polarization image
Figure 5(c) shows a CPCI (left) of a 59-year-old Asian female with hypopigmentation and some solar lentigines on the forehead. For the evaluation, a region of interest (upper right) was extracted and utilized to compute the PI (lower right). The PI is sensitive to backscattered light from superficial chromophores in the skin.25,26 As a result, the vitiligo lesion shows low index values in the PI due to the lack of scatterers, such as melanocytes, at the epidermal basal layer.
3.3.4 FCI
Figure 5(d) shows an FCI (left) of a 46-year-old Asian female with facial vitiligo. A vitiligo lesion (upper right) was extracted out and utilized to compute its VI (lower right) using Eq. (7). Because the porphyrin emission signal usually has a higher value than 6- and 7-biopterins, VI values of <0 were replaced as 0.0001. Higher index values indicate higher biopterin content, which represents more severe vitiligo.
3.4 Clinical Utility
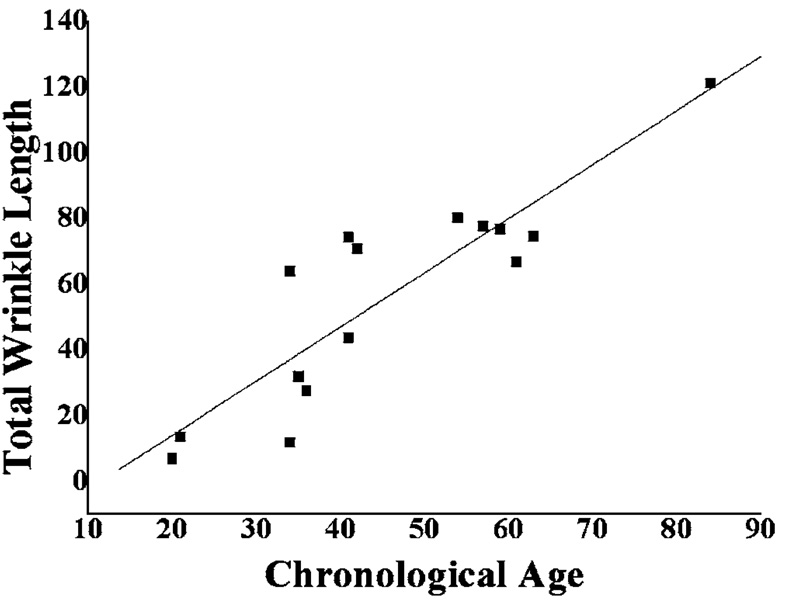
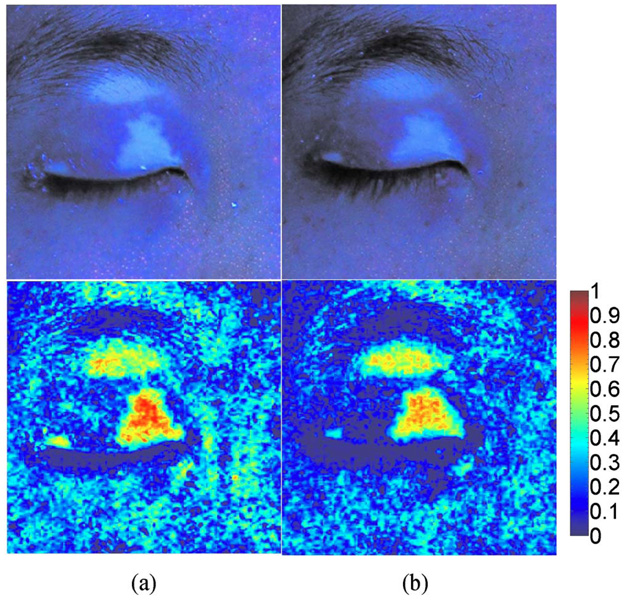
The total lengths of wrinkles were derived from PPCIs and evaluated as a function of chronological age. A good linear correlation (R=0.88, p<0.0001) was obtained (see Fig. 6). Figure 7 shows the FCIs before and after treatment of facial periocular vitiligo. The processed VI images clearly demonstrate the change in distribution and concentration of 6- and 7-biopterins in response to therapy.
Fig. 6.
Linear correlation study between chronological age and total wrinkle length.
Fig. 7.
FCI (upper image) and VI image (lower image) of a subject with facial periocular vitiligo (a) before and (b) after treatment.
4 Discussion
Unlike our previous study,19 the light distribution in the U-zone as compared to the T-zone resulted in a slightly higher value of CV for both light sources (see Table 2) due to the different number of patches used in the analysis. The CVs for UV-A lamps were similar to those reported in our previous fluorescent imaging modality even though an in situ human face with a more irregular curvature pattern was used instead of a mannequin model. Such high reproducibility might be attributed to a well-designed head-positioning device, which can be adjusted in both the vertical and horizontal directions.8.
As shown in Fig. 4, sample images of a subject were acquired at four imaging modes and provided good subjective information on facial skin lesions. Each image emphasizes different morphological and functional skin information as described. During clinical evaluation, four images can be simultaneously utilized to provide a more reliable and efficient diagnosis of skin lesions, minimizing evaluation error. In future studies, other skin lesions need to be investigated to expand the clinical utility of MFCIM.
Alternatively, a multispectral imaging modality (MSIM) which simultaneously provides 2-D morphological and spectral information can be utilized to provide high sensitivity and specificity in the evaluation of skin lesions. However, it might not be an appropriate method for clinical application because it takes images as a function of wavelength, normally at 10-nm spectral resolution, which requires relatively longer image acquisition time and therefore causes a motion artifact during image acquisition that results in potential errors in image processing. When compared to the MSIM, the MFCIM completely removes the motion artifact, provides faster image acquisition, and can be built at a relatively low cost. However, when the MFCIM can be combined with band-pass filters or a wavelength-selective light source, it can partly utilize the advantages of the MSIM even though it does not still provide high-resolution spectral information.
According to previous studies, intrinsic aging can be revealed by wrinkles such as “crow’s feet,” which can be considered as one of the most striking clinical examples of photoaging.31 Although silicone replica is the gold standard to study wrinkle morphology by electromicroscopic examination, the method is very cumbersome and time consuming.32 In order to provide relatively faster analysis, we evaluated wrinkles with PPCIs and extracted quantitative information of total lengths, which were used to evaluate the chronological age of our subjects [see Fig. 5(a)]. Unlike the study done by Garstein and Shaya,24 which used CDCIs in the analysis, objects classified as spots (SF<4.5) were considered as noise signals because PPCIs mainly only provide information on skin texture. As shown in Fig. 6, total wrinkle length and chronological age resulted in a good linear correlation (R =0.88), which is comparable to the study of Garstein and Shaya,24 although a smaller number of samples was evaluated. It should be noted that the PPCI method has to be concomitantly used due to its lower accuracy as compared to the silicon replica method.
The CPCI method has been widely used clinically.21,23,33,34 Jung et al.9,18 demonstrated the usefulness of the EI image derived from CPCIs in the evaluation of port wine stains. The CPCI method was used to compute MI and EI images, which were useful to evaluate melanin and hemoglobin content in skin lesions, respectively [see Fig. 5(b)].
PI can enhance the image contrast of pigmented and non-pigmented skin lesions.26 We demonstrated the clinical utility of PI by analyzing vitiligo and freckles on the forehead [see Fig. 5(c)]. The melanin in freckles [solid black circle line in Fig. 5(c)], which contributed to both the PPCIs and CPCIs, was canceled out by taking the ratio in PI. When compared to previous studies,25,26 similar results were observed from PI evaluation. Vitiligo, which was widely spread out from the upper-left to the bottom-right corners, resulted in low PI index values. The characteristic of PI can be explained in terms of superficially reflected light,26 and the vitiligo lesion contains a relatively small number of scatterers, such as melanocytes. Therefore, the amount of light backscattered from a vitiligo lesion is relatively low as compared to normal skin, resulting in low PI index values.
In computing PI, the maximum cross-correlation value between PPCIs and CPCIs was 0.83, which is relatively high when considering that the value was derived from two different images. Such a good cross-correlation value might be due to a well-designed head-positioning device integrated into the MFCIM. We demonstrated the usefulness of a normalized cross-correlation algorithm by partially altering two images; that is, after taking a PPCI, a single hair was moved before taking the CPCI [solid black square line in Fig. 5(c)]. The result shows a reliable PI because the algorithm finds the x and y offsets and assembles two images only based on the maximum value of cross-correlation.
According to the Vitiligo European Task Force,35 any quantitative evaluation of vitiligo has not been introduced thus far, although it is one of the most common cutaneous disorders (0.5–1% of population). Recently, Nugroho et al.36 proposed an image analysis method that measured the area of vitiligo lesions based on image segmentation, in order to evaluate the repigmentation progression. However, vitiligo cannot be quantified only by considering its area because the cycling of 6-BH4 can be impaired in vitiligo lesions, leading to time-dependent accumulation of 7-BH4. Therefore, the concentrations of 6- and 7-biopterins are increased as a result of the photooxidation process. As a result, the vitiligo area during treatment might be consistent while the concentrations of biopterins are decreased.28,29 We expect that vitiligo can be evaluated with FCIs and might be quantified with a 2-D profile of the biopterin distribution [see Fig. 5(d)]. To investigate the validity of the proposed method, we are designing a comparison experiment between biopsy evaluation and image analysis for various types of vitiligo.
Overall, VI values after treatment were decreased in the vitiligo lesion while no noticeable change was qualitatively observed in the vitiligo area (see Fig. 7). The images before and after treatment show that the porphyrins emission signal was effectively eliminated using the VI. The porphyrin emission signals are observed in the red channel image, which is partially overlapped with the green channel image due to the broadband spectral characteristics of the CCD camera. There-fore, the subtraction of the red channel image from the green channel image with the emission signal of biopterins can minimize the emission signals of porphyrins.
Alternatively, it has been also reported that there is a correlation between the level of antimelanocyte antibodies, which can destroy human melanocytes and the extent of vitiligo.37 Therefore, it is possible to insist that the fluorescent signal originates from collagen in the dermis and is quenched by the regenerated melanin in the epidermis after therapy. However, we could not observe any difference in the PI and MI images before and after treatment on identical skin lesions. This means that the fluorescent signal in the VI image originated from the biopterins in the epidermis because the MI image provides information on melanin concentration, which is related to the epidermal melanin absorption coefficient, and PI provides information on scatterers such as melanocyte in superficial skin layers. Therefore, we assume that the VI image might be utilized to differentiate the vitiligo due to the deregulation of melanin biosynthesis from the other skin dyspigmentation due to the destruction of melanocytes in the epidermis.
5 Conclusion
MFCIM was able to provide reproducible and reliable color images in four different imaging modes for the evaluation of facial skin lesions. In addition, various image analysis methods were applied to obtain objective functional information on skin lesions. The results show comparable or even advanced capability of the MFCIM as compared to single imaging modalities. In conclusion, we are confident that the MFCIM can be utilized as a complementary tool for the evaluation of skin lesions.
Acknowledgments
This research was supported by a grant from the Next Generation New Technology Development Program Grant No. (10028424) provided by the Ministry of Knowledge Economy of the Korean Government. J. S. Nelson was supported by two grants from the National Institutes of Health (No. AR47751 and No. EB 2495).
Contributor Information
Youngwoo Bae, Yonsei University, Department of Biomedical Engineering, 234 Maeji, Heungup-myun, Wonju-Ci, Gangwon-Do 220-710, Korea.
J. Stuart Nelson, University of California, Beckman Laser Institute, 1002 Health Sciences Road East, Irvine, California 92612.
Byungjo Jung, Yonsei University, Department of Biomedical Engineering and Institute of Medical Engineering, 234 Maeji, Heungup-myun, Wonju-Ci, Gangwon-Do 220-710, Korea.
References
- 1.Troilius A, Wardell K, Bornmyr S, Nilsson GE, Ljunggren B. Evaluation of port wine stain perfusion by laser Doppler imaging and thermography before and after argon laser treatment. Acta Derm Venereol. 1992;72(1):6–10. [PubMed] [Google Scholar]
- 2.Troilius A, Ljunggren B. Reflectance spectrophotometry in the objective assessment of dye laser-treated port-wine stains. Br. J. Dermatol. 1995;132(2):245–250. doi: 10.1111/j.1365-2133.1995.tb05020.x. [DOI] [PubMed] [Google Scholar]
- 3.Le KV, Shahidullah H, Frieden IJ. Review of modern techniques in detecting port-wine stain response to laser therapy. Dermatol. Surg. 1999;25(2):127–132. doi: 10.1046/j.1524-4725.1999.08166.x. [DOI] [PubMed] [Google Scholar]
- 4.Clarys P, Alewaeters K, Lambrecht R, Barel AO. Skin color measurements: comparison between three instruments: The Chromameter (R), the DermaSpectrometer(R) and the Mexameter(R) Skin Res. Technol. 2000;6(4):230–238. doi: 10.1034/j.1600-0846.2000.006004230.x. [DOI] [PubMed] [Google Scholar]
- 5.Shriver MD, Parra EJ. Comparison of narrow-band reflectance spectroscopy and tristimulus colorimetry for measurements of skin and hair color in persons of different biological ancestry. Am. J. Phys. Anthropol. 2000;112(1):17–27. doi: 10.1002/(SICI)1096-8644(200005)112:1<17::AID-AJPA3>3.0.CO;2-D. [DOI] [PubMed] [Google Scholar]
- 6.Marghoob AA, Swindle LD, Moricz CZ, Sanchez Negron FA, Slue B, Halpern AC, Kopf AW. Instruments and new technologies for the in vivo diagnosis of melanoma. J. Am. Acad. Dermatol. 2003;49(5):777–797. doi: 10.1016/s0190-9622(03)02470-8. quiz 798-779. [DOI] [PubMed] [Google Scholar]
- 7.Fullerton A, Fischer T, Lahti A, Wilhelm KP, Takiwaki H, Serup J. Guidelines for measurement of skin colour and erythema: A report from the Standardization Group of the European Society of Contact Dermatitis. Contact Dermatitis. 1996;35(1):1–10. doi: 10.1111/j.1600-0536.1996.tb02258.x. [DOI] [PubMed] [Google Scholar]
- 8.Jung B, Choi B, Shin Y, Durkin AJ, Nelson JS. Determination of optimal view angles for quantitative facial image analysis. J. Biomed. Opt. 2005;10(2):024002. doi: 10.1117/1.1895987. [DOI] [PubMed] [Google Scholar]
- 9.Jung B, Kim CS, Choi B, Kelly KM, Nelson JS. Use of erythema index imaging for systematic analysis of port wine stain skin response to laser therapy. Lasers Surg. Med. 2005;37(3):186–191. doi: 10.1002/lsm.20218. [DOI] [PubMed] [Google Scholar]
- 10.Asawanonda P, Taylor CR. Wood’s light in dermatology. Int. J. Dermatol. 1999;38(11):801–807. doi: 10.1046/j.1365-4362.1999.00794.x. [DOI] [PubMed] [Google Scholar]
- 11.Niamtu J., 3rd Digitally processed ultraviolet images: A convenient, affordable, reproducible means of illustrating ultraviolet clinical examination. Dermatol. Surg. 2001;27(12):1039–1042. doi: 10.1046/j.1524-4725.2001.01115.x. [DOI] [PubMed] [Google Scholar]
- 12.Rah DK, Kim SC, Lee KH, Park BY, Kim DW. Objective evaluation of treatment effects on port-wine stains using L*a*b* color coordinates. Plast. Reconstr. Surg. 2001;108(4):842–847. doi: 10.1097/00006534-200109150-00005. [DOI] [PubMed] [Google Scholar]
- 13.Yong-Gee SA, Kurwa HA, Barlow RJ. Objective assessment of port-wine stains following treatment with the 585 nm pulsed dye laser. Australas J. Dermatol. 2001;42(4):243–246. doi: 10.1046/j.1440-0960.2001.00528.x. [DOI] [PubMed] [Google Scholar]
- 14.Miyamoto K, Takiwaki H, Hillebrand GG, Arase S. Development of a digital imaging system for objective measurement of hyperpigmented spots on the face. Skin Res. Technol. 2002;8(4):227–235. doi: 10.1034/j.1600-0846.2002.00325.x. [DOI] [PubMed] [Google Scholar]
- 15.Miyamoto K, Takiwaki H, Hillebrand GG, Arase S. Utilization of a high-resolution digital imaging system for the objective and quantitative assessment of hyperpigmented spots on the face. Skin Res. Technol. 2002;8(2):73–77. doi: 10.1034/j.1600-0846.2001.80202.x. [DOI] [PubMed] [Google Scholar]
- 16.Setaro M, Sparavigna A. Quantification of erythema using digital camera and computer-based colour image analysis: a multicentre study. Skin Res. Technol. 2002;8(2):84–88. doi: 10.1034/j.1600-0846.2002.00328.x. [DOI] [PubMed] [Google Scholar]
- 17.Takiwaki H, Miyaoka Y, Kohno H, Arase S. Graphic analysis of the relationship between skin colour change and variations in the amounts of melanin and haemoglobin. Skin Res. Technol. 2002;8(2):78–83. doi: 10.1034/j.1600-0846.2002.00333.x. [DOI] [PubMed] [Google Scholar]
- 18.Jung B, Choi B, Durkin AJ, Kelly KM, Nelson JS. Characterization of port wine stain skin erythema and melanin content using cross-polarized diffuse reflectance imaging. Lasers Surg. Med. 2004;34(2):174–181. doi: 10.1002/lsm.10242. [DOI] [PubMed] [Google Scholar]
- 19.Han B, Jung B, Nelson JS, Choi EH. Analysis of facial sebum distribution using a digital fluorescent imaging system. J. Biomed. Opt. 2007;12(1):014006. doi: 10.1117/1.2435700. [DOI] [PubMed] [Google Scholar]
- 20.Kang H, Jung B, Nelson JS. Polarization color imaging system for on-line quantitative evaluation of facial skin lesions. Dermatol. Surg. 2007;33(11):1350–1356. doi: 10.1111/j.1524-4725.2007.33288.x. [DOI] [PubMed] [Google Scholar]
- 21.Anderson RR. Polarized light examination and photography of the skin. Arch. Dermatol. 1991;127(7):1000–1005. [PubMed] [Google Scholar]
- 22.Muccini JA, Kollias N, Phillips SB, Anderson RR, Sober AJ, Stiller MJ, Drake LA. Polarized light photography in the evaluation of photoaging. J. Am. Acad. Dermatol. 1995;33(5 Pt 1):765–769. doi: 10.1016/0190-9622(95)91813-2. [DOI] [PubMed] [Google Scholar]
- 23.Arrazola P, Mullani NA, Abramovits W. DermLite II: An innovative portable instrument for dermoscopy without the need of immersion fluids. Skinmed. 2005;4(2):78–83. doi: 10.1111/j.1540-9740.2005.04363.x. [DOI] [PubMed] [Google Scholar]
- 24.Gartstein V, Shaya SA. Assessment of visual signs of skin aging. In: Wilhelm K-P, Elsner P, Berardesca E, Maibach HI, editors. Bioengineering of the Skin: Cutaneous Blood Flow and Erythema. Boca Raton: CRC Press; 1995. pp. 331–344. [Google Scholar]
- 25.Jacques SL, Roman JR, Lee K. Imaging superficial tissues with polarized light. Lasers Surg. Med. 2000;26(2):119–129. doi: 10.1002/(sici)1096-9101(2000)26:2<119::aid-lsm3>3.0.co;2-y. [DOI] [PubMed] [Google Scholar]
- 26.Jacques SL, Ramella-Roman JC, Lee K. Imaging skin pathology with polarized light. J. Biomed. Opt. 2002;7(3):329–340. doi: 10.1117/1.1484498. [DOI] [PubMed] [Google Scholar]
- 27.Haralick RM, Shapiro LG. Computer and Robot Vision. Reading, MA: Addison-Wesley; 1992. [Google Scholar]
- 28.Schallreuter KU, Wood JM, Pittelkow MR, Gutlich M, Lemke KR, Rodl W, Swanson NN, Hitzemann K, Ziegler I. Regulation of melanin biosynthesis in the human epidermis by tetrahydrobiopterin. Science. 1994;263(5152):1444–1446. doi: 10.1126/science.8128228. [DOI] [PubMed] [Google Scholar]
- 29.Ziegler I, Hultner L. Tetrahydro-6-biopterin is associated with tetrahydro-7-biopterin in primary murine mast cells. FEBS Lett. 1992;307(2):147–150. doi: 10.1016/0014-5793(92)80755-6. [DOI] [PubMed] [Google Scholar]
- 30.Herpens A, Schagen S, Scheede S. Fluorescence photography of sebaceous follicles. In: Serup J, Jemec BE, Grove GL, editors. Handbook of Non-Invasive Methods and the Skin. 2nd Ed. Boca Raton: CRC Press; 2006. pp. 853–860. [Google Scholar]
- 31.Kappes UP. Skin ageing and wrinkles: clinical and photographic scoring. J. Cosmet. Dermatol. 2004;3(1):23–25. doi: 10.1111/j.1473-2130.2004.00092.x. [DOI] [PubMed] [Google Scholar]
- 32.Grover R, Grobbelaar AO, Morgan BD, Gault DT. A quantitative method for the assessment of facial rejuvenation: A prospective study investigating the carbon dioxide laser. Br. J. Plast. Surg. 1998;51(1):8–13. doi: 10.1054/bjps.1997.0090. [DOI] [PubMed] [Google Scholar]
- 33.Demos S, Radousky H, Alfano R. Deep subsurface imaging in tissues using spectral and polarization filtering. Opt. Express. 2000;7(1):23–28. doi: 10.1364/oe.7.000023. [DOI] [PubMed] [Google Scholar]
- 34.Schiessler C, Schaudig S, Harris AG, Christ F. Orthogonal polarization spectral imaging—A new clinical method for monitoring of microcirculation. Anaesthesist. 2002;51(7):576–579. doi: 10.1007/s00101-002-0341-6. [DOI] [PubMed] [Google Scholar]
- 35.Taieb A, Picardo M. The definition and assessment of vitiligo: A consensus report of the Vitiligo European Task Force. Pigment Cell Res. 2007;20(1):27–35. doi: 10.1111/j.1600-0749.2006.00355.x. [DOI] [PubMed] [Google Scholar]
- 36.Nugroho H, Fadzil MH, Yap VV, Norashikin S, Suraiya HH. Determination of skin repigmentation progression. Proc. IEEE. 2007;2007:3442–3445. doi: 10.1109/IEMBS.2007.4353071. [DOI] [PubMed] [Google Scholar]
- 37.Park YK, Kim NS, Hann SK, Im S. Identification of autoantibody to melanocytes and characterization of vitiligo antigen in vitiligo patients. J. Dermatol. Sci. 1996;11(2):111–120. doi: 10.1016/0923-1811(95)00427-0. [DOI] [PubMed] [Google Scholar]


