Abstract
Loss of TGFBI, a secreted protein induced by TGF-β, has been implicated in cell proliferation, tumor progression and angiogenesis by in vitro studies. However, in vivo anti-tumor functions of TGFBI as well as the underlying molecular mechanism are not well understood. To these aims, we have generated a mouse model with disruption of TGFBI genomic locus. Mice lacking TGFBI show a retarded growth, and are prone to spontaneous tumors and DMBA (dimethylbenz (a)anthracene)-induced skin tumors. In relative to wild type mouse embryonic fibroblasts (MEFs), TGFBI−/− MEFs display increased frequencies of chromosomal aberration and micronuclei formation, and exhibit an enhanced proliferation and early S-phase entry. Cyclin D1 is upregulated in TGFBI−/− MEFs, which correlates with aberrant activation of transcription factor CREB (cAMP-response binding protein) identified by chromatin immunoprecipitation (ChIP) and luciferase reporter assays. TGFBI reconstitution in TGFBI−/− cells by either retroviral infection with wild type TGFBI gene or supplement with recombinant mouse TGFBI protein in the culture medium leads to the suppression of CREB activation and cyclin D1 expression, and further inhibition of cell proliferation. Cyclin D1 upregulation was also identified in most of tumors arising from TGFBI−/− mice. Our studies provide the first evidence that TGFBI functions as a tumor suppressor in vivo.
Introduction
Tumor growth and metastasis is a multistep process involving cell adhesion, proteolytic enzyme degradation of the extracellular matrix (ECM) and motility factors that influence cell migration (1, 2). Integrins are cell surface adhesive receptors composed of α- and β-chain heterocomplexes. Both subunits transverse the membrane and mediate the physical and functional interactions between cell and its surrounding ECM, thus serving as bidirectional transducers of extra- and intracellular signals which ultimately lead to regulation of adhesion, proliferation, differentiation, antiapoptosis and tumor progression (3, 4).
TGFBI was first identified in a human lung adenocarcinoma cell line (A549) treated with TGF-β (5). This gene encodes a highly conserved 683 amino-acid protein that contains a secretary signal sequence and four internal homologous domains, the last of which contains an RGD (Arg-Gly-Asp) motif which can serve as a ligand recognition site for integrins (5). TGFBI product has been shown to be a component of ECM in lung and mediate cell adhesion and migration through interacting with integrin via integrin receptors: α3β1, αvβ3, and αvβ5 (6–10). It is ubiquitously expressed in human normal tissues; however, downregulation or lost expression of this gene has been found in a list of human tumor cell lines including lung, breast, colon, prostate, and leukemia as well as in human primary lung and breast tumor specimens (11–14). CpG island hypermethylation in the promoter region, one of the mechanisms by which tumor suppressor genes are inactivated in human cancers, correlates with the silencing of TGFBI promoter and its subsequent down-expression (15). In vitro studies have implicated its role in maintaining microtubule stability, and inhibiting tumorigenicity and tumor angiogenesis (12, 13, 16–19), suggesting a tumor suppressor function in vivo. To test this hypothesis, we have generated a TGFBI-null mouse model. The results demonstrated, for the first time, that TGFBI loss promotes cell proliferation through aberrant activation of CREB-cyclin D1 pathway and predisposes mice to spontaneous tumor development.
Materials and Methods
Generation of TGFBI null mice
The TGFBI locus was PCR-cloned using a genomic 129 DNA as template. Linearized targeting vector DNA (70 µg) was electroporated into 129Sv/Ev ES cells. Heterozygous targeting ES cells were identified by Southern Blot and two different targeted clones were microinjected into C57BL/6J blastocytes. Chimerical male mice were produced and mated with C57BL/6J females. Germ-line transmission of the targeted TGFBI allele was verified by Southern blot analysis of tail DNA from F1 offspring. All mice studied for spontaneous tumor development were the F2 generation of 129Sv/Ev×C57BL/6J crosses. Mice were genotyped by Southern analysis and PCR (primers and conditions available on request). Detailed necropsy and histology are described in the section of Supplementary Information. Protocols were approved by the Animal Care and Use Committee (IACUC) of the Columbia University. Animal procedures were conducted in compliance with IACUC.
Cell cycle analysis
For S-phase re-entry experiment, confluence-arrested cells were plated at 2 × 10⁶ cells per 100 mm dish in medium containing 0.1% serum for 24 h before adding medium containing 10% serum. Following serum stimulation, cells were pulsed with BrdU for one hour at end of the time point and analyzed by FITC-BrdU Flow kit (BD Pharmingen).
Tumor cohorts and carcinogen treatment
For the DMBA-treated cohort, 3–5-day old mice were topically treated with 50 µl of 0.5% DMBA in acetone (Sigma) and monitored for up to 6 months. Mice were visually examined weekly and were killed if any individual tumor reached a diameter of 5 mm, or at the termination of the experiments. Skin tumors will be counted, excised and examined by staining with hematoxylin and eosin.
ChIP analysis
Chromatin Immunoprecipitation (ChIP) assays were carried out as previously described (20), and detected with quantitative PCR (Roter-Gene RG-3000A) (21). Primers for mouse cyclin D1 gene were 5′-CCGGCTTTGATCTCTGCTTA-3′ (forward) and 5′-CGCGGAGTCTGTAGCTCTCT-3′ (reverse). Primers used for negative control were 5′-AGGTGGAGAAACACCACCAC-3′ (forward) and 5′- CGGTTTGCCCAAGAAAAATA-3′ (reverse).
Luciferase activity assay and constructs
MEFs were transiently co-transfected with luciferase reporter and dominant negative plasmid. Forty eight hour later, relative luciferase activity was determined by Dural Luciferase Activity Kit (Promega). Relative luciferase activity was normalized to concentration of cell lyates. The relative-fold induction or suppression represents the relative intensity of the experimental sample divided by the relative intensity of the medium control.
RT-PCR method and primers
The expression of cyclin D1 gene was analyzed by quantitative real-time RT-PCR (Applied Biosystems 7300) using the procedures described previously (14). The primer sets are as following: 5’TCGTGGCCTCTAAGATGAAG3’ and 5’TTTTGGAGAGGAAGTGTTCG for mouse cyclin D1; 5’AAGGTCATCCCAGAGCTGAA3’ and 5’CTGCTTCACCACCTTCTTGA 3’ for mouse GAPDH.
To verify the deletion of exons 4–6 in TGFBI−/− MEFs, a pair of oligonucleotide primers specific for the upstream and downstream regions of exons 4–6 was designed. The primer sequences: Upstream: 5’CTCATGCGACTGCTGACCCTCGCTCTG(55–81); Downstream: 5’CAGCACACATGGCTGACTTCAGG ATGTG (973–1000)]. cDNAs, synthesized from the total RNAs of WT and TGFBI−/− MEFs, were used as the templates for PCR amplification. Using this approach, a 945 bp of PCR product was detected in WT, whereas a 475 bp of PCR product was identified in TGFBI−/− MEFs due to the deletion of exons 4–6.
Antibodies and recombinant mouse TGFBI protein
Antibodies used in western blots include mouse monoclonal cyclin D1 (Santa Cruz), rabbit phospho-CREB (ser 133) mAB (Cell Signalings), mouse β-actin mAB (Sigma), anti-CD3 (T cell marker) and anti-CD45R/B220 (B-cell marker) (BD Pharmingen). Rat anti-mouse TGFBI mAB and Mouse recombinant TGFBI protein was purchased from R&D systems.
Results
Tumor development in mice lacking TGFBI gene
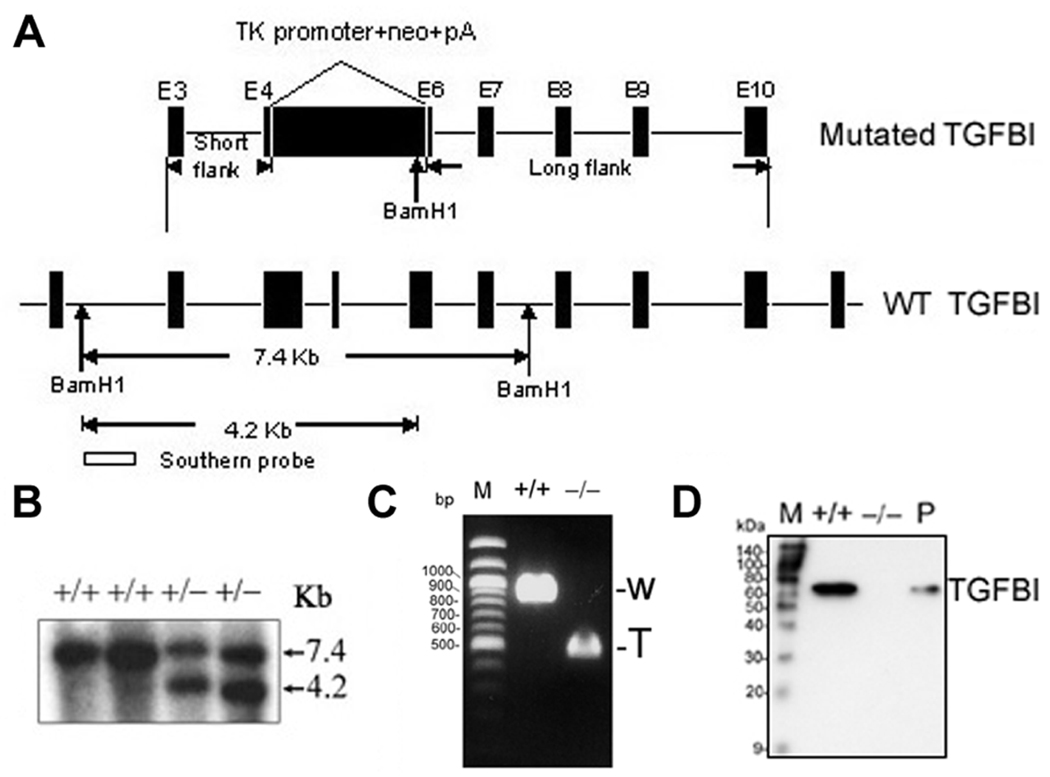
To explore the physiological function of TGFBI and its role in tumorigenesis, TGFBI-deficient mice were generated by homologous recombination. The correct targeting resulted in the replacement of exons 4–6 of TGFBI gene in mice with a neomycin-resistance gene (Fig. 1A) and was identified by Southern analysis (Fig. 1B). TGFBI−/− MEFs still expressed TGFBI mRNA but the level was about six-fold lower than in wild type MEFs (data not shown). Moreover, deletion of exons 4–6 in TGFBI−/− MEFs was demonstrated by RT-PCR (Fig. 1C), and absence of TGFBI protein was revealed by Western blot (Fig. 1D).
Figure 1. Targeted disruption of TGFBI in mice.
(A) Strategy for generating the targeted TGFBI allele. Exons 4–6 were replaced by neomycin-resistance cassette (neo) with introduction of one BamH1 restriction site at 3’ terminal. Targeting construct and wild type allele are shown. Successful targeting will yield a 4.2 kb BamH1-restricted fragment in the neo allele. (B) Germinal transmission of the targeted TGFBI allele was identified by Southern blot. (C) Identification of deletion of exons 4–6 in KO MEFs by RT-PCR using a pair of primers specific for the upstream and downstream regions of exons 4–6. W: wild type; T: truncated. (D) Western blot of conditioned medium prepared from MEFs with indicated genotypic backgrounds. Mouse TGFBI recombinant protein was used as positive control (P).
TGFBI−/− mice arose from crosses of TGFBI+/− mice at expected Mendelian frequency and showed a slower postnatal development with a 13.5 ± 3% lower body weight than that of sex-matched TGFBI+/+ littermates from 2- to 6-month age (n=10) (Supplementary Fig. S1). Histological surveys of liver, lung, kidney, stomach, intestine and testis (n=10 per genotype, age 26 weeks) did not reveal morphological abnormalities. However, 2/10 TGFBI−/− mice showed splenomegaly that was identified as B cell hyperplasia (Supplementary Fig. S2).
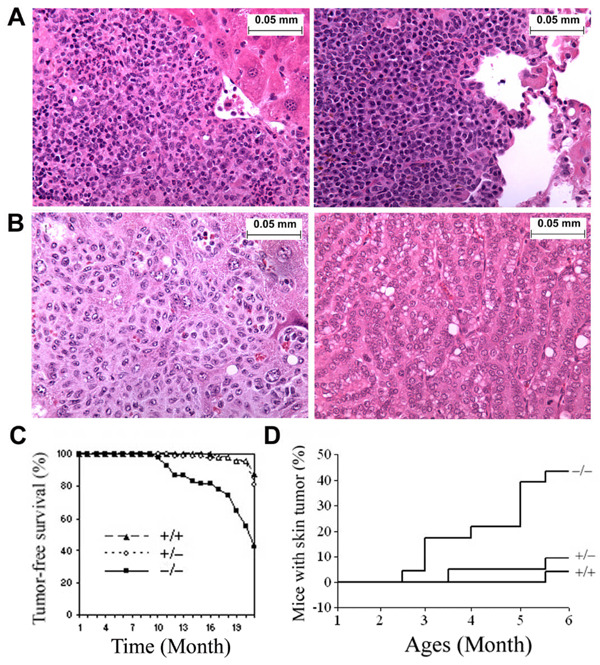
To assess the tumor-suppressor activity of TGFBI in vivo, a large cohort of TGFBI−/− (n=54), TGFBI+/− (n=75) and TGFBI+/+ (n=48) animals generated from crosses of TGFBI+/− mice were observed for the development of spontaneous malignancies for up to 20 months. Mice were sacrificed for complete necropsies either at earlier time due to clinical features of systemic illness (weight loss, inactivity, ruffling of fur, and hunched posture) or when reaching end of the observation period. From ages of 9 to16 months, over 20% of TGFBI−/− mice died of systemic illness, whereas all TGFBI+/+ mice were still alive. To determine the cause of death, the moribund TGFBI−/− mice between ages of 9 and 16 months were sacrificed and subjected to detailed histopathological analysis. Four out of 12 mice developed malignancies including one invasive lung adenocarcinoma and three lymphomas, one of which was a highly-disseminated lymphoma infiltrating liver and lung tissues (Fig. 2A). Others died of unidentified causes with no detectable tumors. Survival of heterozygotes was similar as TGFBI+/+ mice, and only one died at the end of 16 months without detectable tumor burden. By the end of 20 months, 8.3% (4/48, lung adenocarcinoma and lymphoma) of TGFBI+/+ mice, 13.3% (10/75, uterus histiocytic sarcoma, hepatocellular carcinoma, lymphoma and lung adenocarcinoma) of heterozygotes, and 37.04% (20/54) of TGFBI−/− mice had developed tumors (Fig. 2B, Supplementary Table 1, P<0.01 for TGFBI−/− versus heterozygotes and TGFBI+/+ mice, χ2 test). The tumor incidence in heterozygotes is higher than in wild type mice, but didn’t reach statistical significance (P>.05, χ2 test). Southern blot-based genotyping analysis showed that the second wild type allele of TGFBI gene was retained in all the ten tumors derived from heterozygous mice. However, 3/10 tumors displayed a dense methylation pattern in the TGFBI promoter identified by bisulfite sequencing (Supplementary Fig. S3). Tumor-free survival in TGFBI−/− mice was significantly lower than in heterozygote and TGFBI+/+ mice (P<0.01, log-rank test, Fig. 2C).
Figure 2. TGFBI−/− mice showed an increased tumor incidence.
(A) Images of Low grade lymphoma in Live (left panel) and Lung (right panel). (B) Image of metastasized tumor in liver (left panel) and lung adenocarcinoma (right panel). Magnification of images (A–B): ×400. (C) Tumor-free survival of TGFBI−/− mice compared with wild type and heterozygots. (D) Incidence of DMBA-induced skin tumors in wild type and TGFBI−/− mice.
An increased skin tumor induction in mice with TGFBI deficiency
In skin carcinogenesis assays, we treated TGFBI+/+, TGFBI+/− and TGFBI−/− mice with a single dose of DMBA, a chemical carcinogen, on the dorsal skin 3–5 d after birth. The treated mice were checked weekly and monitored for up to six months. Ten of 23 TGFBI−/− mice developed skin tumors by 2.5- to 6-month age, two of which formed skin tumors at multiple sites. In contrast, only 2 out of 21 TGFBI+/− mice and 1 out of 25 TGFBI+/+ mice developed tumors during 6-month of observation period. Skin tumor incidence in TGFBI−/− mice was significantly higher (P<0.01, χ2 test) than in TGFBI+/+ and heterozygous mice (Fig. 2D). Therefore, mice with TGFBI deficiency are prone to the development of both spontaneous malignancies and DMBA-induced skin tumors.
Early passage (P2) of TGFBI−/− MEFs exhibits an increased frequency of chromosomal aberrations
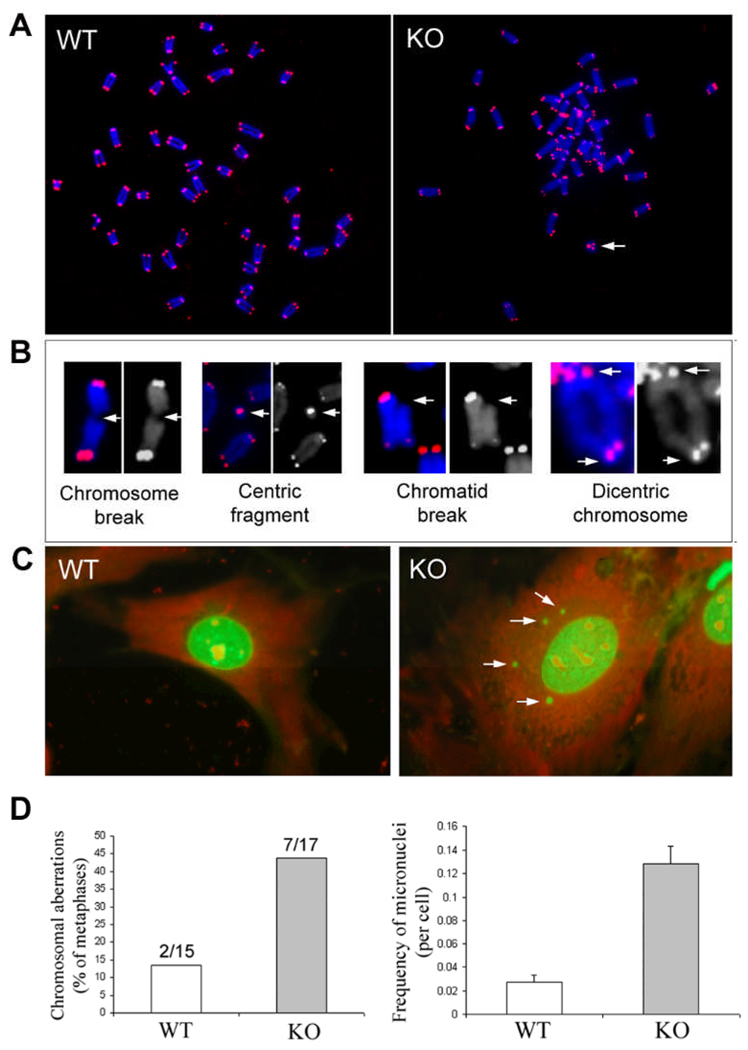
To clarify whether disruption of TGFBI resulted in an increased frequency of chromosomal aberrations, TGFBI−/− and wild type MEFs at passage 2 were treated with 0.05 µg/ml colcemid for 3–6 h. Chromosomal metaphases were prepared from the treated cells, hybridized with cy3-conjugated (C3TA2)3 peptide nucleic acid (PNA) probe (Applied Biosystems) and counterstained with DAPI solution followed the previously reported procedures (22). Digital images were recorded using Zeiss Axioplan 2 microscope with a multicolor image analysis system (Fig. 3A). Various types of chromosomal aberrations in TGFBI−/− MEFs were shown in Fig. 3B (Arrows). Overall, 43.75% (7/17) of metaphases prepared from TGFBI−/− MEFs contained chromatid breaks, centric fragments or chromosomal breaks, whereas only 13.3% (2/15) metaphases from wild type MEFs contained only centric fragments (Fig. 3D).
Figure 3. Increased frequency of chromosomal aberrations and micronuclei in early passage (P2) of TGFBI−/− MEFs.
(A) Digital images of Cy-3 (identify telomeres) and DAPI (identify chromosomes)-stained chromosomal metaphases in wild type and TGFBI KO MEFs. Arrow: centric ring. (B) Various types of chromosomal aberrations (Arrows) found in KO MEFs. (C) Multiple micronuclei (Arrows) identified in KO MEFs. (D) Frequency of chromosomal aberrations and micronuclei in wild type and TGFBI−/− MEFs.
In addition, frequency of micronuclei was also examined in the early passage of MEFs (P2). Twenty four hours post plating, cells were fixed with Acetone/ Methanol (1:1) for 10 mins and stained with 0.03 mg/ml acridine orange in dark for 10 mins. A total of 3000 cells were counted for each experiment and three independent assays were performed. Numbers of micronuclei were recorded in each cell type using Nikon Fluorescence microscope. Figure 3C showed multiple micronuclei found in TGFBI−/− MEFs (Arrows). Micronuclei frequency in TGFBI−/− MEFs was 4.7 fold higher than that in wild type MEFs, with 0.128 and 0.027 micronuclei per cell, respectively (Fig. 3D).
An accelerated G1-S progression and cyclin D1 upregulation in TGFBI−/− MEFs (passage 18)
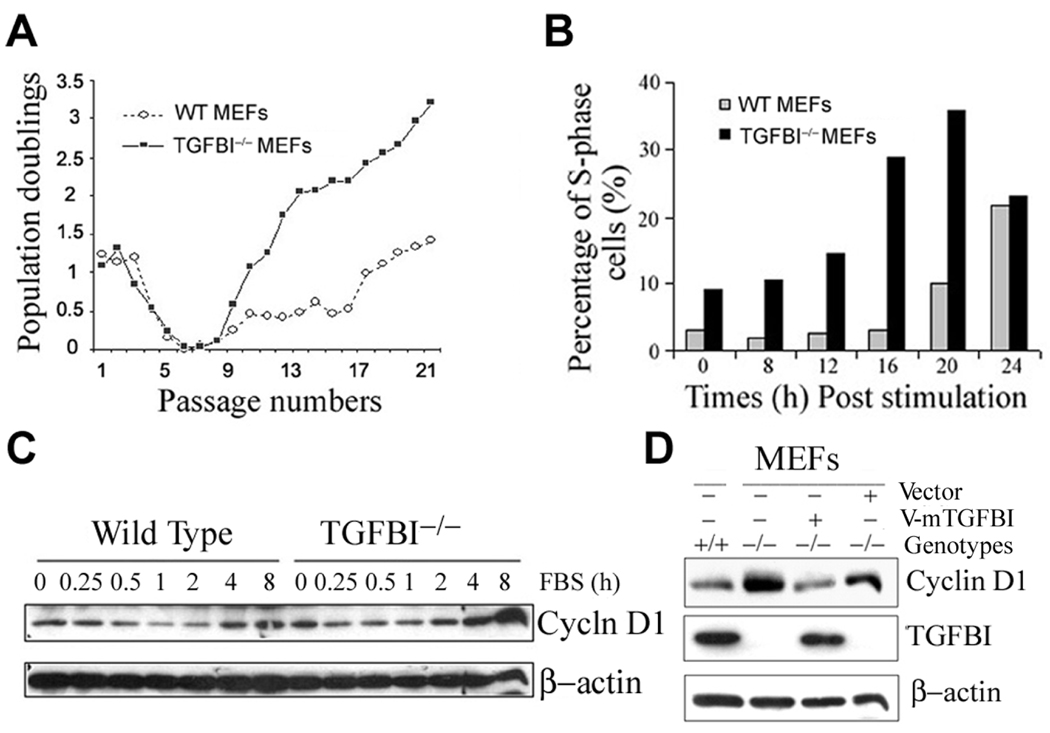
To investigate molecular mechanism(s) of tumorigenesis, we characterized mouse embryonic fibroblasts (MEFs) derived from TGFBI−/− and TGFBI+/+ littermates. Long term in vitro growth of MEFs was assayed by a 3T3 protocol. TGFBI−/− MEFs showed a higher growth at early passage (P2), but grew significantly faster than TGFBI+/+ MEFs after overcoming the senescence (Fig. 4A). This prompted a comparison of the kinetics of S-phase entry in serum-stimulated quiescent cells. Using BrdU incorporation assay, quiescent TGFBI−/− MEFs were consistently found to enter into S phase in advance of TGFBI+/+ MEFs upon serum stimulation (Fig. 4B).
Figure 4. Characterization of growth property and cyclin D1 expression in TGFBI-null MEFs.
(A) Cell proliferation on a 3T3 protocol. MEFs were isolated from 13.5-d embryos, and grown at 5% CO2 in DMEM (Invitrogen) supplemented with 10% FCS. For 3T3 protocol, 9 ×10⁵ cells were plated into 10cm-dish and cell numbers were counted at 3 days interval. At least three independent lines per genotype with two independent cultures per line were examined. (B) Kinetics of S-phase entry upon serum stimulation of quiescent TGFBI−/− and wild type MEFs. (C) Cyclin D1 induction in serum-stimulated quiescent TGFBI−/− and wild type MEFs determined by Western blots. (D) Western blots result of cyclin D1 level in exponentially-grown MEFs with TGFBI−/− and wild type backgrounds, and in TGFBI−/− MEFs after reconstitution of TGFBI by infection with retroviral V-mTGFBI vectors (pMSCV-mTGFBI).
We then examined the expression patterns of proteins related to G1-S progression. Cyclin D1 was identified to be significantly upregulated in TGFBI−/− MEFs (Supplementary Fig. S4). Moreover, cyclin D1 induction was substantially higher in quiescent TGFBI−/− MEFs at 4 h post serum stimulation relative to TGFBI+/+ cells (Fig. 4C). However, TGFBI reconstitution in TGFBI−/− MEFs by infection with retroviral vector containing wild type TGFBI gene resulted in a marked suppression of cyclin D1 expression (Fig. 4D) and subsequent inhibition of cell growth measured by BrdU incorporation (Supplementary Fig. S4).
Aberrant activation of CREB and an increased binding activity of p-CREB to cyclin D1 promoter in the absence of TGFBI in TGFBI−/− MEFs (Passage 18)
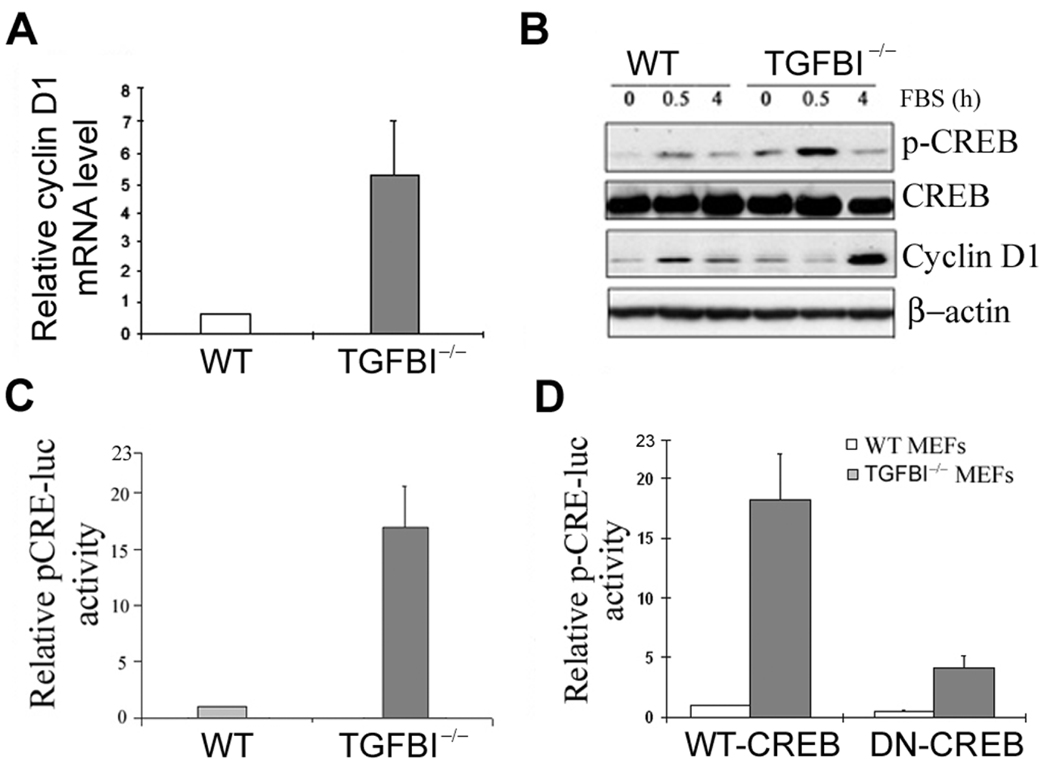
A transcriptional mechanism appears to be involved in cyclin D1 upregulation since TGFBI−/− MEFs showed a 5.6-fold higher level of cyclin D1 mRNA than wild type cells (Fig. 5A). Cyclin D1 promoter region contains several established or potential binding sites for the transcriptional factors (23). Thus, induction of transcription factors were examined by Western blots in quiescent wild type and TGFBI−/− MEFs in response to serum stimulation. Only CREB was identified to be aberrantly activated in TGFBI−/− cells (Fig. 5B), which is further substantiated by a luciferase reporter assay showing that relative pCRE promoter activity in TGFBI−/− cells was over 15-fold higher than wild type cells; however, it can be suppressed significantly by a dominant negative CREB (DN-CREB) vector (Fig. 5C, D).
Figure 5. Aberrant activation of CREB in TGFBI−/− MEFs.
(A) mRNA level of cyclin D1 in TGFBI−/− and wild type MEFs determined by real time RT-PCR. (B) Levels of p-CREB and cyclin D1 in serum-stimulated wild type and TGFBI−/− MEFs examined by Western blots. (C) Relative pCRE-luc activity in wild type and TGFBI−/− MEFs. (D) Relative pCRE-luc activity in wild type and TGFBI−/− MEFs after co-transfection of pCRE-luc with WT-CREB or DN-CREB vectors.
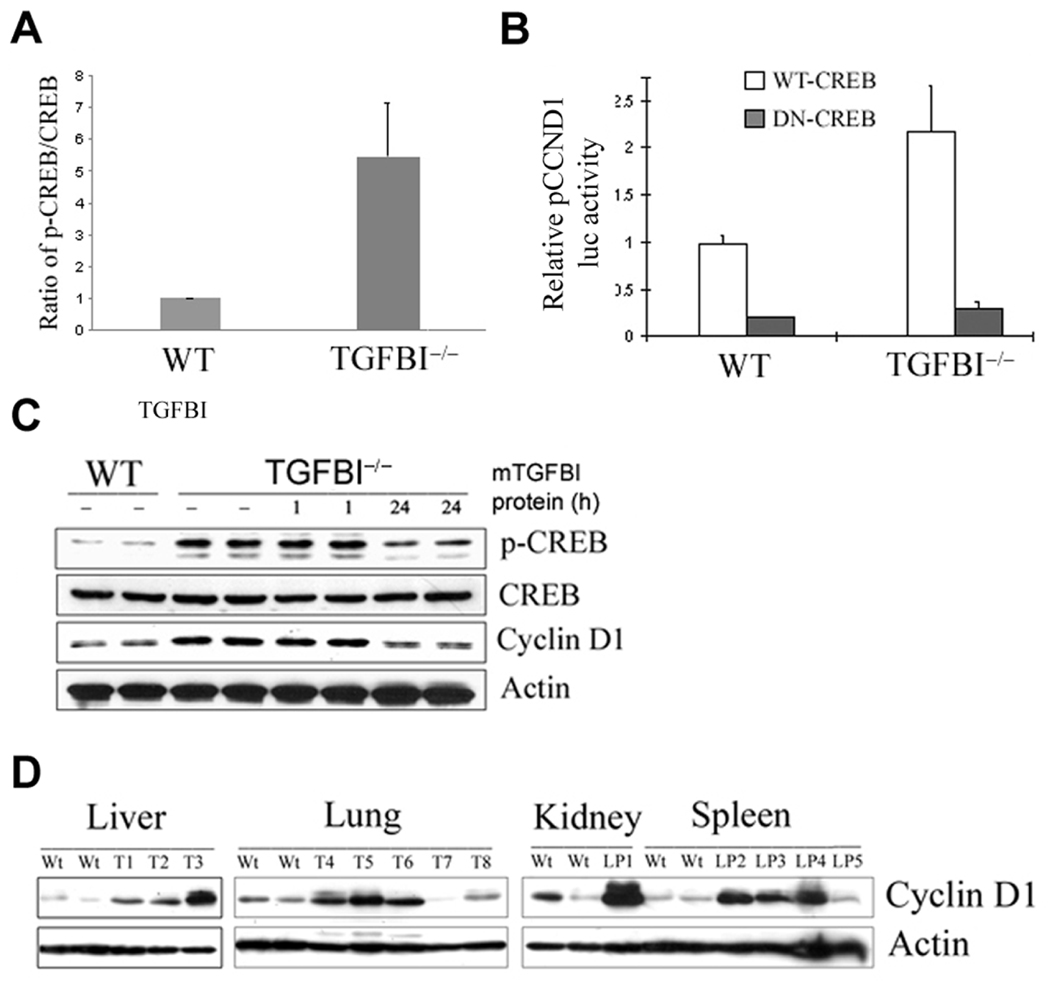
To determine whether aberrant activation of CREB in TGFBI−/− cells results in an enhanced binding activity of p-CREB to cyclin D1 promoter, a quantitative PCR-based ChIP assay was used to quantify the bindings of CREB and p-CREB to cyclin D1 promoter in both wild type and TGFBI−/− cells. As shown in Fig. 6A, ratio of p-CREB/CREB binding to cyclin D1 promoter is over five-fold higher in TGFBI−/− cells than in wild type cells, suggesting that binding activity of p-CREB to cyclin D1 is significantly increased in TGFBI−/− cells.
Figure 6. Correlation between CREB activation and cyclin D1 upregulation in TGFBI−/− MEFs.
(A) Ratio of pCREB/CREB binding to cyclin D1 promoter region quantified by a quantitative PCR-based ChIP assay. (B) Significant suppression of relative pCCND1 promoter luciferase activity in TGFBI−/− MEFs after cotransfection of pCCND1 promoter with wild type CREB or dominant negative CREB vectors. (C) Suppression of CREB phosphorylation and cyclin D1 expression in TGFBI−/− cells after incubation with recombinant mouse TGFBI protein at 0.5 µg/ml for 24 h. (D) Western blot results of cyclin D1 protein level in tumor tissues arising from TGFBI−/− mice compared to the tissues from wild type littermates. Wt: wild type; T: tumors; LP: lymphoma.
TGFBI deficiency correlates with CREB activation and leads to cyclin D1 upregulation
To determine whether CREB activation is responsible for cyclin D1 upregulation in TGFBI−/− cells (passage 18), a luciferase assay was used to examine the specific suppression of cyclin D1 promoter activity by dominant negative CREB. The cyclin D1 promoter activity in TGFBI−/− cells was over ten-fold higher than in wild type cells (data not shown); however, it could be inhibited to the similar level of wild type cells by DN-CREB (Fig. 6B). This data clearly suggested that CREB activation is involved in cyclin D1 upregulation in TGFBI-null cells.
Correlation between TGFBI deficiency and CREB activation was further established by reconstitution of TGFBI expression TGFBI−/− cells. Compared to wild type cells, TGFBI−/− cells showed a significantly higher level of p-CREB and cyclin D1, whereas it could be suppressed to the level of wild type cells after supplement with recombinant mouse TGFBI protein in the culture medium at 0.5 µg/ml for 24 hour (Fig. 6C).
Cyclin D1 upregulation in tumors arising from TGFBI−/− mice
To define the potential significance of cyclin D1 upregulation in in vivo tumor development, cyclin D1 protein level was examined by Western blotting in tumor tissues arising from TGFBI−/− mice. A markedly increased level of cyclin D1 protein was demonstrated in most (10/13) of tumor samples examined in relative to their matched wild type controls (Fig. 6D).
Discussion
TGFBI gene has been regionally mapped to chromosome 5q31, a locus often deleted in leukemias, myelodysplastic syndromes and many human cancers such as renal cell, esophageal and lung carcinomas (24–26). In addition, lost expression or downregulation of this gene has been found in a list of human tumor cell lines as well as in primary human lung and breast cancer specimens (11–14). Specifically, TGFBI downregulation has been causally linked to an enhanced tumorigenicity and tumor angiogenesis by in vitro studies (12, 13, 18, 19). However, it is not clear whether TGFBI possesses anti-tumor function in vivo. To this aim, TGFBI-null mice have been generated. The results showed that mice with TGFBI disruption are prone to spontaneous tumors as well as DMBA-induced skin tumors. The most common tumors arising spontaneously in TGFBI−/− mice were lymphomas (65.0%, 13/20). Other tumor types were lung papillary adenocarcinoma, skin invasive adenocarcinoma, liver histiocytic sarcoma and testis hemangioendothelioma, which are less common in aged 129Sv/Ev, C56BL/6J mice. Compared with the tumors occurred in TGFBI+/+ and heterozygous mice, spontaneous tumors arisen from TGFBI−/− mice demonstrated metastatic potential: (i) seven out of 13 lymphomas were classified as low grade types with infiltration to other non-lymphoid organs including liver, lung, kidney and pancreas; (ii) four out of 6 other types of tumors were either invasive or metastatic malignancies; (iii) one TGFBI−/− mouse developed both invasive lung adenocarcinoma and lymphoproliferative disorder. Hence, TGFBI disruption resulted in a dramatic predisposition to lymphomas and other cancers.
Cell cycle progression through the G1 phase requires dual signaling from soluble growth factors and adhesion to the ECM (27). Both RTK (receptor tyrosine kinase)- and intergrin-dependent proliferations are regulated through three major G1-phase targets including induction of cyclin D1, and downregulation of the cdk (cyclin–dependent kinases) inhibitors, p21cip1 and p27kip1, which lead to efficient phosphorylation of the retinoblastoma protein (Rb) and progression to S phase (27–29). Under mitogenic conditions, adhesion promotes G1 phase progression primarily via upregulation of cyclin D1 (30). Since TGFBI is an adhesion protein associated with integrin receptor through its RGD motif (8–10), it is expected that an accelerated G1-S transition in TGFBI−/− cells is due to the dysregulation of three major G1-phase targets. This is supported by our findings showing that cyclin D1 is overexpressed in TGFBI−/− cells. In contrast, TGFBI reconstitution results in a substantially decreased level of cyclin D1 expression and cellular proliferation. Furthermore, cyclin D1 protein level was demonstrated to be elevated in most of tumors isolated from TGFBI−/− mice, suggesting a critical role of cyclin D1 upregulation in in vivo tumor progression in the absence of TGFBI protein. It is well documented that cyclin D1 plays a major role in controlling G1-S progression, and is consistently upregulated in most human cancers (28, 31). Deregulated cell proliferation and increased frequency of spontaneous tumors has been found in transgenic mice with overexpression of cyclin D1, whereas deletion of cyclin D1 protects the mice from tumor induction (32–34). Collectively, these observations together with our findings suggest a critical role of cyclin D1 upregulation in the enhanced cell proliferation and tumor formation in TGFBI−/− mice. However, cyclin D2, cyclin D3, cyclin A and p21CIP1 expression was not strongly affected by loss of TGFBI, although p21CIP1 level appeared lower in TGFBI−/− MEFs.
CREB has been shown to act as an oncogene and implicated in the development of human endocrine tumors and acute myeloid leukemia (35–37). In this study, CREB was identified to be aberrantly activated after TGFBI disruption. In addition, causal links between TGFBI-deficiency and CREB activation, and cyclin D1 upregulation have been established in our model system, suggesting that signaling pathway from TGFBI to CREB/cyclin D1 is dysregulated after TGFBI disruption, and is involved in tumor progression in TGFBI−/− mice. The exact mechanisms of CREB/cyclin D1 activation downstream of TGFBI remain unknown but may include activation of one or more kinases through an integrin-dependent pathway, including FAK, AKT, PKA (Protein kinase A), PKC (protein kinase C), CaMKs (Ca2+/calmodulin-dependent protein kinase), GSK-3 (glycogen synthase kinse III), and CK II (casin kinase II) that have been shown to regulate CREB phosphorylation (35, 38). We have found that p-AKT was substantially elevated in serum-starved early passage (P2) of TGFBI−/− MEFs at 15min and 30 min post serum stimulation when compared to wild type cells (Supplementary Fig. S5). Previous studies have demonstrated that CREB can be activated by protein kinase B/Akt (38, 39), therefore, AKT pathway might mediate TGFBI-regulated CREB/cyclin D1 activation in TGFBI−/− cells.
It is commonly accepted that malignant transformation is a lengthy multi-step process and arises through an accumulation of mutations at various genetic loci (40). Genomic instability has been demonstrated to not only initiate tumorigenesis, but is at least a factor in tumor progression (40, 41). In the present study, early passage of TGFBI−/− MEFs showed a significantly-increased chromosomal aberration and micronuclei than wild type MEFs, suggesting that TGFBI deficiency induces genetic instability. This is supported by other study showing that TGFBI protein is involved in microtubule stability and silencing of its expression contributes to centrosome amplification and enhanced mitotic abnormalities (17). It is well documented that chromosomal instability, which is equated to mitotic defects and consequential chromosome segregation errors, provides a formidable basis for the acquisition of further malignant phenotype during tumor progression (42). It should be noted that 3 out of 13 tumor samples isolated from TGFBI−/− mice didn’t show cyclin D1 upregulation. Thus, other signaling pathway(s) instead of CREB/cyclin D1 activation might be aberrantly regulated due to genomic instability.
Although loss of TGFBI expression has been found in different types of primary human cancers (11–14), several studies demonstrate that TGFBI is commonly overexpressed in colorectal, renal and pancreas cancers (43–45). Also overexpression of TGFBI promotes metastasis of SW480 colon cancer cells by enhancing extravasation (45). However, we have found a significant downregulation of TGFBI in HT29 colon cancer cells (12). These data clearly point out that dysregulation of TGFBI expression is tumor cell or type-specific. It is highly possible that TGFBI is a double edged sword whose loss or gain of expression leads to tumorigenesis. Previous studies have shown that TGFBI mutations correlate with human corneal dystrophy (46). However, over-expression of mutant TGFBI induces retinal degeneration, but no corneal phenotype was observed in transgenic mice (47). Similarly, we didn’t identify any eye phenotypes in TGFBI−/− mice.
The present studies provide the evidence, for the first time, that loss of TGFBI functions as a tumor suppressor in vivo. Because of frequent loss of TGFBI protein in human cancer cells (11–14), TGFBI and its associated signaling represent the promising targets for anticancer drug discovery.
Supplementary Material
Acknowledgements
Grant support: NASA NAG2-1637 (Y. Zhao), CA127120 (Y. Zhao) and NIH ES-11804 (T.K. Hei).
We thank Drs. Ze’ev A. Ronai, Howard B. Lieberman, and Dangsheng Li for critical reading, and Dr. M.R. Montminy (San Diego, CA) for kindly providing WT CREB and dominant negative CREB expression plasmids, and Dr. Isabella Screpanti (University La Sapienza, Rome, Italy) for Mouse cyclin D1 luciferase reporter plasmid.
References
- 1.Tlsty TD. Cell-adhesion-dependent influences on genomic instability and carcinogenesis. Curr Opin Cell Biol. 1998;10:647–653. doi: 10.1016/s0955-0674(98)80041-0. [DOI] [PubMed] [Google Scholar]
- 2.Giancotti FG, Ruoslahti E. Integrin signaling. Science. 1999;285:1028–1032. doi: 10.1126/science.285.5430.1028. [DOI] [PubMed] [Google Scholar]
- 3.Danen EH. Integrins: regulators of tissue function and cancer progression. Curr Pharm Des. 2005;11:881–891. doi: 10.2174/1381612053381756. [DOI] [PubMed] [Google Scholar]
- 4.Ramsay AG, Marshall JF, Hart IR. Integrin trafficking and its role in cancer metastasis. Cancer Metastasis Rev. 2007;26:567–578. doi: 10.1007/s10555-007-9078-7. [DOI] [PubMed] [Google Scholar]
- 5.Skonier J, Neubauer M, Madisen L, Bennett K, Plowman GD, Purchio AF. cDNA cloning and sequence analysis of beta ig-h3, a novel gene induced in a human adenocarcinoma cell line after treatment with transforming growth factor-beta. DNA Cell Biol. 1992;11:511–522. doi: 10.1089/dna.1992.11.511. [DOI] [PubMed] [Google Scholar]
- 6.LeBaron RG, Bezverkov KI, Zimber MP, Pavelec R, Skonier J, Purchio AF. Beta IG-H3, a novel secretory protein inducible by transforming growth factor-beta, is present in normal skin and promotes the adhesion and spreading of dermal fibroblasts in vitro. J Invest Dermatol. 1995;104:844–849. doi: 10.1111/1523-1747.ep12607024. [DOI] [PubMed] [Google Scholar]
- 7.Billings PC, Herrick DJ, Kucich U, et al. Extracellular matrix and nuclear localization of beta ig-h3 in human bladder smooth muscle and fibroblast cells. J Cell Biochem. 2000;79:261–273. doi: 10.1002/1097-4644(20001101)79:2<261::aid-jcb90>3.0.co;2-#. [DOI] [PubMed] [Google Scholar]
- 8.Kim JE, Jeong HW, Nam JO, et al. Identification of motifs in the fasciclin domains of the transforming growth factor-beta-induced matrix protein betaig-h3 that interact with the alphavbeta5 integrin. J Biol Chem. 2002;277:46159–46165. doi: 10.1074/jbc.M207055200. [DOI] [PubMed] [Google Scholar]
- 9.Nam JO, Kim JE, Jeong HW, et al. Identification of the alphavbeta3 integrin-interacting motif of betaig-h3 and its anti-angiogenic effect. J Biol Chem. 2003;278:25902–25909. doi: 10.1074/jbc.M300358200. [DOI] [PubMed] [Google Scholar]
- 10.Jeong HW, Kim IS. TGF-beta1 enhances betaig-h3-mediated keratinocyte cell migration through the alpha3beta1 integrin and PI3K. J Cell Biochem. 2004;92:770–780. doi: 10.1002/jcb.20110. [DOI] [PubMed] [Google Scholar]
- 11.Genini M, Schwalbe P, Scholl FA, Schafer BW. Isolation of genes differentially expressed in human primary myoblasts and embryonal rhabdomyosarcoma. Int J Cancer. 1996;66:571–577. doi: 10.1002/(SICI)1097-0215(19960516)66:4<571::AID-IJC24>3.0.CO;2-9. [DOI] [PubMed] [Google Scholar]
- 12.Zhao YL, Piao CQ, Hei TK. Downregulation of Betaig-h3 gene is causally linked to tumorigenic phenotype in asbestos treated immortalized human bronchial epithelial cells. Oncogene. 2002;2:7471–7477. doi: 10.1038/sj.onc.1205891. [DOI] [PubMed] [Google Scholar]
- 13.Zhao Y, El-Gabry M, Hei TK. Loss of Betaig-h3 protein is frequent in primary lung carcinoma and related to tumorigenic phenotype in lung cancer cells. Mol Carcinog. 2006;45:84–92. doi: 10.1002/mc.20167. [DOI] [PubMed] [Google Scholar]
- 14.Calaf G, Echiburu-Chau C, Zhao YL, Hei TK. Bigh3 protein expression as a marker for breast cancer. Int J Mol Med. 2008;21:561–568. [PubMed] [Google Scholar]
- 15.Shao G, Berenguer J, Borczuk AC, Powell CA, Hei TK, Zhao Y. Epigenetic inactivation of Betaig-h3 gene in human cancer cells. Cancer Res. 2006;66:4566–4573. doi: 10.1158/0008-5472.CAN-05-2130. [DOI] [PubMed] [Google Scholar]
- 16.Thapa N, Lee BH, Kim IS. TGFBIp/betaig-h3 protein: a versatile matrix molecule induced by TGF-beta. Int J Biochem Cell Biol. 2007;39:2183–2194. doi: 10.1016/j.biocel.2007.06.004. [DOI] [PubMed] [Google Scholar]
- 17.Ahmed AA, Mills AD, Ibrahim AE, et al. The extracellular matrix protein induces microtubule stabilization and sensitizes ovarian cancers to paclitaxel. Cancer Cell. 2007;12:514–527. doi: 10.1016/j.ccr.2007.11.014. [DOI] [PMC free article] [PubMed] [Google Scholar]
- 18.Nam JO, Jeong HW, Lee BH, Park RW, Kim IS. Regulation of tumor angiogenesis by fastatin, the fourth FAS1 domain of betaig-h3, via alphavbeta3 integrin. Cancer Res. 2005;65:4153–4161. doi: 10.1158/0008-5472.CAN-04-2705. [DOI] [PubMed] [Google Scholar]
- 19.Becker J, Volland S, Noskova I, Schramm A, Schweigerer LL, Wilting J. Keratoepithelin reverts the suppression of tissue factor pathway inhibitor 2 by MYCN in human neuroblastoma: a mechanism to inhibit invasion. Int J Oncol. 2008;32:235–240. [PubMed] [Google Scholar]
- 20.Kuo MH, Allis CD. In vivo cross-linking and immunoprecipitation for studying dynamic Protein:DNA associations in a chromatin environment. Methods. 1999;19:425–433. doi: 10.1006/meth.1999.0879. [DOI] [PubMed] [Google Scholar]
- 21.Li ZY, Yang J, Gao X, et al. Sequential recruitment of PCAF and BRG1 contributes to myogenin activation in 12-O-tetradecanoylphorbol-13-acetate-induced early differentiation of rhabdomyosarcoma-derived cells. J Biol Chem. 2007;282:18872–18878. doi: 10.1074/jbc.M609448200. [DOI] [PubMed] [Google Scholar]
- 22.Zijlmans JM, Martens UM, Poon SS, et al. Telomeres in the mouse have large inter-chromosomal variations in the number of T2AG3 repeats. Proc Natl Acad Sci U S A. 1997;94:7423–7428. doi: 10.1073/pnas.94.14.7423. [DOI] [PMC free article] [PubMed] [Google Scholar]
- 23.Eto I. Molecular cloning and sequence analysis of the promoter region of mouse cyclin D1 gene: implication in phorbol ester-induced tumour promotion. Cell Prolif. 2000;33:167–187. doi: 10.1046/j.1365-2184.2000.00176.x. [DOI] [PMC free article] [PubMed] [Google Scholar]
- 24.Peralta RC, Casson AG, Wang RN, Keshavjee S, Redston M, Bapat B. Distinct regions of frequent loss of heterozygosity of chromosome 5p and 5q in human esophageal cancer. Int J Cancer. 1998;78:600–605. doi: 10.1002/(sici)1097-0215(19981123)78:5<600::aid-ijc12>3.0.co;2-1. [DOI] [PubMed] [Google Scholar]
- 25.Wu X, Zhao Y, Kemp BL, Amos CI, Siciliano MJ, Spitz MR. Chromosome 5 aberrations and genetic predisposition to lung cancer. Int J Cancer. 1998;79:490–493. doi: 10.1002/(sici)1097-0215(19981023)79:5<490::aid-ijc8>3.0.co;2-w. [DOI] [PubMed] [Google Scholar]
- 26.Brezinova J, Zemanova Z, Cermak J, Michalova K. Fluorescence in situ hybridization confirmation of 5q deletions in patients with hematological malignancies. Cancer Genet Cytogenet. 2000;117:45–49. doi: 10.1016/s0165-4608(99)00142-9. [DOI] [PubMed] [Google Scholar]
- 27.Assoian RK. Anchorage-dependent cell cycle progression. J Cell Biol. 1997;136:1–4. doi: 10.1083/jcb.136.1.1. [DOI] [PMC free article] [PubMed] [Google Scholar]
- 28.Sherr CJ, Roberts JM. CDK inhibitors: positive and negative regulators of G1-phase progression. Genes Dev. 1999;13:1501–1512. doi: 10.1101/gad.13.12.1501. [DOI] [PubMed] [Google Scholar]
- 29.Walker JL, Assoian RK. Integrin-dependent signal transduction regulating cyclin D1 expression and G1 phase cell cycle progression. Cancer Metastasis Rev. 2005;24:383–393. doi: 10.1007/s10555-005-5130-7. [DOI] [PubMed] [Google Scholar]
- 30.Welsh CF. Rho GTPases as key transducers of proliferative signals in g1 cell cycle regulation. Breast Cancer Res Treat. 2004;84:33–42. doi: 10.1023/B:BREA.0000018425.31633.07. [DOI] [PubMed] [Google Scholar]
- 31.Hunter T, Pines J. Cyclins and cancer. II: Cyclin D and CDK inhibitors come of age. Cell. 1994;79:573–582. doi: 10.1016/0092-8674(94)90543-6. [DOI] [PubMed] [Google Scholar]
- 32.Wang TC, Cardiff RD, Zukerberg L, Lees E, Arnold A, Schmidt EV. Mammary hyperplasia and carcinoma in MMTV-cyclin D1 transgenic mice. Nature. 1994;369:669–671. doi: 10.1038/369669a0. [DOI] [PubMed] [Google Scholar]
- 33.Robles AI, Rodriguez-Puebla ML, Glick AB, et al. Reduced skin tumor development in cyclin D1-deficient mice highlights the oncogenic ras pathway in vivo. Genes Dev. 1998;12:2469–2474. doi: 10.1101/gad.12.16.2469. [DOI] [PMC free article] [PubMed] [Google Scholar]
- 34.Yu Q, Geng Y, Sicinski P. Specific protection against breast cancers by cyclin D1 ablation. Nature. 2001;411:1017–1021. doi: 10.1038/35082500. [DOI] [PubMed] [Google Scholar]
- 35.Shaywitz AJ, Greenberg ME. CREB: a stimulus-induced transcription factor activated by a diverse array of extracellular signals. Annu Rev Biochem. 1999;68:821–861. doi: 10.1146/annurev.biochem.68.1.821. [DOI] [PubMed] [Google Scholar]
- 36.Rosenberg D, Groussin L, Jullian E, Perlemoine K, Bertagna X, Bertherat J. Role of the PKA-regulated transcription factor CREB in development and tumorigenesis of endocrine tissues. Ann N Y Acad Sci. 2002;968:65–74. doi: 10.1111/j.1749-6632.2002.tb04327.x. [DOI] [PubMed] [Google Scholar]
- 37.Shankar DB, Cheng JC, Kinjo K, et al. The role of CREB as a proto-oncogene in hematopoiesis and in acute myeloid leukemia. Cancer Cell. 2005;7:351–362. doi: 10.1016/j.ccr.2005.02.018. [DOI] [PubMed] [Google Scholar]
- 38.Delghandi MP, Johannessen M, Moens U. The cAMP signalling pathway activates CREB through PKA, p38 and MSK1 in NIH 3T3 cells. Cell Signal. 2005;17:1343–1351. doi: 10.1016/j.cellsig.2005.02.003. [DOI] [PubMed] [Google Scholar]
- 39.Caravatta L, Sancilio S, di Giacomo V, Rana R, Cataldi A, Di Pietro R. PI3-K/Akt-dependent activation of cAMP-response element-binding (CREB) protein in Jurkat T leukemia cells treated with TRAIL. J Cell Physiol. 2008;214:192–200. doi: 10.1002/jcp.21186. [DOI] [PubMed] [Google Scholar]
- 40.Jefford CE, Irminger-Finger I. Mechanisms of chromosome instability in cancers. Crit Rev Oncol Hematol. 2006;59:1–14. doi: 10.1016/j.critrevonc.2006.02.005. [DOI] [PubMed] [Google Scholar]
- 41.Nowak MA, Komarova NL, Sengupta A, et al. The role of chromosomal instability in tumor initiation. Proc Natl Acad Sci U S A. 2002;99:16226–16231. doi: 10.1073/pnas.202617399. [DOI] [PMC free article] [PubMed] [Google Scholar]
- 42.Fukasawa K. Oncogenes and tumour suppressors take on centrosomes. Nat Rev Cancer. 2007;7:911–924. doi: 10.1038/nrc2249. [DOI] [PubMed] [Google Scholar]
- 43.Schneider D, Kleeff J, Berberat PO, et al. Induction and expression of betaig-h3 in pancreatic cancer cells. Biochim Biophys Acta. 2002;1588:1–6. doi: 10.1016/s0925-4439(02)00052-2. 1. [DOI] [PubMed] [Google Scholar]
- 44.Ivanov SV, Ivanova AV, Salnikow K, Timofeeva O, Subramaniam M, Lerman MI. Two novel VHL targets, TGFBI (BIGH3) and its transactivator KLF10, are up-regulated in renal clear cell carcinoma and other tumors. Biochem Biophys Res Commun. 2008;370:536–540. doi: 10.1016/j.bbrc.2008.03.066. [DOI] [PMC free article] [PubMed] [Google Scholar]
- 45.Ma C, Rong Y, Radiloff DR, et al. Extracellular matrix protein betaig-h3/TGFBI promotes metastasis of colon cancer by enhancing cell extravasation. Genes Dev. 2008;22:308–321. doi: 10.1101/gad.1632008. [DOI] [PMC free article] [PubMed] [Google Scholar]
- 46.Kannabiran C, Klintworth GK. TGFBI gene mutations in corneal dystrophies. Hum Mutat. 2006;27:615–625. doi: 10.1002/humu.20334. [DOI] [PubMed] [Google Scholar]
- 47.Bustamante M, Tasinato A, Maurer F, et al. Overexpression of a mutant form of TGFBI/BIGH3 induces retinal degeneration in transgenic mice. Mol Vis. 2008;14:1129–1137. [PMC free article] [PubMed] [Google Scholar]
Associated Data
This section collects any data citations, data availability statements, or supplementary materials included in this article.


