Abstract
To assess the role of dopamine input to the nucleus accumbens core in anticipatory learning, fast-scan cyclic voltammetry was combined with appetitive Pavlovian conditioning. One group of rats (Paired) received 16 tone-food pairings for at least four daily sessions while the control group (Unpaired) received the same number of unpaired tone and food presentations. Both groups showed transient dopamine responses during food presentation throughout training, confirming dopamine involvement in reward processing. Only the Paired Group, however, showed consistently timed dopamine transients during the 10-s tone presentation. Transients first appeared near the end of the tone period as each animal acquired the tone-food association and then occurred progressively sooner on subsequent sessions. Later sessions also revealed a consistently timed dopamine response soon after food delivery in Paired animals. Collectively, these results implicate phasic dopamine release in the acquisition of Pavlovian learning and also suggest an early dopamine response to the unconditioned stimulus as training continues.
Keywords: dopamine transients, nucleus accumbens core, Pavlovian conditioning, voltammetry
Traditionally, dopamine (DA) has been implicated in the unconditional reinforcing effects of food, sex, and drugs (Wise, 1978, 1982). In recent years, however, this view of DA has been challenged (Horvitz, 2000; Ikemoto & Panksepp, 1999; Salamone, Cousins, & Snyder, 1997). Most evidence now suggests that rather than mediate the unconditional effects of reward (e.g., the hedonia hypothesis), DA is involved in anticipation of reward and/or behavioral activation (Ikemoto & Panksepp, 1999) and/or the selection of appropriate action-outcome routines (Redgrave & Gurney, 2006).
Evidence for DA involvement in reward anticipation comes primarily from electrophysiological studies. Recording the activity of presumed DA neurons in the ventral tegmental area (VTA), the main source of mesolimbic DA, has revealed that, although these cells are responsive to delivery of the unconditioned stimulus (US) and not the conditioned stimulus (CS) at the outset of learning, they increase firing to the CS and inhibit firing to the US over the course of training (Mirenowicz & Schultz, 1994, 1996). Thus, DA neurons appear to shift their firing to the cue, which presumably enables the anticipation of the US. The temporal convergence of reward prediction with cue presentation is consistent with several temporal difference (TD) models of learning. According to these models, prediction errors are propagated back to the earliest relevant cue or time point (Schultz, Dayan & Montague, 1997; Sutton & Barto, 1981). The temporal shift, therefore, can be explained by weakening the emphasis on time points proximal to reward, while strengthening the emphasis on those farther from the reward but closer to the cue. Collectively, these findings led to the error-signaling hypothesis, which states that changes in DA release are correlated with the amount of learning taking place in a given CS–US pairing as first described in the Rescorla-Wagner model of learning (Rescorla & Wagner, 1972).
Although data on DA electrophysiology provide support for DA in the learning of associations, it is not clear if the change in DA firing corresponds to a change in DA release. One line of research showed that DA release in various mesolimbic targets increases upon presentation of a CS paired with a US (Bassareo & Di Chiara, 1999; Cheng, de Bruin, & Feenstra, 2003; Datla, Ahier, Young, Gray, & Joseph, 2002), implicating DA release in anticipation of reward. This research, however, is based on microdialysis, a procedure known to have relatively poor spatial (probe diameter ≥200 μm) and temporal resolution (≥10 min). In fact, with dialysates collected over intervals of several minutes, it is impossible to know if an increase in DA release is due to the reinforcer itself or the CS. These studies, moreover, inserted microdialysis probes after learning had already taken place, making it impossible to obtain information on the role of DA in acquiring the CS–US association.
Unlike microdialysis, fast-scan cyclic voltammetry (FSCV) permits detection of monoamines at a small diameter probe (≤10 μm) with subsecond temporal resolution (Heien & Wightman, 2006). This technology has been used in behavioral studies to characterize the extracellular dynamics of electrically evoked DA release (Garris, Christensen, Rebec & Wightman, 1997) and to assess DA function in rats attending to novelty (Rebec, Christensen, Guerra, & Bardo, 1997), responding to conspecifics (Robinson et al., 2001), and lever-pressing for rewards (Phillips, Stuber, Heien, Wightman, & Carelli, 2003). In this report, we used FSCV to investigate whether DA release occurs to a CS during acquisition of the CS-US association. We focused on the nucleus accumbens core (NAc) because CS-related increases in DA release have been previously reported for this region (Bassareo & Di Chiara, 1999; Cheng et al., 2003; Datla et al., 2002; Robinson et al., 2001; Roitman, Stuber, Phillips, Wightman, & Carelli, 2004). A related goal was to determine whether a temporal shift occurs in the release of DA during the CS as predicted by TD models.
Method
Subjects
Nine, male Sprague-Dawley rats (350–450 g) bred from source animals supplied by Harlan Industries (Indianapolis, IN) were obtained from the departmental colony. Subjects were housed in a temperature- and humidity-controlled colony room on a 12-h light–dark cycle (lights on at 07:30). All animals were tested during the light cycle (10:00–16:00).
Apparatus
Rats were placed in a locally constructed, transparent operant box housed inside an electrically grounded Faraday cage. The operant box (12 × 12 × 16 cm) included a hard-plastic food cup that protruded 4.5 cm into the box. Infrared photocells located inside the food cup allowed the detection of food-cup entries as the rats broke the photo beams in anticipation of the US. The food cup was located 4.5 cm above the glass-rod floor. A 10-s duration tone (1,900 Hz and 70 dB) served as the CS, which was delivered through a speaker located on the wall opposite the food cup.
Surgery
In preparation for subsequent FSCV, rats were anesthetized with ketamine (80 mg/kg, i.m.) and xylazine (10 mg/kg, i.m.). After the skull was exposed, a hole was drilled 1.3 mm anterior and 1.3 mm lateral to bregma to permit access to the NAc (Paxinos & Watson, 1998). A hub, designed to mate with a locally constructed microdrive assembly on the recording day, was cemented over the hole, which was sealed with a rubber septum. Another hole, ipsilateral and 2 mm posterior to the previous one, was made for the reference electrode, and a hub with rubber septum was cemented over the second hole as well.
Two animals also were equipped with a bipolar stimulating electrode (0.2-mm-diameter tips separated by 1 mm; Plastics One, Roanoke, VA) in the medial forebrain bundle (MFB), −4.1 anterior and +1.4 lateral to bregma and 8–9 mm ventral from the surface of the skull (Paxinos & Watson, 1998).
Pavlovian Conditioning
After at least a week of postsurgery recovery, animals were food deprived to 85% of their ad lib body weight.
Feeder training
Each rat was first placed in the chamber and allowed to eat 0.45 mg food pellets (Noyes High Precision) delivered two at a time (0.2 s interval) into the food cup at irregular periods (10 s to 80 s) for 20 min. Rats typically received 30–40 food pellets.
Acquisition
On the following day, the working electrode was lowered into the NAc and Pavlovian acquisition sessions continued for 4–5 consecutive days. Animals were separated into two groups. For the Paired Group, each daily session included 16 CS–US pairings (trials). Food pellets were delivered at the offset of the tone permitting the animal to acquire the CS–US association. The Unpaired Group (i.e., the control group) received the tone presentations and food pellets separated by a variable interval of 180 to 300 s (mean of 240 s), which prevented the formation of an effective CS–US association. Both groups received an equal number of tone presentations and food pellets.
Data analysis
The number of food cup entries during the 10-s period prior to CS (i.e., the pre-CS period) was subtracted from the number of food cup entries during the CS to calculate an elevation score, which was used as an index of learning (e.g., Bouton & Sunsay, 2003; Holland, 1979). One rat in the Paired group did not acquire conditioning (mean elevation scores over the sessions were −0.38, 0.125, −0.125, and 0 elevation scores, respectively) and thus was excluded from further analysis. When needed, we assessed learning within a session by averaging the elevation score over the last 3 or 4 trials and tested it against 0 by a one-sample t test. A two-way, repeated-measures analysis of variance (ANOVA) was used to determine statistical significance of the group elevation scores across sessions. The analysis was considered significant if the p value was less than the 0.05 chance level.
Fast-Scan Cyclic Voltammetry
Procedure
An untreated (Thornel P-55) carbon fiber (10 μm in diameter), which served as the working electrode, was sealed in a pulled-glass capillary (132–196 μm exposed tip) according to standard procedures (Rebec et al., 1997). The electrode was first tested in citrate-phosphate buffer with 100 nM DA versus saturated calomel reference. Cyclic voltammograms, recorded in conjunction with a two-electrode potentiostat under computer control, were obtained every 100 ms at a scan rate of 400 V s−1 (−0.4 to +1.2). On each recording day, a freshly prepared working electrode was inserted into the microdrive for lowering into the target site for in vivo voltammetry. Target depth was increased ~0.1 mm each day to avoid multiple recordings from the same site. An Ag/AgCl wire inserted into the second hub overlying cortex ipsilateral to the working electrode served as the reference.
After the final recording day, animals equipped for MFB stimulation were again anesthetized and an electrical current (60 Hz, peak-to-peak, 250 μA magnitude and 2-s duration) was applied to the MFB and a working electrode in NAc recorded voltammograms. MFB stimulation elicits transient DA release in NAc and other targets of mesolimbic DA (Garris & Rebec, 2002); voltammograms elicited by this known mechanism of DA release were used in conjunction with regression analysis to verify the DA nature of the voltammetric signal obtained during Pavlovian conditioning.
Data Analysis
Where appropriate, data are expressed as mean ± SEM oxidation current based on background-subtracted cyclic voltammograms similar to previous work (Garris et al., 1997; Rebec et al., 1997). Each voltammogram in an ongoing data-collection file was subtracted from the average of the voltammograms collected 0.5 s earlier. Background-subtracted voltammograms obtained during conditioning sessions were subsequently compared by regression analysis to the average background-subtracted voltammogram recorded during MFB stimulation and to that recorded during in vitro DA testing (Stuber, Roitman, Phillips, Carelli & Wightman, 2005). Only voltammograms having r2 > 0.8 were identified as DA. Oxidation and reduction were recorded as positive and negative currents, respectively. Data analysis focused on peak increases in oxidation current that were at least two standard deviations above the values recorded over the three immediately preceding scans. Peak increases >16% above baseline were routinely identified as DA. We also calculated peak latency from the time of CS onset to determine if the peak shifted in time over the course of learning. If more than one peak occurred, the latency calculation was based on the first peak. Peak latency was evaluated by means of a one-way, repeated-measures ANOVA. The analysis was considered significant if the p value was less than the 0.05 chance level.
Histology
To mark the recording site, animals were deeply anesthetized after the last session, and current was applied to the carbon fiber to make a small lesion. This step allowed us to identify electrode placement on the last day and to confirm that more dorsal sites recorded on previous days (see above) were also confined to NAc. After transcardial perfusion with formalin, the brain was removed and subsequently frozen, sectioned, and stained with cresyl violet for histological analysis.
Results
Behavior
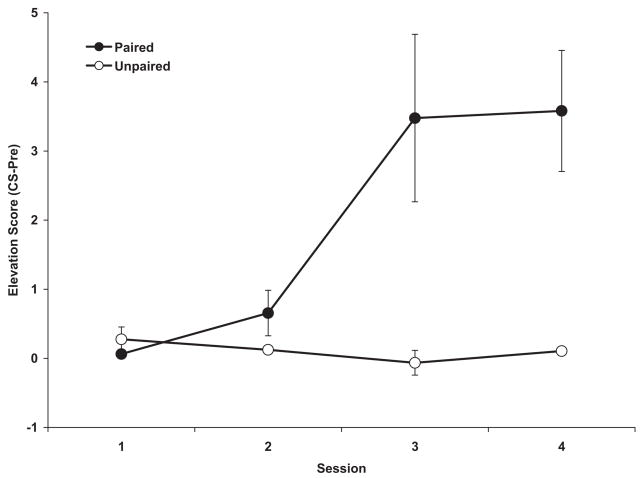
As shown in Figure 1, the Paired Group (n =4) responded with a progressive increase in elevation score that was not evident in the Unpaired Group (n =4). An ANOVA revealed a significant Group difference, F(1, 6) =7.07, indicating that only the Paired Group showed Pavlovian learning. Thus, unlike the Unpaired Group, which searched the food cup equally often during the pre-CS and CS periods, Paired animals began to anticipate delivery of the US by increasing food cup searches during the 10-s presentation of the CS. A 2-by-4 repeated measures ANOVA revealed a significant Session effect, F(3, 18) =7.61, and a significant Group-by-Session interaction, F(3, 18) =9.19. Pairwise comparisons indicated that the groups differed reliably on the last 2 conditioning sessions, which indicates that the CS-US association was acquired by Session 3. The trend toward an increase among these rats in Session 2 reflects acquisition by the fastest learners during the last few trials of this session. This was confirmed by a significant one-sample t test run against 0, t(2) = 4.91.
Figure 1.
Mean (±SEM) elevation scores (calculated as the number of food cup entries in the pre-CS period subtracted from the number of food cup entries in the CS period) for each session for the Paired and Unpaired Groups. * indicates statistically significant difference between groups. For some data points, ±SEM is too small to appear. Note the rise in the Paired Group indicating learning.
We also analyzed the number of food cup entries during the pre-CS period and did not find a reliable group difference, F(1, 6) <1, ruling out a decrease in pre-CS responding as the basis for an increase in elevation score.
Voltammetry
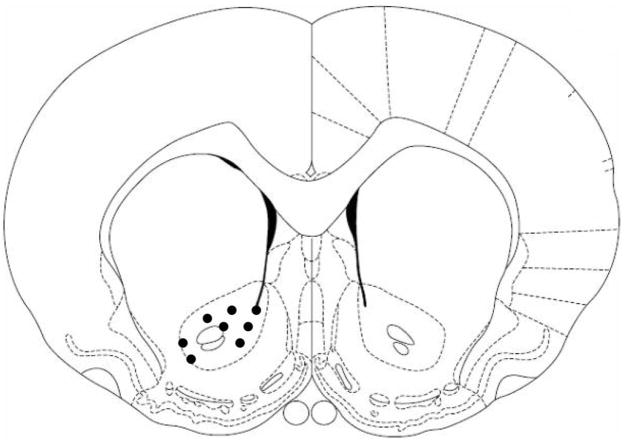
Voltammetric signals were recorded during every trial of each session, and data were analyzed for DA transients, the identity of which was confirmed by in vitro testing and by subsequent recording during MFB stimulation. The CS and US periods for each session were assessed separately. Subsequent histological analysis revealed that all 8 electrode placements, identified on the last day of recording, were confined to the NAc as shown schematically in Figure 2.
Figure 2.
Schematic depiction of electrode placements (filled circles) compiled for display in a coronal section of NAc shown at 1.20 mm anterior to bregma according to Paxinos and Watson (1998). Placements in all tested animals were marked on the last day of recording and subsequently verified by histological analysis. From The Rat Brain in Stereotaxic Coordinates (4th ed.; Fig. 35), By G. Paxinos and C. Watson, 1998, San Diego, CA: Academic Press. Adapted with permission.
Presentation of the CS
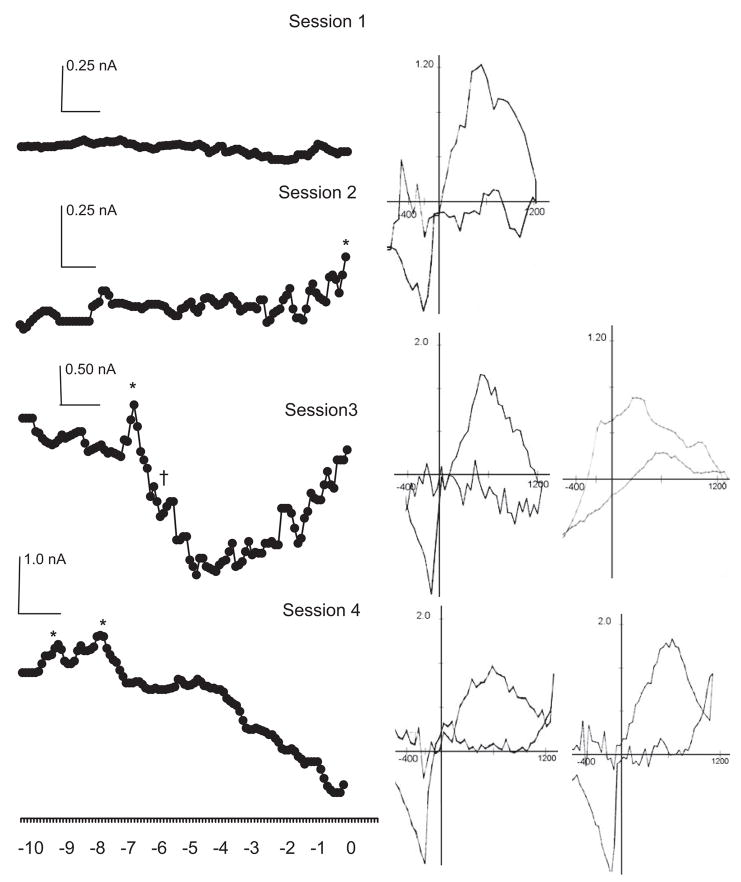
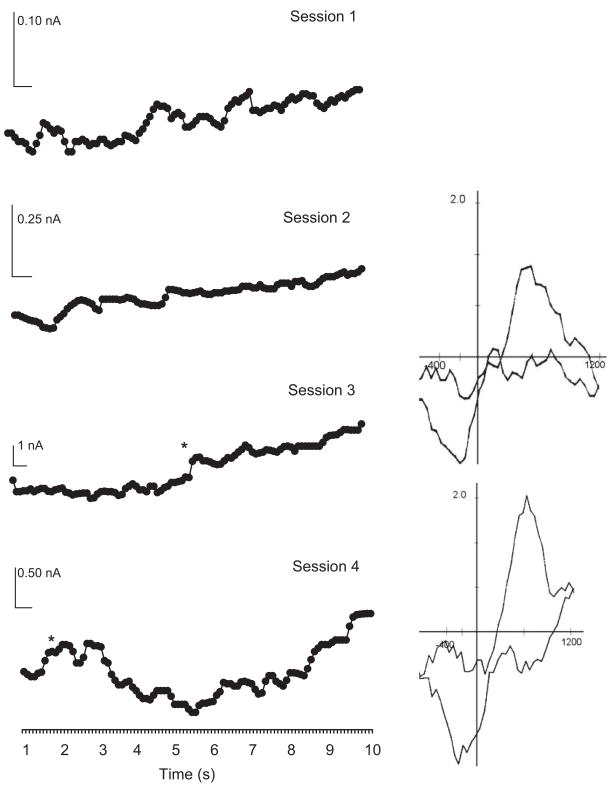
In Session 1, when animals showed no sign of behavioral learning, presentation of the CS failed to elicit a consistent voltammetric response. No DA transients were identified across trials in either group. In fact, apart from some spontaneous locomotion and random entries into the food cup, animals in both the Paired and Unpaired Groups typically remained quiet and unresponsive. As training continued, transient increases in DA oxidation current were observed during CS presentation in the second, third, and fourth conditioning sessions but only in the Paired Group. Figure 3 shows the time course of the voltammetric signal for DA oxidation recorded from a representative animal in the Paired Group and averaged across all trials for each session. Note the emergence in this animal of a DA oxidation peak at the end of the CS period in Session 2. Analysis of individual trials during this session revealed that although there was no evidence for a DA transient in the first few (5–10) trials, the DA response began to appear in later trials and accounted for the late CS-related DA peak. In Sessions 3 and 4, the peak occurred progressively sooner, and in Session 4, it was followed almost immediately by a second peak. Cyclic voltammograms extracted from each peak response revealed oxidation (~+0.6 V) and reduction points (~−0.2 V) consistent with DA and confirmed by further testing (see below). In some cases, the peak response was sometimes followed by decreases in oxidation signal that persisted for several seconds, but voltammetric analysis indicated that such relatively prolonged fluctuations could not be explained by changes in DA concentration.
Figure 3.
CS-related DA transients across sessions in a Paired rat. CS presentation elicits transient peaks of DA oxidation indicated by * and confirmed by background subtracted cyclic voltammograms shown to the immediate right. The first such transient appears at the end of the CS period in Session 2 and occurs progressively earlier in subsequent sessions with 2 DA transients evident very early in Session 4. Fluctuations in oxidation current, such as the relatively prolonged decrease evident in Sessions 3 and 4, are not due to a DA change as shown by the corresponding voltammogram for † presented at the far right for Session 3. Data are averaged across 16 trials per session and presented without SEM for clarity.
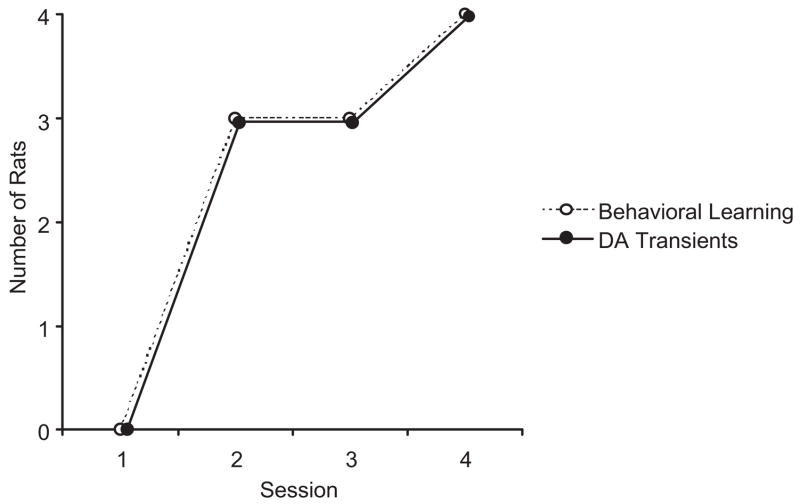
Although all Paired animals showed a CS-related DA transient, the session in which the DA response first appeared was not the same for each rat. In fact, the number of rats showing a DA transient increased across sessions until it occurred in all rats by the last session. Further analysis revealed that the session in which DA first appeared (Session 2) was also the session in which the mean performance of individual animals on the last 3 or 4 trials was significantly above 0. The relationship between learning and DA transients is depicted in Figure 4.
Figure 4.
Number of Paired rats showing a CS-related DA oxidation peak and evidence of behavioral learning across all training sessions. Learning was confirmed by a mean elevation score significantly above 0 as determined by a one-sample t-test (see “Methods”). Rats that show the earliest learning also are the first to show a DA transient until all rats (n =4) show learning and a DA response by Session 4.
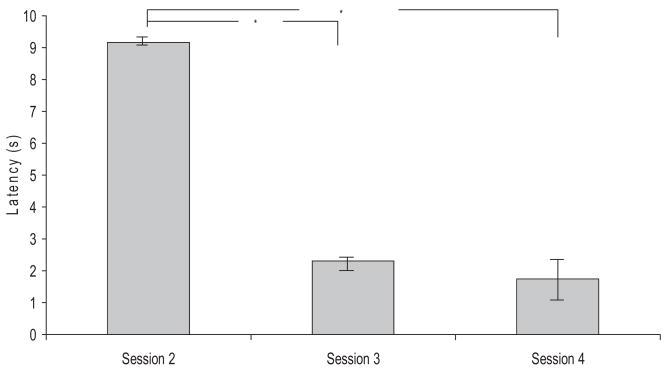
For those animals showing a CS-related DA transient across multiple sessions, an assessment of when it occurred relative to CS onset revealed a progressive decrease in latency with each day of training. These data are shown in Figure 5, and a repeated-measures ANOVA revealed that the shift in latency was highly significant, F(2, 4) = 17.09.
Figure 5.
Latency of the DA oxidation peak from time of CS onset in Paired animals that showed learning across Sessions 2, 3 and 4. Latency was determined from the time of CS onset. Analysis was limited to peaks ≥16%, which were voltammetrically identified as DA. * p<.05 compared to Session 2. Note the significant decrease in latency after Session 2.
Presentation of the US
When food pellets became available during the 10-s US period, animals in both groups obtained food from the food cup. Because food retrieval occurred at different times in the Unpaired Group throughout training, it was not possible to construct a meaningful time course of the voltammetric response even across all the trials of a single session. This also was the case for Paired animals in Sessions 1 and 2. Analysis of the final two sessions, however, revealed DA transients in conjunction with food access in the Paired Group. Examples of such peaks along with corresponding voltammograms are shown in Figure 6. Thus, food availability can elicit DA transients even in animals that show a DA response during the CS.
Figure 6.
DA transients during the US period as they occurred in Sessions 3 and 4 of a Paired rat. DA transients are indicated by * and confirmed by corresponding background subtracted voltammograms shown at right. The DA transient in Session 3 occurred several seconds sooner in Session 4, paralleling the earlier time during the US period that the animal consistently checked the food cup. Data are averaged across 16 trials per session and presented without SEM for clarity.
DA verification
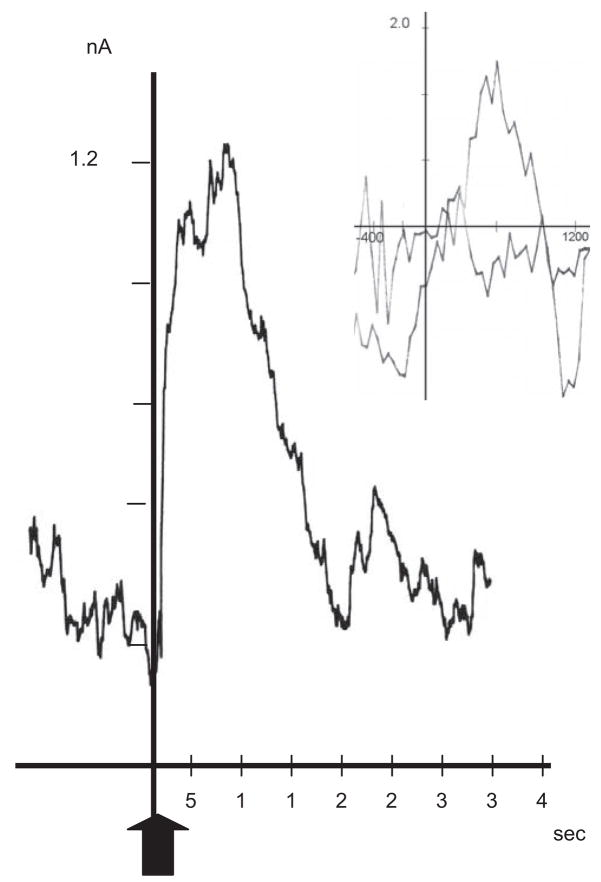
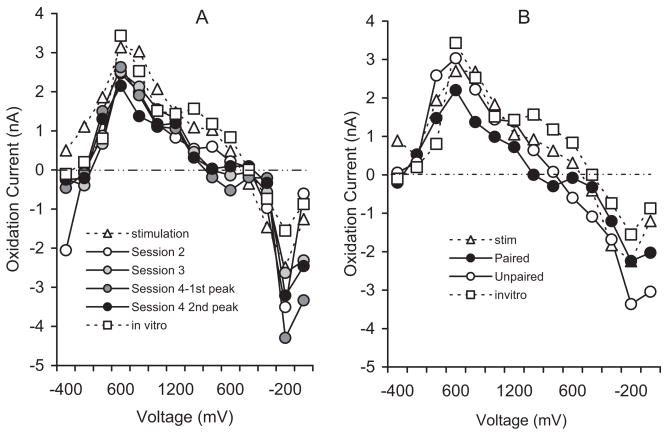
The bulk of DA input to NAc arises from the VTA via the MFB. To confirm that DA release transients occur in NAc and that their identity matches that of the transients recorded during behavioral testing, we used regression analysis (Phillips et al., 2003; Stuber et al., 2005) to compare the corresponding voltammograms. We also included voltammograms obtained in vitro by the addition of 100 nM DA to citrate-phosphate buffer during electrode testing. Consistent with previous results (Garris et al., 1997), MFB stimulation evoked an oxidation signal that peaked almost immediately after stimulation offset and declined rapidly to baseline. A representative example is shown in Figure 7. In vitro testing yielded a similar transient response as reported previously (Rebec et al., 1997). As shown in Figure 8A, analysis of peak voltammograms from the CS in the Paired Group found them to be comparable to the voltammograms elicited by MFB stimulation and by DA in vitro (r2 =0.92, p<.05). Similar results (r2 =0.97, p<.05) emerged from an analysis of peak voltammograms obtained during the US period in both the Paired and Unpaired Groups (Figure 8B). Voltammograms not resembling DA were not correlated with the voltammetric signal induced by MFB stimulation or in vitro testing (r2 =0.59, p>.05).
Figure 7.
Representative example of a transient DA oxidation signal elicited by MFB stimulation. Arrow indicates onset of 2 s stimulation. Scale bars indicate 1 nA (vertical) and 5 s (horizontal). Inset: background subtracted cyclic voltammogram obtained at the peak of the response.
Figure 8.
Comparison of mean voltammograms recorded during the conditions indicated. Note the similarity of the voltammograms obtained in vitro to 100 nM DA and to MFB stimulation to those obtained during CS presentation (A) in the sessions indicated for the Paired Group and during food presentation (B) in the Paired and Unpaired Groups.
Discussion
By combining FSCV with Pavlovian conditioning, we were able to assess learning-related changes in the time course of DA release in the NAc. Our results are not only consistent with evidence that a learned CS can increase DA transmission in this region (Young, Joseph & Gray, 1993), but also reveal that the timing of the DA response changes with learning. Beginning with the second conditioning session and continuing for each subsequent session, we found a transient increase in the DA signal in the Paired Group during CS presentation. The Unpaired Group, which showed no evidence of learning, showed no CS-related DA response. Over the course of learning, moreover, our results revealed a shift in the timing of the DA response from CS offset to CS onset. In Session 2, for example, the DA signal occurred at very end of the CS period, just as the US became available. By Sessions 3 and 4, DA was detected progressively earlier in the CS period. In fact, Session 4 revealed 2 sequential DA responses during CS presentation, both of which occurred during the first 5 s after CS onset. Multiple DA transients also have been reported in other paradigms (Stuber et al., 2005), suggesting a complex relationship between DA release and learning.
Our evidence of DA release is based on cyclic voltammograms to ensure that the oxidation signal represents DA and not interferant anions, which, like DA, are present in extracellular fluid and may change with behavior (Rebec, 2007). Thus, consistent with electron-transfer data obtained during oxidation-reduction reactions (Kawagoe, Zimmerman & Wightman, 1993), ascorbate, DOPAC, and other likely interferants generate anodic and cathodic waves distinct from those for DA (Baur, Kristensen, May, Wiedemann, & Wightman, 1988; Rebec et al., 1997). All our in vivo voltammograms matched those for DA obtained during in vitro testing. For additional confirmation of the DA signal, we evoked endogenous DA release in some animals by electrical stimulation of the MFB (Garris et al., 1997). Again, the voltammograms matched those associated with the DA transients obtained during conditioning. Although voltammetric analysis cannot distinguish DA from norepinephrine, the extent of norepinephrine input to NAc is extremely small relative to that of DA (Pickel, Towle, Joh, & Chan, 1988; Roitman et al., 2004). It also is relevant that our electrodes are at least 3 times more sensitive to DA than norepinephrine (Rebec et al., 1997), further arguing against a meaningful norepinephrine contribution to our data. Analysis of the relatively prolonged change in oxidation current that sometimes followed the DA transient, however, ruled out a DA contribution. In fact, the persistence of this change over several seconds suggests a fundamental change in extracellular fluid such as a fluctuation in pH or oxygen level (Venton, Michael, & Wightman, 2003).
Several factors make quantification of DA transients difficult. For one, the estimated basal level of extracellular DA appears to be <50 nM (Parsons & Justice, 1992), which is near the lower limit of our detection capability. In addition, because exposure to brain tissue may further impair electrode sensitivity, quantification estimates based on in vitro pretesting of our electrodes is unlikely to be reliable. Although posttest electrode calibration can sometimes be used, it is not feasible here because in many cases the electrodes were used for marking lesions to verify placement in NAc. It is interesting, however, that both the magnitude and time course of the transients we recorded during conditioning were similar to those evoked by MFB stimulation. In fact, in previous work in which posttest calibration was possible, such stimulation increased DA between 1.0 and 3.0 μmol/L depending on frequency and other stimulation parameters (Garris et al., 1997; Garris & Rebec, 2002). This information, combined with other estimates of DA concentration in behavior-related transients (see Robinson & Wightman, 2007), suggests that our DA responses reflect an extracellular level of at least 1.0 μmol/L, which is well beyond the basal level and likely to have significant functional implications.
The shift in time that characterized the CS-related DA transients over the course of learning is predicted by the TD algorithm (Sutton & Barto, 1981) and its derivatives (Schultz et al., 1997). Interesting to note, however, the timing of the conditioned response (CR) shifts in the opposite direction during acquisition. Early in conditioning, for example, CRs occur throughout the CS period, but as learning continues, CRs appear more frequently near the time of CS offset. This effect, known as inhibition of delay, has been reported since Pavlov (1927) and is well established (Rescorla, 1967). Because the timing of the DA transient and the CR move in different directions over the course of training, DA is unlikely to drive the CR, but we cannot rule out DA involvement in establishing when the CR appears in a well-trained animal.
Rats required to lever press for sucrose also have been reported to show transient increases in DA efflux in NAc during presentation of a compound (tone-light) CS (Roitman et al., 2004). In this case, however, the DA response could be explained by a learned association between lever-press behavior and sucrose rather than a CS-sucrose association. Our paradigm allowed us to focus on the CS and its relation to the US because the terminal behavior (food-cup entry) is not predictive of the reinforcer. Thus, our results strongly implicate DA in the acquisition of the CS-US association.
The relatively prolonged fluctuations in background current that occur over the course of recording cannot be explained by a change in DA concentration. In fact, inspection of relevant voltammograms showed no evidence of DA. Although the underlying mechanism is unclear, similar current fluctuations have been reported previously (Roitman et al., 2004) and may reflect a change in extracellular pH (Venton et al., 2003).
We also detected DA transients during food consumption. In the Unpaired Group and in the first two sessions of Paired training, these DA signals were not time locked to the delivery of the US, but were observed as the rats contacted and consumed the food pellets. Although this finding is consistent with the DA hypothesis of reward (Wise, 1978, 1982), alternative explanations, such as a change in arousal, cannot be ruled out. In fact, the Wightman group (Roitman et al., 2004) reported no DA efflux in response to sucrose. DA transients, however, have been observed during consummatory behavior when the reinforcer was either copulation (Robinson, Heien, & Wightman, 2002) or free-choice entry into a novel environment (Rebec et al., 1997). It is conceivable that different reinforcers are differentially effective in triggering DA release. This view is consistent with evidence that animals have reinforcer-specific expectations (Baxter & Zamble, 1982; Sherburne & Zentall, 1998; Urcuioli & DeMarse, 1996) and that neurons in orbitofrontal cortex can differentiate between reinforcers (Schultz, Tremblay, & Hollerman, 2000).
As Paired animals acquired learning, US-related DA transients began to appear consistently within a few seconds after food delivery. Of interest, the transients shifted from 3 to 4 s (Session 3) to 1 to 3 s after US delivery (Session 4). This temporal shift reflected behavior in that by Session 4 all Paired animals positioned themselves by the food cup shortly after CS onset, anticipating reward delivery. In this case, the transients were directly related to reward.
In agreement with the error-signal hypothesis of DA function, we found that DA release occurs in response to the CS over the course of learning (Schultz, 1998). This hypothesis, however, also predicts that food consumption will not activate DA neurons in well-trained animals (Mirenowicz et al., 1994, 1996), whereas we detected DA transients during the US in Paired animals. This difference could be explained by a TD model that postulates eligibility traces, which allow for a gradual weakening of the vector weights of stimuli (e.g., Pan, Schmidt, Wickens, & Hyland, 2005). It also is possible that inconsistencies between TD models may reflect differences in assessing DA function since changes in the firing rate of DA neurons, which form the basis of the error-signal hypothesis, may not be a reliable indictor of DA release owing to a wide variety of mechanisms reported to regulate DA release from axon terminals (e.g., Grace, Floresco, West, & Goto, 2004; Youngren, Daly & Moghaddam, 1993). As these reports indicate, changes in the release of glutamate or other amino acids, which are abundant in NAc core, could alter DA release independently of DA impulse activity. Although further research will be required to resolve this issue and to clarify the role of DA in learning, our results implicate mesolimbic DA in the acquisition of Pavlovian conditioning.
References
- Bassareo V, Di Chiara G. Differential responsiveness of dopamine transmission to food-stimuli in nucleus accumbens shell/core compartments. Neuroscience. 1999;89:637–641. doi: 10.1016/s0306-4522(98)00583-1. [DOI] [PubMed] [Google Scholar]
- Baur JE, Kristensen EW, May LJ, Wiedemann DJ, Wightman RM. Fast-scan voltammetry of biogenic amines. Analytical Chemistry. 1988;60:1268–1272. doi: 10.1021/ac00164a006. [DOI] [PubMed] [Google Scholar]
- Baxter DJ, Zamble E. Reinforcer and response specificity in appetitive transfer of control. Animal Learning and Behavior. 1982;10:201–210. [Google Scholar]
- Bouton ME, Sunsay C. Importance of trials versus accumulating time across trials in partially reinforced appetitive conditioning. Journal of Experimental Psychology: Animal Behavior Processes. 2003;29:62–77. [PubMed] [Google Scholar]
- Cheng JJ, de Bruin JPC, Feenstra MGP. Dopamine efflux in nucleus accumbens shell and core in response to appetitive classical conditioning. European Journal of Neuroscience. 2003;18:1306–1314. doi: 10.1046/j.1460-9568.2003.02849.x. [DOI] [PubMed] [Google Scholar]
- Datla KP, Ahier RG, Young AMJ, Gray JA, Joseph MH. Conditioned appetitive stimulus increases extracellular dopamine in the nucleus accumbens of the rat. European Journal of Neuroscience. 2002;16:1987–1993. doi: 10.1046/j.1460-9568.2002.02249.x. [DOI] [PubMed] [Google Scholar]
- Garris PA, Christensen JRC, Rebec GV, Wightman RM. Real-time measurement of electrically evoked extracellular dopamine in the striatum of freely moving rats. Journal of Neurochemistry. 1997;68:152–161. doi: 10.1046/j.1471-4159.1997.68010152.x. [DOI] [PubMed] [Google Scholar]
- Garris PA, Rebec GV. Modeling fast dopamine neurotrans-mission in the nucleus accumbens during behavior. Behavioural Brain Research. 2002;137:47–63. doi: 10.1016/s0166-4328(02)00284-x. [DOI] [PubMed] [Google Scholar]
- Grace AA, Floresco SB, West AR, Goto Y. Dissociation of tonic and phasic dopamine neuron activity by afferent pathway activation: Relationship to patterns of dopamine release. International Journal of Neuropsychopharmacology. 2004;7:S15. [Google Scholar]
- Heien MLA, Wightman RM. Phasic dopamine signaling during behavior, reward, and diseases states. CNS & Neurological Disorders-Drug Targets. 2006;5:99–108. doi: 10.2174/187152706784111605. [DOI] [PubMed] [Google Scholar]
- Holland PC. Differential effects of omission contingencies on various components of Pavlovian appetitive responding in rats. Journal of Experimental Psychology: Animal Behavior Processes. 1979;5:178–193. doi: 10.1037//0097-7403.5.2.178. [DOI] [PubMed] [Google Scholar]
- Horvitz JC. Mesolimbocortical and nigrostriatal dopamine responses to salient non-reward events. Neuroscience. 2000;96:651–656. doi: 10.1016/s0306-4522(00)00019-1. [DOI] [PubMed] [Google Scholar]
- Ikemoto S, Panksepp J. The role of nucleus accumbens dopamine in motivated behavior: A unifying interpretation with special reference to reward-seeking. Brain Research Reviews. 1999;31:6–41. doi: 10.1016/s0165-0173(99)00023-5. [DOI] [PubMed] [Google Scholar]
- Kawagoe KT, Zimmerman JB, Wightman RM. Principles of voltammetry and microelectrode states. Journal of Neuroscience Methods. 1993;48:225–240. doi: 10.1016/0165-0270(93)90094-8. [DOI] [PubMed] [Google Scholar]
- Mirenowicz J, Schultz W. Importance of unpredictability for reward responses in primate dopamine neurons. Journal of Neurophysiology. 1994;72:1024–1027. doi: 10.1152/jn.1994.72.2.1024. [DOI] [PubMed] [Google Scholar]
- Mirenowicz J, Schultz W. Preferential activation of midbrain dopamine neurons by appetitive rather than aversive stimuli. Nature. 1996;379:449–451. doi: 10.1038/379449a0. [DOI] [PubMed] [Google Scholar]
- Pan WX, Schmidt R, Wickens JR, Hyland BI. Dopamine cells respond to predicted events during classical conditioning: Evidence for eligibility traces in the reward-learning network. Journal of Neuroscience. 2005;25:6235–6242. doi: 10.1523/JNEUROSCI.1478-05.2005. [DOI] [PMC free article] [PubMed] [Google Scholar]
- Parsons LH, Justice JB., Jr Extracellular concentration and in vivo recovery of dopamine in the nucleus accumbens using microdialysis. Journal of Neurochemistry. 1992;58:212–218. doi: 10.1111/j.1471-4159.1992.tb09298.x. [DOI] [PubMed] [Google Scholar]
- Pavlov IP. Conditioned reflexes. London: Oxford University Press; 1927. [Google Scholar]
- Paxinos G, Watson C. The rat brain in stereotaxic coordinates. 4. San Diego, CA: Academic Press; 1998. [DOI] [PubMed] [Google Scholar]
- Phillips PEM, Stuber GD, Heien MLAV, Wightman RM, Carelli RM. Subsecond dopamine release promotes cocaine seeking. Nature. 2003;422:614–618. doi: 10.1038/nature01476. [DOI] [PubMed] [Google Scholar]
- Pickel VM, Towle AC, Joh TH, Chan J. Gammaami-nobutyric acid in the medial rat nucleus accumbens: Ultrastructural localization in neurons receiving monosynaptic input from catecholaminergic afferents. Journal of Comparative Neurology. 1988;272:1–14. doi: 10.1002/cne.902720102. [DOI] [PubMed] [Google Scholar]
- Rebec GV. From interferant anion to neuromodulator: Ascorbate oxidizes its way to respectability. In: Michael AC, Borland LM, editors. Electrochemical methods in neuroscience. Boca Raton, FL: Taylor & Francis Group, CRC Press; 2007. pp. 149–165. [PubMed] [Google Scholar]
- Rebec GV, Christensen JRC, Guerra C, Bardo MT. Regional and temporal differences in real-time dopamine efflux in the nucleus accumbens during free-choice novelty. Brain Research. 1997;776:61–67. doi: 10.1016/s0006-8993(97)01004-4. [DOI] [PubMed] [Google Scholar]
- Redgrave P, Gurney K. The short-latency dopamine signal in discovering novel actions. Nature Reviews Neuroscience. 2006;7:967–974. doi: 10.1038/nrn2022. [DOI] [PubMed] [Google Scholar]
- Rescorla RA. Inhibition of delay in Pavlovian fear conditioning. Journal of Comparative and Physiological Psychology. 1967;64:114–120. doi: 10.1037/h0024810. [DOI] [PubMed] [Google Scholar]
- Rescorla RA, Wagner AR. A theory of Pavlovian conditioning: Variations in the effectiveness of reinforcement and nonreinforcement. In: Black AH, Prokasy WF, editors. Classical conditioning II: Current research and theory. New York: Appleton-Century-Crofts; 1972. pp. 64–99. [Google Scholar]
- Robinson DL, Heien MLAV, Wightman RM. Frequency of dopamine concentration transients increases in dorsal and ventral striatum of male rats during introduction of conspecifics. The Journal of Neuroscience. 2002;22:10477–10486. doi: 10.1523/JNEUROSCI.22-23-10477.2002. [DOI] [PMC free article] [PubMed] [Google Scholar]
- Robinson DL, Phillips PEM, Budygin EA, Traftin BJ, Garris PA, Wightman RM. Sub-second changes in accumbal dopamine during sexual behavior in male rats. NeuroReport. 2001;12:2549–2552. doi: 10.1097/00001756-200108080-00051. [DOI] [PubMed] [Google Scholar]
- Robinson DL, Wightman RM. Rapid dopamine release in freely moving rats. In: Michael AC, Borland LM, editors. Electrochemical methods for neuroscience. Boca Raton, FL: CRC Press; 2007. [PubMed] [Google Scholar]
- Roitman MF, Stuber GD, Phillips PEM, Wightman RM, Carelli RM. Dopamine operates as a subsecond modulator of food seeking. The Journal of Neuroscience. 2004;24:1265–1271. doi: 10.1523/JNEUROSCI.3823-03.2004. [DOI] [PMC free article] [PubMed] [Google Scholar]
- Salamone JD, Cousins MS, Snyder BJ. Behavioral functions of nucleus accumbens dopamine: Empirical and conceptual problems with the anhedonia hypothesis. Neuroscience and Biobehavioral Reviews. 1997;21:341–359. doi: 10.1016/s0149-7634(96)00017-6. [DOI] [PubMed] [Google Scholar]
- Schultz W. Predictive reward signal of dopamine neurons. Journal of Neurophysiology. 1998;80:1–27. doi: 10.1152/jn.1998.80.1.1. [DOI] [PubMed] [Google Scholar]
- Schultz W, Dayan P, Montague PR. A neural substrate of prediction and reward. Science. 1997;275:1593–1599. doi: 10.1126/science.275.5306.1593. [DOI] [PubMed] [Google Scholar]
- Schultz W, Tremblay L, Hollerman JR. Reward prediction in primate basal ganglia and frontal cortex. Neuropharmacology. 2000;37:421–429. doi: 10.1016/s0028-3908(98)00071-9. [DOI] [PubMed] [Google Scholar]
- Sherburne LM, Zentall TR. The differential outcomes effect in pigeons is not reduced by eliminating response-outcome associations: Support for a two-process account. Animal Learning and Behavior. 1998;26:378–387. [Google Scholar]
- Stuber GD, Wightman RM, Carelli RM. Extinction of cocaine self-administration reveals functionally and temporally distinct dopaminergic signals in the nucleus accumbens. Neuron. 2005;46:661–669. doi: 10.1016/j.neuron.2005.04.036. [DOI] [PubMed] [Google Scholar]
- Sutton RS, Barto AG. Toward a modern theory of adaptive networks: Expectation and prediction. Psychological Review. 1981;88:135–170. [PubMed] [Google Scholar]
- Urcuioli PJ, DeMarse TB. Associative processes in differential outcome discriminations. Journal of Experimental Psychology: Animal Behavior Processes. 1996;22:192–204. [Google Scholar]
- Venton BJ, Michael DJ, Wightman RM. Correlation of local changes in extracellular oxygen and pH that accompany dopaminergic terminal activity in the rat caudate-putamen. Journal of Neurochemistry. 2003;84:373–381. doi: 10.1046/j.1471-4159.2003.01527.x. [DOI] [PubMed] [Google Scholar]
- Wise RA. Catecholamine theories of reward: A critical review. Brain Research. 1978;152:215–247. doi: 10.1016/0006-8993(78)90253-6. [DOI] [PubMed] [Google Scholar]
- Wise RA. Neuroleptics and operant behavior: The anhedonia hypothesis. Behavioral Brain Sciences. 1982;5:39–87. [Google Scholar]
- Young AMJ, Joseph MH, Gray JA. Latent inhibition of conditioned dopamine release in rat nucleus accumbens. Neuroscience. 1993;54:5–9. doi: 10.1016/0306-4522(93)90378-s. [DOI] [PubMed] [Google Scholar]
- Youngren KD, Daly DA, Moghaddam B. Distinct action of endogenous excitatory amino acids on the outflow of dopamine in the nucleus accumbens. Journal of Pharmacology and Experimental Therapeutics. 1993;264:289–293. [PubMed] [Google Scholar]


