

Abstract
Human serum transferrin (hTF), with two Fe3+ binding lobes transports iron into cells. Diferric hTF preferentially binds to a specific receptor (TFR) on the surface of cells and the complex undergoes clathrin dependent receptor-mediated endocytosis. The clathrin-coated vesicle fuses with an endosome where the pH is lowered, facilitating iron release from hTF. On a biologically relevant timescale (2-3 min), the factors critical to iron release include pH, anions, a chelator and the interaction of hTF with the TFR. Previous work, in which the increase in the intrinsic fluorescence signal was used to monitor iron release from the hTF/TFR complex, established that the TFR significantly enhances the rate of iron release from the C-lobe of hTF. In the current study, the role of the five C-lobe Trp residues in reporting the fluorescence change has been evaluated (± sTFR). Only four of the five recombinant Trp→ Phe mutants produced well. A single slow rate constant for iron release is found for the monoferric C-lobe (FeC hTF) and the four Trp mutants in the FeC hTF background. The three Trp residues equivalent to those in the N-lobe differed from the N-lobe and each other in their contributions to the fluorescent signal. Two rate constants are observed for the FeC hTF control and the four Trp mutants in complex with the TFR: kobsC1 reports conformational change(s) in the C-lobe initiated by the TFR and kobsC2 is ascribed to iron release. Excitation at 295 nm (Trp only) and at 280 nm (Trp and Tyr) reveals interesting and significant differences in the rate constants for the complex.
Human serum transferrin (hTF)1 is an 80 kDa (679 amino acids) bilobal glycoprotein that can bind and deliver two ferric ions/molecule to cells. The two lobes of hTF share significant sequence identity (∼40%) and are proposed to have arisen from gene duplication and fusion events (1). The iron binds within a deep cleft formed by two subdomains in each lobe (NI/NII and CI/CII) that are joined together by a hinge (2-5). At the pH of serum (∼7.4), two molecules of diferric hTF bind with nM affinity to the homodimeric transferrin receptor (TFR) on the cell surface and undergo receptor-mediated endocytosis into a clathrin-coated pit. The vesicle fuses with an acidic endosome where the pH is lowered to ∼ 5.6, facilitating iron release (6). Apo-hTF remains bound to the TFR and the complex is cycled back to the surface of the cell to start the process over (7). To exit the endosome by way of DMT-1, the divalent metal transporter, ferric iron must be reduced to ferrous iron (8). The recent identification of a ferrireductase in the membrane of the endosome (9), and a report that the TFR has an effect on the redox potential of iron bound to TF(10) raise the question of when and where the reduction takes place.
During the past 20 years, various recombinant hTF constructs, including isolated N- and C-lobes, full length monoferric hTFs binding iron only in the N-lobe (FeN hTF, mutation of iron binding residues Y426F and Y517F) or only in the C-lobe (FeC hTF, mutation of iron binding residues Y95F and Y188F), as well as full-length constructs with iron locked in the N-lobe (K206E) or C-lobe (R632A) have been produced. Studies of these recombinant hTFs have provided insight into the mechanism of iron release from each lobe and highlighted the different kinetic properties of the two lobes (11-15). At pH 5.6, the C-lobe has a considerably slower rate of iron release than the N-lobe largely due to differences in the pH dependent triggering motifs in the two lobes (16-18).
Each lobe of hTF holds a single Fe3+ ion tightly bound (∼1022 M-1) within a cleft. The ligands to the iron are comprised of a single histidine and aspartic acid residue, in addition to two tyrosines residues. The coordination is completed by two oxygen atoms from the synergistic anion, carbonate which is stabilized by an arginine residue and absolutely critical for high affinity binding (19). Iron coordination by the two tyrosine ligands (as tyrosinates) results in the formation of a ligand to metal charge transfer (LMCT) band in the visible region (470 nm). Iron coordination also disrupts the π to π* transition of the tyrosine ligands, leading to an increase in the UV absorbance which overlaps the intrinsic Trp fluorescence signal (20-22). Many studies have utilized the disappearance of the visible absorbance signal to directly assign rate constants for iron release from hTF and hTF mutants (14, 18, 23, 24). Additionally, upon transitioning from iron-bound to apo-hTF the fluorescent signal (produced largely by 3 Trp residues in the N-lobe and 5 Trp residues in the C-lobe), increases by ∼400% (25). The mechanism of fluorescence quenching was described in 1969 as long range energy transfer (FRET) between the Trp residues and the UV absorbance band formed by the interaction of the Tyr ligands with the iron (21). The Aisen laboratory was the first to monitor the recovery of fluorescence upon iron release to derive rate constants (26). Since this report, the method has been widely used (18, 22, 27-32). The sensitivity of this technique (which requires only nM concentrations of protein) is essential for the determination of the role of the TFR in hTF iron release, due to the poor solubility of TFR and the difficulty in obtaining native, membrane-bound TFR from natural sources, i.e., the placenta (33, 34). Availability of a recombinant soluble TFR (sTFR) has abolished the need for detergent and negated the supply issue, but has not completely resolved the solubility problem (35, 36).
Monitoring the increase in fluorescence during iron removal is often complex, yielding multiple rate constants and requiring computer-modeling to fully interpret the data. At the same time, the sensitivity of intrinsic Trp fluorescence to changes in protein environment around Trp residues provides access to conformational information that is unavailable by other probes (37-40). A recent study from our laboratory highlights the fact that using Trp fluorescence to monitor iron release events requires a more detailed understanding of the contribution of the individual Trp residues to fully explain the data (22).
The intrinsic fluorescence of the C-lobe is produced mainly by five Trp residues located at positions 344, 358, 441, 460 and 550 (Figure 1). Trp344 is equivalent to Trp8 in the N-lobe, Trp460 is equivalent to Trp128 and Trp550 is equivalent to Trp264. In the hTF structure, two of the Trp residues, at positions 344 and 358, reside close to each other (within ∼5 Å) in the CI subdomain and ∼16 and 20 Å from the iron center, respectively. Of the remaining three Trp residues located in the CII subdomain, Trp460 is closest to the iron (∼13 Å), while Trp441 and Trp550 are at a distance of 18 and 19 Å, respectively. All five Trp residues in the C-lobe are highly conserved in mammalian transferrin family members (including ovotransferrin and lactoferrin) indicating their probable structural/functional importance (19). Of the five Trp residues in the C-lobe, four reside in typical hydrophobic environments, whereas Trp550 is relatively exposed, lying close to the surface of the molecule and surrounded by a number of charged residues.
Figure 1.
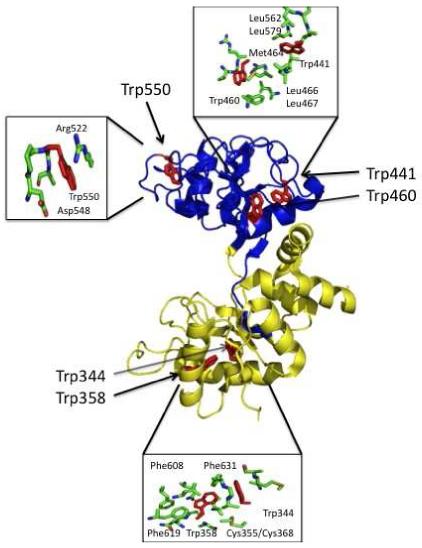
Crystal structure of the C-lobe of apo-hTF (PDB code 2HAU) showing the locations of the five tryptophan residues Trp344, Trp358, Trp441, Trp460 and Trp550 (highlighted in red). The CI subdomain (yellow) and CII subdomain (blue) are indicated. The regions around each Trp residue have been enlarged to highlight nearby residues.
In the current study we address: 1) the role of each of the five Trp residues in the C-lobe in reporting iron release, 2) whether there are differences among the Trp residues (as observed in the N-lobe), and 3) how binding to the sTFR affects the fluorescence properties and iron release rate constants of mutants lacking each of the Trp residues. Five single point Trp to Phe mutants were created in the full-length His-tagged FeC hTF construct (to eliminate the iron induced fluorescence changes from the N-lobe). To more precisely mimic the N-lobe, we also attempted to produce a double mutant (W358F/W441F). UV-vis spectra were recorded to evaluate the effect of each mutation on iron coordination. Steady-state tryptophan fluorescence emission spectra reveal differences in the contribution of the C-lobe Trp residues to the fluorescent signal compared to the N-lobe Trp residues. Stopped-flow kinetic analysis of iron release monitored by the increase in the fluorescent signal (in the absence and presence of the sTFR) was evaluated with excitation at both 280 (to evaluate the contributions of both Trp and Tyr residues to the signal) and 295 nm (to specifically query the contribution from the Trp residues).
MATERIALS AND METHODS
Materials
Dulbecco’s modified Eagle’s medium-Ham F-12 nutrient mixture, antibiotic-antimycotic solution (100x), and trypsin were from the GIBCO-BRL Life Technologies Division of Invitrogen. Fetal bovine serum was obtained from Atlanta Biologicals. Ultroser G is a serum replacement from Pall BioSepra (Cergy, France). The QuikChange mutagenesis kit and pBluescriptII were from Stratagene. Methotrexate from Bedford laboratories was used for selection of plasmid containing cells. All tissue culture dishes and flasks, as well as Corning expanded surface roller bottles, were obtained from Fisher Scientific. Ultracel 30 kDa MWCO microcentrifuge devices were from Amicon. Ni-NTA resin came from Qiagen. Hi-prep 26/60 Sephacryl S-200HR and S-300HR columns were obtained from Amersham Pharmacia. EDTA was from the Mann Research Laboratories Inc. NTA and ferrous ammonium sulfate were from Sigma.
Preparation of hTF single-point tryptophan mutants
Mutations were introduced into the pNUT construct containing the cDNA coding for His tagged nonglycosylated hTF using the QuikChange Site-Directed Mutagenesis kit as described in detail (41). All of the constructs were placed in the FeC hTF background to eliminate iron binding in the N-lobe (Y95F and Y188F mutations), as previously described (15). The forward mutagenic primers used to create the single-point Trp mutants are shown below. The nucleotides highlighted in bold indicate the substitutions resulting in the mutation:
W344F
5′ TGC AAG CCT GTG AAG TTC TGT GCG CTG AGC CAC C 3′
W358F
5′ GG CTC AAG TGT GAT GAG TTC AGT GTT AAC AGT GTA GGG 3′
W441F
5′ GCT TCT GAC CTC ACC TTC GAC AAT CTG AAA GGC AAG AAG TCC TGC 3′
W460F
5′ GC AGA ACC GCT GGC TTC AAC ATC CCC ATG GGC CTG 3′
W550F
5′ C CCT GAT CCC TTC GCT AAG AAT CTG AAT GAA AAA GAC TAT GAG TTG C 3′ Prior to transfection, the presence of the correct mutation (and the absence of spurious mutations) was confirmed for each construct by DNA sequence analysis of the complete cDNA insert and plasmid flanking regions within 300 bp of the cloning sites.
All proteins were produced in baby hamster kidney cells containing the appropriate coding cDNA in the pNUT vector; the recombinant proteins were secreted into the tissue culture medium (42). As described (15), Fe3+(NTA)2 is added to the tissue culture medium immediately upon collection to assure that the recombinant proteins are iron loaded and thus stabilized throughout the purification. The volume of the collected medium was reduced using a tangential flow device with a 30 kDa cutoff membrane and exchanged into 5 mM Tris-buffer, pH 8.0, containing 0.02% sodium azide. The concentrated medium was centrifuged (6000 x g) to remove particulates and the supernatant was diluted by addition of 5X buffer to make the sample 1X with respect to Qiagen start buffer (50 mM Tris, pH 7.5, 300 mM NaCl, 20 mM imidazole, 10% glycerol and 0.05% sodium azide). The His-tagged FeC hTF and mutants were then captured by passage over a Qiagen Ni-NTA column and eluted by addition of 250 mM imidazole to the Qiagen start buffer. Final purification involved passage over Sephacryl S-200HR (for hTF) or S-300HR (for sTFR) gel filtration columns. A competitive immunoassay was used to monitor protein production (43).
Complexes of FeC hTF/sTFR were generated using our standard protocol (31). Briefly, a molar excess of hTF was added to 1.5 mg of sTFR and the sample was run over a Sephacryl S-300HR column in 100 mM ammonium bicarbonate to remove excess hTF. Fractions containing the complex were concentrated to a nominal 15 mg/mL (with respect to hTF) using Ultracel microconcentrators with a 30 kDa MWCO.
Spectral analysis
Each iron saturated mutant was scanned from 500 to 300 nm on a Varian Cary 100 spectrophotometer at 25° C in 100 mM ammonium bicarbonate, pH 8.1 (dual beam mode with a cuvette containing buffer only as a reference). The molar absorption coefficient (ε) of each Trp mutant was determined by following our recently published protocol (32).
Steady-state fluorescence spectroscopy
Steady-state tryptophan emission spectra were obtained on a Quantamaster Spectrofluorimeter (Photon Technology International, South Brunswick NJ), as previously described in detail (22). In contrast to previous studies in which samples were excited at 280 nm, excitation at 295 nm (wavelength selected with a monochromator) was measured to specifically target the intrinsic Trp signal. The excitation light was filtered through a 295 nm cut-on filter, and emission scans were collected from 305-400 nm (320 cut-on filter), using slit widths of 2 nm (excitation) and 6 nm (emission). The buffer background was subtracted from each spectrum. Corrections for monochromator and PMT sensitivity were adjusted according to the manufacturer’s instructions. Iron bound protein (1 μM) was added to a cuvette (1.8 mL final volume) containing 100 mM HEPES buffer, pH 7.4 at 25°C and gently stirred with a small magnetic stir bar. Apo-protein was obtained by adding the same amount of iron-bound protein to 100 mM MES, pH 5.6 containing 300 mM KCl and 4 mM EDTA, and equilibrating for ∼ 20 min. Three steady-state emission scans were collected and averaged. In the presence of only MES buffer, pH 5.6 and 300 mM KCl (no EDTA) there is no change (<1.0%) in the intensity of the fluorescent signal.
Kinetics of Fe3+ release
The kinetics of iron release from FeC hTF and the single-point Trp mutants, in the absence and presence of the sTFR, were monitored at pH 5.6 on an Applied Photophysics SX.18MV stopped-flow spectrofluorimeter (31). One syringe contained protein (375 nM) in 300 mM KCl and the other syringe had 200 mM MES buffer, pH 5.6, containing 300 mM KCl and 8 mM EDTA. In the current work, most samples were excited at both 280 and at 295 nm and the fluorescence emission was monitored using a high-pass 320 nm cut-on filter. Although in all of our previous studies samples were excited at 280 nm, as mentioned above, excitation at 295 nm allows a more direct evaluation of the Trp contribution to the change in the fluorescent signal by minimizing the fluorescence contributions of Tyr residues. Rate constants were determined by fitting the change in fluorescence intensity-versus-time using Origin software (version 7.5) to either a single-exponential (y = A1*exp(-x/t1) + y0) or double-exponential (y = A1*exp(-x/t1) + A2*exp(-x/t2) + y0) function. Note that in the case of the sTFR complexes the initial quench in the fluorescent signal (the first 0.192 sec) was not included in the fits.
RESULTS
Expression of single-point tryptophan mutant FeC hTF constructs
As reported previously, introduction of the Y95F and Y188F mutations into the His tagged non-glycosylated hTF construct to generate FeC hTF has a minimal effect on expression level (52.9 ± 13.7 mg/L) compared to N-His hTF-NG (15). As determined by a competitive immunoassay, expression of the five single-point Trp constructs in the FeC hTF background ranged from a low of ∼ 7 mg/L for the W358F mutant to a high of 35 mg/L for the W441F mutant. The W344F, W460F and W550F mutants attained an intermediate maximum expression level of ∼15 mg/L. The double tryptophan mutant (W358F/W441F) expressed very poorly (∼ 4 mg/L).
UV-vis spectra and molar absorption coefficients
Scans in the UV-visible region (500-300 nm) were obtained for all iron bound FeC hTF samples. Iron binding gives rise to a LMCT band (470 nm) that results in the characteristic salmon pink color of hTF. Comparison of the intrinsic parameters (λmax and A280/Amax) provides a direct assessment of the effect that a mutation has on iron coordination. Three of the single-point mutants (W344F, W441F and W460F) have λmax values nearly identical to the control FeC hTF, whereas the W550F mutant has a hypsochromically shifted λmax value (5 nm) (Table 1). Unfortunately, the W358F single mutant and the W358F/W441F double mutant could not be accurately analyzed because of the presence of a small Soret band at 410 nm (indicating the presence of heme) in the visible absorbance spectrum. Due to this heme contamination and our inability to produce sufficient amounts of these two mutants, it was not possible to collect any meaningful spectral data. The A280/Amaxvalues of the four Trp mutants were similar to the control demonstrating that substitution with Phe did not disrupt their ability to specifically bind iron.
Table 1.
Spectral characteristics and molar absorption coefficients (ε280 mM-1 cm-1) for diferric hTF, FeC hTF and the FeC hTF Trp mutants
| Protein | λMax (nm) | A280/Amax | Calc.a ε280 Apo | Exp. ε280 Apo | Exp. ε280 Iron | % increase due to ironb |
|---|---|---|---|---|---|---|
| Diferric hTF | 466c | 21.3c | 85.1 | 84.0 ± 0.2d | 103.9 ± 0.2d | 23.7 |
| FeC hTF | 460 | 35.2 | 82.1 | 81.5 ± 0.2d | 92.1 ± 0.2d | 13.0 |
| W344F FeC hTF | 458 | 34.7 | 76.6 | N.De | N.De | - |
| W358F FeC hTFe | N.D | N.D | 76.6 | N.D | N.D | - |
| W441F FeC hTF | 459 | 34.4 | 76.6 | 76.8 ± 0.8 | 85.3 ± 0.3 | 11.1 |
| W460F FeC hTF | 459 | 35.3 | 76.6 | 77.4 ± 0.3 | 85.1 ± 0.1 | 9.9 |
| W550F FeC hTF | 455 | 33.0 | 76.6 | 76.6 ± 1.0 | 84.6 ± 0.7 | 10.4 |
The apo absorption coefficients were calculated as described (32).
Percent increase is calculated as 100 * [ε (iron) - ε (apo)] / ε (apo).
(15).
Millimolar absorption coefficients from (32).
Values could be not determined due to insufficient production of recombinant protein and heme contamination.
To legitimately compare samples, it is essential to have an accurate estimate of the concentration of each. As described previously (32), experimental mM absorption coefficients (ε) were determined for each mutant in the iron-bound and apo-forms. Consistent with earlier results, the calculated values for the apo-proteins were nearly identical to the experimentally determined values and the presence of iron resulted in a similar increase in ε (∼10%) for each of the single-point mutants that we were able to analyze (Table 1).
Steady-state emission spectra
Intrinsic fluorescence emission spectra were recorded for FeC hTF and four of the Trp mutants (Table 2). The overall shape of the fluorescence curve for each mutant is similar to the control (data not shown). Additionally the λmax is nearly identical, both with and without bound iron. The intensity of the apo W344F and W550F mutants is ∼15% lower than the apo hTF control; the W441F and W460F mutants are decreased by ∼30%, indicating that Trp441 and Trp460 contribute twice as much to the fluorescent signal as Trp344 and Trp550. These percent differences in fluorescence intensities also hold true in the iron-bound forms of the Trp mutants.
Table 2.
Steady-state fluorescence properties of FeC hTF and four of the Trp mutants
| Proteina | λmax (nm) (Apo) | λmax (nm) (Fe) | Fluorescence Intensity (F) (counts/sec) (Fe) | Fluorescence Intensity (F) (counts/sec) (Apo) | % diff Fe and apob |
|---|---|---|---|---|---|
| FeC hTF | 336 | 338 | 78000 | 134000 | 70 |
| W344F FeC hTF | 337 | 337 | 74700 | 115000 | 54 |
| W441F FeC hTF | 337 | 337 | 61000 | 97500 | 60 |
| W460F FeC hTF | 337 | 339 | 66200 | 91000 | 37 |
| W550F FeC hTF | 337 | 338 | 73000 | 114000 | 56 |
All samples (1 μM concentration) were excited at 295 nm to minimize the contribution of Tyr residues. Iron containing samples were in 100 mM HEPES, pH 7.4 and apo samples were in 100 mM MES, pH 5.6 buffer containing 300 mM KCl and 4 mM EDTA.
Percent difference is calculated as 100 * [Fa(Apo) - Fa(Iron)]/ Fa(Iron), in which Fa is the integrated area under the curve between 305 and 400 nm.
Removal of iron from hTF results in an increase in the intrinsic Trp signal. As shown in Table 2, when iron is removed from FeC hTF, the increase in the fluorescence signal is 70%. For the W344F, W441F, and W550F mutants, the increase is slightly less (54, 60 and 56%, respectively). The most dramatic effect is found for the W460F mutant with an increase in the fluorescence signal as a result of iron removal of only 37% (Table 2).
Iron release from hTF constructs in the absence of receptor
Iron-release rate constants for FeC hTF were determined by monitoring the increase in the intrinsic Trp fluorescence over time. The kinetic curves for each mutant are shown in Figure 2A. The raw data for each trace has been adjusted to zero at time zero in order to compare the differences in the change in the fluorescent signal. Although each of the curves fit best to a single-exponential function (Materials and Methods), we note that the fits are rather poor as indicated by the fitting parameters and residuals (Figure 3). The poorness of the fits is due to a small lag observed in the first 50 seconds of the kinetic trace. Significantly, the W344F mutant lacks the lag and yields the best fit of any of the Trp mutants (Figure 3). Likewise the lag is reduced in the W460F mutant.
Figure 2.

A. Kinetic curves of FeC hTF and the four single-point FeC hTF Trp mutants at pH 5.6, generated by stopped-flow mixing. B. Iron release curves for FeC hTF and FeC hTF Trp mutant constructs in complex with the sTFR. For A and B, iron-bound samples (375 nM) in 300 mM KCl were rapidly mixed with 200 mM MES buffer pH 5.6, containing 300 mM KCl and 8 mM EDTA; the samples were excited with 295 nm light and the fluorescence emission was monitored using a 320 nm cut on filter.
Figure 3.

A. Kinetic curve and exponential fit (red line) of FeC hTF excited at 280 nm. B. Kinetic curve and fit (red line) of FeC hTF excited at 295 nm. C. Kinetic curve and fit (red line) of the W344F mutant excited at 295 nm. D. Kinetic curve and fit (red line) of the W460F mutant excited at 295 nm. The R2, χ2/DoF, and residuals (green) are given for each kinetic trace to indicate the goodness (or lack of goodness) of the fit.
Consistent with the UV-vis data, the rate constants for each of the four mutants that we were able to evaluate are similar to the control demonstrating that the substitution of Trp by Phe does not have a destabilizing effect. Additionally, we note that the rate constant for the FeC hTF control is very similar regardless of the excitation wavelength: 0.46 ± 0.06 min-1 when excited at 295 nm versus 0.60 ± 0.07 min-1 when excited at 280 nm.
Iron release from hTF/sTFR complexes
Using the same protocol (and the identical amount of FeC hTF), kinetic traces were generated and rate constants were calculated for the FeC hTF control and Trp mutants bound to the sTFR (Figure 2B and Table 3B). As previously observed, iron release from the control FeC hTF bound to the sTFR requires a double exponential function to obtain the best fit (44). Also, as previously observed, a new feature appears at the beginning of the kinetic trace: a small but reproducible drop in the fluorescence intensity lasting for the first 0.192 seconds and only found in the presence of the sTFR (44). Significantly, excitation at 295 nm also yields two rate constants for the control FeC hTF in the complex; however the rate constants are ∼ 2-fold slower than those obtained with excitation at 280 nm (Table 3B). As for the control FeC hTF, each of the four Trp mutants features the initial quench and yields two rate constants; additionally receptor stimulated iron release is clearly maintained in the mutants. Also, as observed for the control, all four Trp mutants had faster observed rate constants when excited at 280 nm compared to 295 nm. Because the rate constant for the constructs alone are similar, this observation means that the enhancement in the rate constants due to the sTFR is greater with 280 nm excitation than with 295 nm excitation. Additionally, as shown (Table 3B final column) there are significant shifts in the fractional fluorescence contribution of each rate component to the intensity (as derived from the fitting parameters). I1 and I2 correspond to the contribution form kobsC1 and kobsC2, respectively (see Discussion).
Table 3B.
Rate constants for iron release from FeC hTF and Trp mutants bound to the sTFR excited at 295 or at 280 nm
| Protein | Excitation | kobsC1(min-1)a | Fold Diff vs WT | kobsC2 (min-1)a | Fold Diff vs WT | I1/I2b % |
|---|---|---|---|---|---|---|
| FeC hTF/sTFR | 295 | 13.2 ± 1.6 | - | 3.7 ± 0.5 | - | 59/41 |
| 280 | 21.0 ± 2.7 | - | 7.3 ± 1.0 | - | 36/64c | |
| W344F FeC hTF/sTFR | 295 | 26.5 ± 1.7 | 2.1 | 6.6 ± 0.4 | 1.9 | 49/51 |
| 280 | 46.4 ± 6.9 | 2.2 | 12.0 ± 1.3 | 1.6 | 30/70 | |
| W441F FeC hTF/sTFR | 295 | 14.3 ± 2.0 | 1.1 | 4.1 ± 0.5 | 1.1 | 40/60 |
| 280 | 19.2 ± 1.1 | 0.9 | 6.6 ± 0.4 | 0.9 | 23/77 | |
| W460F FeC hTF/sTFR | 295 | 30.2 ± 6.4 | 2.3 | 8.3 ± 0.9 | 2.3 | 45/55 |
| 280 | 57.0 ± 11.4 | 2.7 | 13.3 ± 0.8 | 1.8 | 21/79 | |
| W550F FeC hTF/sTFR | 295 | 15.6 ± 2.4 | 1.3 | 4.3 ± 0.5 | 1.3 | 42/58 |
| 280 | 26.0 ± 4.5 | 1.2 | 7.3 ± 0.7 | 1.0 | 22/78 |
Each value is the average of at least 15 kinetic traces.
I1 and I2 refer to the % change in intensity corresponding to kobsC1 and kobsC2, respectively.
For FeC hTF/sTFR the standard deviation of the values at 280 is ± 12% from 150 runs.
Both rate constants (at each excitation wavelength) for the W441F and W550F mutants bound to the sTFR are similar to the control complex (FeC hTF bound to sTFR). In contrast, the W344F and W460F mutants show a 2-fold increase in both rate constants. As would be expected by the removal of a Trp residue, the actual fluorescence intensity of each of the mutants is lower than the control. The intensities for the W344F and W441F mutants are 7% and 16% lower, respectively, while those for the W460F and W550F mutants are each decreased by 33% (Figure 2B). Interestingly, the presence of the sTFR alters the change in fluorescence emission of the mutants relative to these mutants alone (compare Figure 2A and 2B). For example the impact of the absence of Trp550 is small in the absence of sTFR and large in its presence suggesting that binding to the sTFR has altered the environment around Trp550.
DISCUSSION
Kinetics of iron release from the control, FeC hTF, at pH 5.6, compared to FeN hTF
Iron release from FeC hTF at pH 5.6 in the presence of 300 mM KCl and 4 mM EDTA results in a kinetic trace that fits best to a single exponential function when excited at either 280 or 295 nm. However, as pointed out above, the fit is relatively poor due to a small lag in the beginning of the trace (Figure 3 A and B). Additionally, and as reported previously (44), the single rate constant is very slow (0.46 min-1 at 295 and 0.60 min-1 at 280) requiring 500 sec to attain 5 half lives. This result contrasts with iron release from the monoferric N-lobe (FeN hTF) that yielded three rate constants of 20.8, 4.1 and 1.1 min-1 under identical conditions and was complete in 200 sec (25). The slower rate constant for iron release from the C-lobe of FeC hTF relative to the N-lobe in the FeN hTF construct is attributed to differences in the second shell residues and in the hinge regions between the subdomains of each lobe. The second shell network is comprised of the amino acids residues that interact with the iron binding ligands. In particular, the pH sensitive Lys206 and Lys296 pair in the N-lobe (dilysine trigger) and the triad of residues in the C-lobe, Lys534/Arg632/Asp634, have been shown to be critical to efficient release of iron (14, 17). Additionally, the hinge region in the C-lobe is longer than the hinge in the N-lobe (5). Unlike the N-lobe hinge, which lies adjacent to an anti-parallel β-sheet formed by two β-strands, the strands nearest the hinge region in the C-lobe are unstructured, and one of them is completely missing. This region, which connects the two subdomains, is responsible for the flexibility of the hinge and a twisting motion that gives rise to iron binding or release. In combination with the greater number of disulfide bonds in the C-lobe (11 disulfides compared to 8 in the N-lobe), opening of the cleft in the C-lobe would be predicted to involve a more rigid motion of the CI and CII subdomains.
Production of the five Trp mutants in FeC hTF
To assign the source of the increase in fluorescence when iron is released from the C-lobe, and the origin of the lag, we evaluated the contribution of the individual Trp residues in the C-lobe to the fluorescent signal by producing five single-point mutants in which Trp was substituted by Phe in the FeC hTF construct. Unfortunately, substitution of Phe at position 358 (a Trp not found in the N-lobe) resulted in very low expression of the W358F mutant. This strongly suggests that Trp358 plays a critical role in folding of the CI subdomain and/or its stabilization once synthesized. Curiously the mutation of the nearby Trp344 to Phe in this subdomain did not have the same deleterious effect on expression even though both reside in similar hydrophobic environments within ∼5 Å of each other. Our inability to express substantial amounts of isolated C-lobe has been ascribed to the need to have the N-lobe to “pull” the C-lobe through the translational machinery (45). We suggest that substitution of the smaller Phe residue at position 358 may affect the synthesis of the recombinant protein by destabilization of the growing peptide chain.
Spectral characterization of the Trp mutants in FeC hTF
Evaluation of the four single point Trp mutants by UV/Vis spectroscopy indicates that the substitution of Phe is most affected by the absence of Trp550; the λmax of the W550F mutant is blue shifted by 5 nm (Table 1). In contrast, the molar absorption coefficients (ε280) for the apo forms of each mutant show little deviation from the calculated values and the increases due to the presence of iron are also very similar, ranging from 9.9% for the W460F mutant to 11.1% for the W441F mutant (Table 1). These results indicate that the iron coordination site within the cleft of the C-lobe has been minimally disturbed.
However, the steady-state fluorescence spectra for the four FeC hTF Trp mutants reveal that the contribution to the fluorescent signal of the Trp residues is not equivalent when iron is released (Table 2 and Figure 2A). The absence of Trp344 causes little change in the overall fluorescent signal and only a small decrease in the change due to iron release. Like Trp8 in the N-lobe, Trp344 is close to three disulfide bonds which are likely to result in the quenching of its fluorescent signal. In sharp contrast to the homologous Trp264 in the N-lobe, which is the major contributor to the overall fluorescence and is quenched significantly when iron is bound (22, 46), Trp550 contributes little to the overall fluorescent signal and undergoes only a small change when iron is removed (Figure 2A). The proximity of the indole ring of Trp550 to the negatively charged Asp548 residue may account for this observation since Asp side chains have been shown to quench the florescence of Trp by enhancing electron transfer (Figure 1) (47). The absence of Trp441 results in a 27% decrease in the overall fluorescent signal compared to the FeC hTF control (Table 2). However, as shown in Figure 2A, the W441F mutant is not very sensitive to the removal of iron. In comparison to the other Trp residues, when Trp460 (located closest to the iron in the binding cleft) is absent, as in the W460F mutant, there is a significant reduction in the fluorescence change during iron release (∼50%). Thus Trp460 is the major contributor to the change in the fluorescence intensity as a result of iron release.
Kinetics of iron release from the Trp mutants (in the absence of TFR)
As noted in the Results, the kinetic curves for FeC hTF and two of the Trp mutants (W441F and W550F) had less than ideal fits to a single-exponential function due to the presence of a small lag (Figure 3). We suggest that this lag occurs as a consequence of one (or more) pH induced conformational change(s) in each lobe that transmit the conformational/iron status of one lobe to the other. Communication between lobes in all TF family members has been well documented (23, 48-50). Iron release from diferric hTF occurs first from the N-lobe and then from the C-lobe (51, 52). The conformational changes which take place in the N-lobe when it releases iron are communicated to the C-lobe priming it to release its iron (53). In the present study, we suggest that the lack of iron in the N-lobe is communicated to the C-lobe when the pH is lowered to 5.6. Interestingly, the W344F mutant does not have the lag (Figure 3). Likewise the W460F mutant has a reduced lag and both mutants fit very well to the monophasic function. We propose that mutation of Trp344 to the smaller Phe residue yields a CI subdomain with a conformation that may already be “primed” to interact with the N-lobe (thereby eliminating the lag). The explanation for the reduced lag in the case of the Phe460 substitution is more difficult. It may be that the mutation results in a looser (less rigid) CII subdomain that also affects the conformation and translates into the CI subdomain (see below).
Kinetics of iron release from the control, FeC hTF/sTFR complex at pH 5.6
Under identical conditions to the constructs alone, the FeC hTF/sTFR complex yields two rate constants for iron release compared to the single rate constant for FeC hTF alone. When excited at 280 nm, a 35- and 12-fold increase in the rate constants for the FeC hTF/sTFR complex is observed; similarly, there is a 29- and 8-fold increase when excited at 295 nm (Table 3A and 3B). In previous work (26), a single rate constant (∼100-fold faster) for iron release from the complex compared to FeC hTF alone was reported. The substantial difference from the results in the present work is rationalized by the fact that a steady-state method was employed in the previous study (30). As recently described (44), use of a sensitive stopped-flow instrument has provided kinetic data that is much more reproducible and reliable as indicated by the high signal to noise ratio of the kinetic traces (Figure 2A and B). The faster rate constant is ascribed a pH-induced structural change that enables iron to be released to the chelator, an event that is reported by the second slower rate constant. When the FeC hTF/sTFR complex is excited at 280 nm the first event accounts for ∼40% of the change in fluorescence intensity (I1) and the second event accounts for the remaining 60% (I2). Conversely, when the complex is excited at 295 nm, the reverse is found; the first event accounts for ∼60 % of the change in intensity and the second event accounts for 40%. With excitation at 280 nm the liganding Tyr residues (Tyr426 and Tyr517) make a major contribution to iron release as reported by kobsC2 and adding to the 60% change in the fluorescence signal. As would be predicted, with excitation at 295 nm, kobsC1 accounts for the majority of the change in the fluorescence signal because it lacks the contribution from the Tyr residues and mainly reports the conformational change which precedes (and allows) the iron release. As described above, given the differences in both the actual rate constants and in the relative intensities, I1 and I2, it is clear that what we are measuring varies in a reporter dependent manner.
Table 3A.
Rate constants for iron release from FeC hTF and Trp mutants excited at 295 nm in 100 mM MES buffer, pH 5.6 containing 300 mM KCl and 4 mM EDTA
| Protein | kobsC1(min-1)a | Fold Difference versus WT |
|---|---|---|
| FeC hTF | 0.46 ± 0.06b | - |
| W344F FeC hTF | 0.58 ± 0.05 | 1.3 |
| W441F FeC hTF | 0.40 ± 0.05 | 0.9 |
| W460F FeC hTF | 0.67 ± 0.04 | 1.5 |
| W550F FeC hTF | 0.42 ± 0.04 | 0.9 |
Each value is the average of 6 kinetic traces.
Note that when FeC hTF is excited at 280 nm the kobsC1(min-1) is 0.60 ± 0.07
In the present work, samples have been excited at 295 nm to try to specifically and selectively target the Trp residues. Although a similar rate constant was measured for FeC hTF alone regardless of the excitation wavelength (Table 3A), unexpectedly, the two rate constants for the FeC hTF/sTFR complex are nearly 2-fold slower than those obtained from the identical sample excited at 280 nm (Table 3B). As reported previously (44), excitation of the FeC hTF/sTFR complex at 280 nm resulted in a 75% decrease in the increase in fluorescence intensity upon iron release compared to the change in the fluorescence intensity of FeC hTF alone under identical conditions. In those studies, we established that the change in fluorescence intensity can be completely assigned to FeC hTF in the complex with no significant contribution from the sTFR. In the present work, excitation at 295 nm results in only a 37% decrease in the change in fluorescence intensity (Figure 2A and 2B). The most plausible explanation for this smaller change is that when FeC hTF is excited with 280 nm light, in addition to the Trp residues, one or more of the 12 Tyr residues in the C-lobe contributes to the fluorescence signal during iron removal. At 295 nm excitation there would be little to no contribution from the Tyr residues. Attenuation of the fluorescence intensity occurs in the complex when excited at 280 nm as a result of Tyr to Trp energy transfer (54, 55). Similar to the decrease in the fluorescent signal, the difference in the rate constants can be explained by the fact that we are apparently accessing two different reporter signals; with 295 nm excitation, Trp residues are the sole reporters while at 280 nm, both Trp and Tyr residues are excited and contribute to the change in the fluorescence intensity.
Kinetics of iron release from the Trp mutants in complex with the sTFR at pH 5.6
As with the control, all of the Trp mutants bound to the sTFR require a double exponential function to fit the kinetic curves (Figure 2B). Also as with the control, the two rate constants for the four Trp mutant complexes excited at 295 nm were uniformly ∼ 2-fold slower than those obtained from the identical samples excited at 280 nm (Table 3B). In the complex with the sTFR, both the W344F and W460F mutants show a 2-fold enhancement of the two rate constants compared to the control at both excitation wavelengths (Table 3B). As mentioned above, the substitution of Trp344 or Trp460 by Phe appears to prime the C-lobe for iron release possibly by enhancing its conformational flexibility. The increase in plasticity would be expected to result in more rapid iron release (even in the presence of the structural constraints imposed by interaction with the sTFR).
The large impact of the sTFR on the fluorescent signal of the W550F mutant indicates that Trp550 in the complex is normally quenched. This observation implies that binding to the sTFR induces a change in the local environment of Trp550 which either affects its distance to the iron center (by restriction of the local environment) or its fluorescence quantum yield (via changes in solvent/residue orientation around Trp550). The location of Trp550 on the surface of the CII subdomain makes it particularly susceptible to its environment.
In summary, our results demonstrate that the non-homologous Trp residues, Trp358 and Trp441 play different structural roles in the hTF C-lobe, with Trp358 essential to the stability of the CI subdomain. Although iron release from the C-lobe is best fit by a single rate constant, there is a pH-induced lobe-lobe interaction and/or conformational change in the C-lobe observed spectroscopically as a lag at the beginning of the kinetic traces. This lag is missing or reduced in the W344F and W460F mutants. For FeC hTF alone, Trp460 is the main contributor to the fluorescence change when iron is released. However, conformational changes due to the sTFR interaction alter the fluorescence emission of Trp441 and Trp550 possibly by changing their distance to the iron binding center, and thereby enhancing their fluorescence contribution to the iron release signal.
ACKNOWLEGDEMENT
We would like to thank Drs’ David Jameson and Justin Ross for helpful discussions.
This work was supported by a USPHS Grant R01 DK21739 (A.B.M). Support for NGJ, SLB and ANS came from Hemostasis and Thrombosis Training Grant 5T32HL007594, issued to Dr. Kenneth G. Mann at The University of Vermont by the National Heart, Lung and Blood Institute.
Abbreviations
- hTF
human serum transferrin
- FeN hTF
non-glycosylated N-terminal hexa-His tagged recombinant monoferric hTF with mutations to prevent iron binding in the C-lobe (Y426F and Y517F)
- FeC hTF
non-glycosylated N-terminal hexa-His tagged recombinant monoferric hTF with mutations to prevent iron binding in the N-lobe (Y95F and Y188F)
- FRET
Förster Resonance Energy Transfer
- LMCT
ligand to metal charge transfer
- oTF
ovotransferrin
- TFR
transferrin receptor
- sTFR
glycosylated, N-terminal hexa-His tagged soluble recombinant transferrin receptor (residues 121-760)
REFERENCES
- 1.Yang F, Lum JB, McGill JR, Moore CM, Naylor SL, van Bragt PH, Baldwin WD, Bowman BH. Human transferrin: cDNA characterization and chromosomal localization. Proc. Natl. Acad. Sci. U. S. A. 1984;81:2752–2756. doi: 10.1073/pnas.81.9.2752. [DOI] [PMC free article] [PubMed] [Google Scholar]
- 2.Jeffrey PD, Bewley MC, MacGillivray RT, Mason AB, Woodworth RC, Baker EN. Ligand-induced conformational change in transferrins: crystal structure of the open form of the N-terminal half-molecule of human transferrin. Biochemistry. 1998;37:13978–13986. doi: 10.1021/bi9812064. [DOI] [PubMed] [Google Scholar]
- 3.MacGillivray RT, Moore SA, Chen J, Anderson BF, Baker H, Luo Y, Bewley M, Smith CA, Murphy ME, Wang Y, Mason AB, Woodworth RC, Brayer GD, Baker EN. Two high-resolution crystal structures of the recombinant N-lobe of human transferrin reveal a structural change implicated in iron release. Biochemistry. 1998;37:7919–7928. doi: 10.1021/bi980355j. [DOI] [PubMed] [Google Scholar]
- 4.Evans RW, Crawley JB, Joannou CL, Sharma ND. Iron Proteins. In: Bullen JJ, Griffiths E, editors. Iron and Infection: Molecular, Physiological and Clinical Aspects. John Wiley and Sons; Chichester: 1999. pp. 27–86. [Google Scholar]
- 5.Wally J, Halbrooks PJ, Vonrhein C, Rould MA, Everse SJ, Mason AB, Buchanan SK. The crystal structure of iron-free human serum transferrin provides insight into inter-lobe communication and receptor binding. J. Biol. Chem. 2006;281:24934–24944. doi: 10.1074/jbc.M604592200. [DOI] [PMC free article] [PubMed] [Google Scholar]
- 6.Aisen P. Transferrin receptor 1. Int. J. Biochem. Cell Biol. 2004;36:2137–2143. doi: 10.1016/j.biocel.2004.02.007. [DOI] [PubMed] [Google Scholar]
- 7.Klausner RD, Ashwell G, van Renswoude J, Harford JB, Bridges KR. Binding of apotransferrin to K562 cells: explanation of the transferrin cycle. Proc. Natl. Acad. Sci. U. S. A. 1983;80:2263–2266. doi: 10.1073/pnas.80.8.2263. [DOI] [PMC free article] [PubMed] [Google Scholar]
- 8.Andrews NC. The iron transporter DMT1. Int. J. Biochem. Cell Biol. 1999;31:991–994. doi: 10.1016/s1357-2725(99)00065-5. [DOI] [PubMed] [Google Scholar]
- 9.Ohgami RS, Campagna DR, Greer EL, Antiochos B, McDonald A, Chen J, Sharp JJ, Fujiwara Y, Barker JE, Fleming MD. Identification of a ferrireductase required for efficient transferrin-dependent iron uptake in erythroid cells. Nature Genetics. 2005;37:1264–1269. doi: 10.1038/ng1658. [DOI] [PMC free article] [PubMed] [Google Scholar]
- 10.Dhungana S, Taboy CH, Zak O, Larvie M, Crumbliss AL, Aisen P. Redox properties of human transferrin bound to its receptor. Biochemistry. 2004;43:205–209. doi: 10.1021/bi0353631. [DOI] [PubMed] [Google Scholar]
- 11.Funk WD, MacGillivray RT, Mason AB, Brown SA, Woodworth RC. Expression of the amino-terminal half-molecule of human serum transferrin in cultured cells and characterization of the recombinant protein. Biochemistry. 1990;29:1654–1660. doi: 10.1021/bi00458a043. [DOI] [PubMed] [Google Scholar]
- 12.Zak O, Aisen P. A new method for obtaining human transferrin C-lobe in the native conformation: preparation and properties. Biochemistry. 2002;41:1647–1653. doi: 10.1021/bi015868w. [DOI] [PubMed] [Google Scholar]
- 13.Zak O, Aisen P. A poly-His tag method for obtaining the C-terminal lobe of human transferrin. Protein Expr. Purif. 2003;28:120–124. doi: 10.1016/s1046-5928(02)00648-4. [DOI] [PubMed] [Google Scholar]
- 14.Halbrooks PJ, He QY, Briggs SK, Everse SJ, Smith VC, MacGillivray RT, Mason AB. Investigation of the mechanism of iron release from the C-lobe of human serum transferrin: mutational analysis of the role of a pH sensitive triad. Biochemistry. 2003;42:3701–3707. doi: 10.1021/bi027071q. [DOI] [PubMed] [Google Scholar]
- 15.Mason AB, Halbrooks PJ, Larouche JR, Briggs SK, Moffett ML, Ramsey JE, Connolly SA, Smith VC, MacGillivray RT. Expression, purification, and characterization of authentic monoferric and apo-human serum transferrins. Protein Expr. Purif. 2004;36:318–326. doi: 10.1016/j.pep.2004.04.013. [DOI] [PubMed] [Google Scholar]
- 16.Steinlein LM, Ligman CM, Kessler S, Ikeda RA. Iron release is reduced by mutations of lysines 206 and 296 in recombinant N-terminal half-transferrin. Biochemistry. 1998;37:13696–13703. doi: 10.1021/bi980318s. [DOI] [PubMed] [Google Scholar]
- 17.He QY, Mason AB, Tam BM, MacGillivray RT, Woodworth RC. Dual role of Lys206-Lys296 interaction in human transferrin N-lobe: iron-release trigger and anion-binding site. Biochemistry. 1999;38:9704–9711. doi: 10.1021/bi990134t. [DOI] [PubMed] [Google Scholar]
- 18.Mason AB, Halbrooks PJ, James NG, Connolly SA, Larouche JR, Smith VC, MacGillivray RT, Chasteen ND. Mutational analysis of C-lobe ligands of human serum transferrin: insights into the mechanism of iron release. Biochemistry. 2005;44:8013–8021. doi: 10.1021/bi050015f. [DOI] [PubMed] [Google Scholar]
- 19.Lambert LA, Perri H, Halbrooks PJ, Mason AB. Evolution of the transferrin family: conservation of residues associated with iron and anion binding. Comp. Biochem. Physiol. B. 2005;142:129–141. doi: 10.1016/j.cbpb.2005.07.007. [DOI] [PubMed] [Google Scholar]
- 20.Patch MG, Carrano CJ. The origin of the visible absorption in metal transferrins. Inorg. Chim. Acta. 1981;56:L71–L73. [Google Scholar]
- 21.Lehrer SS. Fluorescence and absorption studies of the binding of copper and iron to transferrin. J. Biol. Chem. 1969;244:3613–3617. [PubMed] [Google Scholar]
- 22.James NG, Berger CL, Byrne SL, Smith VC, MacGillivray RT, Mason AB. Intrinsic fluorescence reports a global conformational change in the N-lobe of human serum transferrin following iron release. Biochemistry. 2007;46:10603–10611. doi: 10.1021/bi602425c. [DOI] [PubMed] [Google Scholar]
- 23.Bali PK, Harris WR. Cooperativity and heterogeneity between the two binding sites of diferric transferrin during iron removal by pyrophosphate. J. Am. Chem. Soc. 1989;111:4457–4461. [Google Scholar]
- 24.Bali PK, Harris WR, Nesset-Tollefson D. Kinetics of iron removal from monoferric and cobalt-labeled monoferric human serum transferrin by nitrilotris(methylenephosphonic acid) and nitrilotriacetic acid. Inorg. Chem. 1991;30:502–508. [Google Scholar]
- 25.Wang F, Lothrop AP, James NG, Griffiths TA, Lambert LA, Leverence R, Kaltashov IA, Andrews NC, MacGillivray RT, Mason AB. A novel murine protein with no effect on iron homeostasis is homologous to transferrin and is the putative inhibitor of carbonic anhydrase. Biochem. J. 2007;406:85–95. doi: 10.1042/BJ20070384. [DOI] [PMC free article] [PubMed] [Google Scholar]
- 26.Egan TJ, Zak O, Aisen P. The anion requirement for iron release from transferrin is preserved in the receptor-transferrin complex. Biochemistry. 1993;32:8162–8167. doi: 10.1021/bi00083a016. [DOI] [PubMed] [Google Scholar]
- 27.Zak O, Aisen P, Crawley JB, Joannou CL, Patel KJ, Rafiq M, Evans RW. Iron release from recombinant N-lobe and mutants of human transferrin. Biochemistry. 1995;34:14428–14434. doi: 10.1021/bi00044a020. [DOI] [PubMed] [Google Scholar]
- 28.Zak O, Tam B, MacGillivray RT, Aisen P. A kinetically active site in the C-lobe of human transferrin. Biochemistry. 1997;36:11036–11043. doi: 10.1021/bi970628v. [DOI] [PubMed] [Google Scholar]
- 29.Muralidhara BK, Hirose M. Anion-mediated iron release from transferrins. The kinetic and mechanistic model for N-lobe of ovotransferrin. J. Biol. Chem. 2000;275:12463–12469. doi: 10.1074/jbc.275.17.12463. [DOI] [PubMed] [Google Scholar]
- 30.Giannetti AM, Halbrooks PJ, Mason AB, Vogt TM, Enns CA, Bjorkman PJ. The molecular mechanism for receptor-stimulated iron release from the plasma iron transport protein transferrin. Structure. 2005;13:1613–1623. doi: 10.1016/j.str.2005.07.016. [DOI] [PubMed] [Google Scholar]
- 31.Byrne SL, Leverence R, Klein JS, Giannetti AM, Smith VC, MacGillivray RT, Kaltashov IA, Mason AB. Effect of glycosylation on the function of a soluble, recombinant form of the transferrin receptor. Biochemistry. 2006;45:6663–6673. doi: 10.1021/bi0600695. [DOI] [PubMed] [Google Scholar]
- 32.James NG, Mason AB. Protocol to determine accurate absorption coefficients for iron-containing transferrins. Anal. Biochem. 2008;378:202–207. doi: 10.1016/j.ab.2008.04.012. [DOI] [PMC free article] [PubMed] [Google Scholar]
- 33.Turkewitz AP, Amatruda JF, Borhani D, Harrison SC, Schwartz AL. A high yield purification of the human transferrin receptor and properties of its major extracellular fragment. J. Biol. Chem. 1988;263:8318–8325. [PubMed] [Google Scholar]
- 34.Bali PK, Zak O, Aisen P. A new role for the transferrin receptor in the release of iron from transferrin. Biochemistry. 1991;30:324–328. doi: 10.1021/bi00216a003. [DOI] [PubMed] [Google Scholar]
- 35.West AP, Jr., Giannetti AM, Herr AB, Bennett MJ, Nangiana JS, Pierce JR, Weiner LP, Snow PM, Bjorkman PJ. Mutational analysis of the transferrin receptor reveals overlapping HFE and transferrin binding sites. J. Mol. Biol. 2001;313:385–397. doi: 10.1006/jmbi.2001.5048. [DOI] [PubMed] [Google Scholar]
- 36.Giannetti AM, Snow PM, Zak O, Bjorkman PJ. Mechanism for multiple ligand recognition by the human transferrin receptor. PLoS Biology. 2003;1:E51. doi: 10.1371/journal.pbio.0000051. [DOI] [PMC free article] [PubMed] [Google Scholar]
- 37.Teale FW. The ultraviolet fluorescence of proteins in neutral solution. Biochem. J. 1960;76:381–388. doi: 10.1042/bj0760381. [DOI] [PMC free article] [PubMed] [Google Scholar]
- 38.Gryczynski I, Wiczk W, Johnson ML, Lakowicz JR. Lifetime distributions and anisotropy decays of indole fluorescence in cyclohexane/ethanol mixtures by frequency-domain fluorometry. Biophysical Chemistry. 1988;32:173–185. doi: 10.1016/0301-4622(88)87005-4. [DOI] [PubMed] [Google Scholar]
- 39.Chen Y, Barkley MD. Toward understanding tryptophan fluorescence in proteins. Biochemistry. 1998;37:9976–9982. doi: 10.1021/bi980274n. [DOI] [PubMed] [Google Scholar]
- 40.Vivian JT, Callis PR. Mechanisms of tryptophan fluorescence shifts in proteins. Biophys. J. 2001;80:2093–2109. doi: 10.1016/S0006-3495(01)76183-8. [DOI] [PMC free article] [PubMed] [Google Scholar]
- 41.Mason AB, He QY, Halbrooks PJ, Everse SJ, Gumerov DR, Kaltashov IA, Smith VC, Hewitt J, MacGillivray RT. Differential effect of a His tag at the N- and C-termini: functional studies with recombinant human serum transferrin. Biochemistry. 2002;41:9448–9454. doi: 10.1021/bi025927l. [DOI] [PubMed] [Google Scholar]
- 42.Mason AB, Funk WD, MacGillivray RT, Woodworth RC. Efficient production and isolation of recombinant amino-terminal half-molecule of human serum transferrin from baby hamster kidney cells. Protein Expr. Purif. 1991;2:214–220. doi: 10.1016/1046-5928(91)90074-s. [DOI] [PubMed] [Google Scholar]
- 43.Nurizzo D, Baker HM, He QY, MacGillivray RT, Mason AB, Woodworth RC, Baker EN. Crystal structures and iron release properties of mutants (K206A and K296A) that abolish the dilysine interaction in the N-lobe of human transferrin. Biochemistry. 2001;40:1616–1623. doi: 10.1021/bi002050m. [DOI] [PubMed] [Google Scholar]
- 44.James NG, Byrne SL, Mason AB. Incorporation of 5-hydroxytryptophan into transferrin and its receptor allows assignment of the pH induced changes in intrinsic fluorescence when iron is released. Biochim. Biophys. Acta. 2008 doi: 10.1016/j.bbapap.2008.11.017. In Press. [DOI] [PMC free article] [PubMed] [Google Scholar]
- 45.Mason AB, Tam BM, Woodworth RC, Oliver RW, Green BN, Lin LN, Brandts JF, Savage KJ, Lineback JA, MacGillivray RT. Receptor recognition sites reside in both lobes of human serum transferrin. Biochem. J. 1997;326(Pt 1):77–85. doi: 10.1042/bj3260077. [DOI] [PMC free article] [PubMed] [Google Scholar]
- 46.He QY, Mason AB, Lyons BA, Tam BM, Nguyen V, MacGillivray RT, Woodworth RC. Spectral and metal-binding properties of three single-point tryptophan mutants of the human transferrin N-lobe. Biochem. J. 2001;354:423–429. doi: 10.1042/0264-6021:3540423. [DOI] [PMC free article] [PubMed] [Google Scholar]
- 47.Callis PR, Liu T. Quantitative Prediction of Fluorescence Quantum Yields for Tryptophan in Proteins. J. Phys. Chem. B. 2004;108:4248–4259. [Google Scholar]
- 48.Beatty EJ, Cox MC, Frenkiel TA, Tam BM, Mason AB, MacGillivray RTA, Sadler PJ, Woodworth RC. Interlobe communication in 13C-methionine-labeled human transferrin. Biochemistry. 1996;35:7635–7642. doi: 10.1021/bi960684g. [DOI] [PubMed] [Google Scholar]
- 49.Gumerov DR, Mason AB, Kaltashov IA. Interlobe communication in human serum transferrin: metal binding and conformational dynamics investigated by electrospray ionization mass spectrometry. Biochemistry. 2003;42:5421–5428. doi: 10.1021/bi020660b. [DOI] [PubMed] [Google Scholar]
- 50.Hamilton DH, Turcot I, Stintzi A, Raymond KN. Large cooperativity in the removal of iron from transferrin at physiological temperature and chloride ion concentration. J. Biol. Inorg. Chem. 2004;9:936–944. doi: 10.1007/s00775-004-0592-6. [DOI] [PubMed] [Google Scholar]
- 51.Bali PK, Aisen P. Receptor-modulated iron release from transferrin: differential effects on N- and C-terminal sites. Biochemistry. 1991;30:9947–9952. doi: 10.1021/bi00105a019. [DOI] [PubMed] [Google Scholar]
- 52.el Hage Chahine JM, Pakdaman R. Transferrin, a mechanism for iron release. Eur. J. Biochem. 1995;230:1102–1110. doi: 10.1111/j.1432-1033.1995.tb20661.x. [DOI] [PubMed] [Google Scholar]
- 53.Bali PK, Aisen P. Receptor-induced switch in site-site cooperativity during iron release by transferrin. Biochemistry. 1992;31:3963–3967. doi: 10.1021/bi00131a011. [DOI] [PubMed] [Google Scholar]
- 54.Weber G. Fluorescence-polarization spectrum and electronic-energy transfer in proteins. Biochem. J. 1960;75:345–352. doi: 10.1042/bj0750345. [DOI] [PMC free article] [PubMed] [Google Scholar]
- 55.Jameson DM, Gratton E, Eccleston JF. Intrinsic fluorescence of elongation factor Tu in its complexes with GDP and elongation factor Ts. Biochemistry. 1987;26:3894–3901. doi: 10.1021/bi00387a023. [DOI] [PubMed] [Google Scholar]