Abstract
In many species, social behavior is organized via chemical signaling. While many of these signals have been identified for insects, the chemical identity of these social cues (often called pheromones) for mammals is largely unknown. We recently isolated these chemical cues that caused firing in the pheromone-sensing neurons of the vomeronasal organ from female mouse urine [Nodari, F., et al. (2008) J. Neurosci. 28, 6407–6418]. Here, we report their structural characterization. Mass spectrometric approaches, including tandem quadrupole, multiple-stage linear ion trap, high-resolution mass spectrometry, and H–D exchange followed by ESI mass spectrometry, along with 1H and 13C nuclear magnetic resonance spectroscopy, including two-dimensional correlation spectroscopy, total correlation spectroscopy, heteronuclear multiple-quantum coherence, and NOE, were used to identify two sulfated steroids, 4-pregnene-11β,20,21-triol-3-one 21-sulfate (I) (the configuration at C20 was not deduced) and 4-pregnene-11β,21-diol-3,20-dione 21-sulfate (II), whose presence is sex-specific. The identification of this novel class of mammalian social signaling compounds suggests that steroid hormones, upon conjugation, assume a new biological role, conveying information about the organism's identity and physiological state.
A mouse uses pheromones to signal its sex, social status, and individual or strain identity. Behavioral data have shown that pheromones are present in urine and are often detected by the vomeronasal sensory neurons (VSNs),1 which consist of ∼250 distinct neural types (2). Until recently, only a handful of volatiles or peptides in urine have been identified as activating VSNs (3-7); together, these account for only a small percentage of the neural responses to natural stimuli (1).
Recently, we performed a screen for the active compounds in female mouse urine (1). As an assay, we examined the firing responses of the VSNs; to enhance throughput with this diverse cell population, we recorded these responses on a multielectrode array. Studies on the physicochemical properties of active compounds using various types of binary fractionation approaches, including size exclusion chromatography (with a cutoff of 5000 Da) and solid-phase extractions (binding to octadecyl silica, cation exchange, and anion exchange columns, as well as anionic pKa by binding to a weak anion exchange column), revealed that a large majority (75–80%) of neuronal responses were to an unexpectedly homogeneous collection of compounds, having a low molecular weight, a low volatility, a moderate hydrophobicity, and a strong negative charge (1).
When isolated, many of these compounds were found to contain a sulfate moiety (1). By precursor ion scanning mass spectrometry, at least 13 sulfated compounds in the molecular weight range of 400–450 were found, of which at least six caused reproducible firing rate increases in different subsets of VSNs. Surprisingly, these compounds were not detectable in male mouse urine, indicating a significant degree of sex selectivity in their expression (8, 9). Treatment with sulfatase destroyed approximately 80% of the activity of female mouse urine on VSNs. These experiments suggested that sulfated compounds represent the main source of activity for VSNs in female mouse urine.
Here, we present the structural characterization of two major compounds, of which each activates a subset of VSNs. Using mass spectrometry and NMR spectroscopy, we identified these compounds as 4-pregnene-11β,20,21-triol-3-one 21-sulfate (I, Scheme 1) and 4-pregnene-11β,21-diol-3,20-dione 21-sulfate (II, Scheme 2), respectively. The identification of these conjugated glucocorticoids introduces an unexpected new dimension into the types of physiologically relevant signals detected by mammalian pheromone-sensing olfactory systems.
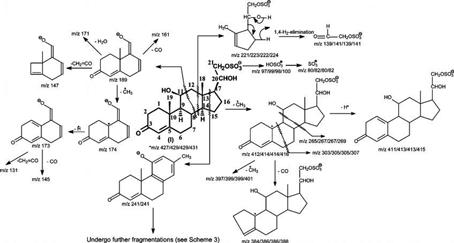
Scheme 1.
Fragmentation Processes Proposed for the [M − H]− Ion of 4-Pregnene-11β,20,21-triol-3-one 21-Sulfate (SS427)a
a The m/z values of the analogous ions that give mass shifts arising from 34S-, 2H2-, and 34S- and 2H2-labeled isotopologues are shown after a slash. The slash and m/z values are not shown if MSn experiments with the isotopologues were not performed.
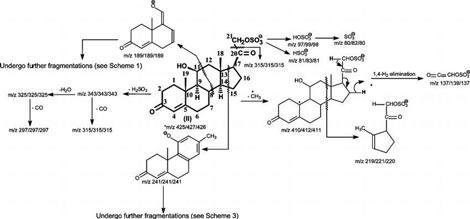
Scheme 2.
Fragmentation Processes Proposed for the [M − H]− Ion of 4-Pregnene-11β,21-diol-3,20-one 21-Sulfate (cort21S; SS425)a
a The m/z values of the analogous ions that give mass shifts arising from 34S- and 2H-labeled isotopologues are shown after a slash. The slash and m/z values are not shown if MSn experiments with the isotopologues were not performed.
EXPERIMENTAL PROCEDURES
Materials
Collection of mouse urine and isolation and purification of steroid sulfate were described previously (1). Briefly, approximately 1 L of mouse urine was collected over a continuous period of 2 months from 30 BALB/c females. A urine extract was prepared by chloroform/methanol extraction, followed by binding to an octadecyl silica cartridge (washing with a 20% methanol/2% acetic acid solution in water and eluting with 100% methanol) and binding to a weak anion exchange column (extract loaded in a 10% methanol/2% acetic acid solution in water, washed with 2% acetic acid in methanol, and eluted with 5% ammonium hydroxide in methanol). SS427 material used for NMR spectroscopy was derived from a quantity of extract equivalent to 192 mL of urine and purified by HPLC on an octadecyl silica column with a methanol gradient from 10 to 58% over 100 min followed by 90% methanol for 20 min. This yielded between 200 and 400 μg of highly purified SS427. Corticosterone 21-sulfate was purchased from Sigma (St. Louis, MO) and Steraloids (Newport, RI). All the other synthetic sulfated steroids were from Steraloids.
Mass Spectrometry
Low-energy CAD tandem mass spectrometry experiments were conducted both on a Finnigan (San Jose, CA) LTQ linear ion trap (IT) mass spectrometer (MS) with the Xcalibur operating system and on a Finnigan TSQ-7000 triple-stage quadrupole (TSQ) mass spectrometer with an ICIS operating system. High-resolution accurate mass measurements were recorded with a Finnigan LTQ-FT instrument with internal calibration. The resolution was set at 200000. The methanolic sample solution was infused (2 μL/min) to the ESI source, where the skimmer was set at ground potential, the electrospray needle was set at 4.5 kV, and the temperature of the heated capillary was 260 °C. The automatic gain control of the ion trap was set to 5 × 10⁴, with a maximum injection time of 100 ms. Helium was used as the buffer and collision gas at a pressure of 1 × 10⁻³ mbar (0.75 mTorr). The MSn experiments were carried out with a relative collision energy ranging from 30 to 40% and with an activation q value at 0.25. The activation time was set at 30 ms. Mass spectra were collected in the profile mode, typically for 3–5 min for MS2 and MS3 spectra. The mass resolution of the instrument was tuned to 0.6 Da at half-peak height. For product ion spectra obtained with a TSQ instrument, the precursor ions were selected in the first quadrupole (Q1), collided with Ar (2.3 mTorr) in the rf-only second quadrupole (Q2), and analyzed in the third quadrupole (Q3). The collision energies were set at 45 eV. Both Q1 and Q3 were tuned to unit mass resolution and scanned at a rate of 3 s/scan. The mass spectra were accumulated in the profile mode, typically for 3–5 min for a tandem mass spectrum. For source CAD product ion spectra, the skimmer voltage was set at 40 eV to yield product ions that were selected for further MS/MS.
NMR Spectroscopy
NMR spectra were recorded with a Varian Inova-600 spectrometer (Varian Associates, Palo Alto, CA), and the data were processed with VNMR. Proton and carbon chemical shifts were measured in parts per million (ppm) downfield from an external 3-(trimethylsilyl)propionic acid (TSP) standard. Proton spectra were obtained in methanol-d4 (CD3OD) with a 5900 Hz spectral width collected into 32K data points.
Carbon spectra were obtained with a 38000 Hz spectral width collected into 64K data points. The gradient COSY experiment was collected with a spectral width of 5900 Hz and 1024 complex points in the F2 dimension and 512 real points in the F1 dimension. The total correlation (TOCSY) spectra were recorded using an MELV-17 mixing sequence of 100 ms flanked by two 2 ms trim pulses. Phase-sensitive two-dimensional (2D) spectra were obtained by employing the Hypercomplex method. A 2 × 256 × 2048 data matrix with 16 scans per t1 increment was collected. Gaussian and sine-bell apodization functions were used in weighting the t2 and t1 dimensions, respectively. After two-dimensional Fourier transformation, the 2048 × 2048 frequency domain representation was phase and baseline corrected in both dimensions. The proton-detected heteronuclear multiple-quantum coherence (HMQC) spectrum was recorded using a 0.3 s 1H–13C nulling period. The 90° 1H pulse width was 8.8 ms, and the 90° 13C pulse width was 12.5 ms. The proton spectral width was set to 5900 Hz, and the carbon spectral width was set to 38000 Hz. Phase-sensitive 2D spectra were obtained by employing the Hypercomplex method. A 2 × 256 × 2048 data matrix with 64 scans per t1 value was collected. Gaussian line broadening was used in weighting the t2 and t1 dimensions. After two-dimensional Fourier transformation, the spectra resulted in 512 × 2048 data points, which were phase and baseline corrected in both dimensions. The NOESY2 spectrum resulted in a 2 × 256 × 2049 data matrix with 16 scans per t1 value. Spectra were recorded with a mixing time of 420 ms. The Hypercomplex method was used to yield phase-sensitive spectra. The time domain data were zero filled to yield a 2K × 2K data matrix and were processed in a manner similar to that of the 2D TOCSY spectrum described above.
RESULTS AND DISCUSSION
Fractions that activated VSNs were isolated from approximately 1 L of urine from female BALB/c mice as previously described (1). Two molecular species that activated VSNs were seen at m/z 427 and 425 by negative-ion ESI/MS. In this study, they were dubbed SS427 and SS425, respectively.
Structural Characterization of SS427 by Mass Spectrometry
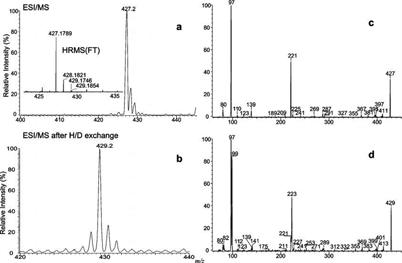
The ESI/MS spectrum obtained with either an ion trap or a tandem quadrupole instrument in the negative ion mode exhibited a single predominant [M − H]− ion of steroid sulfate at m/z 427 (SS427) (Figure 1a). High-resolution mass measurement of that ion with an LTQ-FT mass spectrometer gave an accurate m/z value of 427.1789 (Figure 1a, inset), probably corresponding to an elemental composition of C21H31O7S (calculated mass, 427.1790), which implied six degrees of unsaturation. This elemental composition is in agreement with the isotope profile seen in Figure 1a, of which the abundance of the ion at m/z 429 arising from the [M − H + 2]− isotopologue is ∼8% of that of the m/z 427 ion, indicating that the compound contains one S. The presence of one S atom is further revealed by high-resolution mass measurement of the m/z 429 ion (Figure 1a, inset) which gave both an accurate m/z of 429.1746 (relative abundance, 4%), corresponding to a composition of C21H31O734S (calculated mass, 429.1748), and an accurate m/z of 429.1854 (relative abundance, 4%) arising from a 13C2C19H31O7S isotopologue (calculated mass, 429.1857). The profile of the ESI/MS spectrum after H–D exchange (Figure 1b) is also similar but showed a mass shift of 2 Da to m/z 429 (from m/z 427), indicating that the [M − H]− ion contains two exchangeable hydrogen atoms (i.e., the compound contains three exchangeable hydrogens).
Figure 1.
IT ESI/MS spectra of 4-pregnene-11β,20,21-triol-3-one 21-sulfate obtained before (a) and after (b) H–D exchange and tandem quadrupole product ion spectra of the [M − H]− ions at m/z 427 (c) and m/z 429 (d), which mainly represents a 34S-labeled isotopologue at m/z 427. The accurate mass measurement (panel a, inset) was conducted with an LTQ-FT instrument.
The assignment of the structure of I for the ion at m/z 427 was deduced by the various product ion spectra obtained with a TSQ instrument, along with the various MSn spectra (n = 2, 3, or 4) obtained with an ion trap mass spectrometer, as well as high-resolution mass measurement with an LTQ-FT instrument as described below. While the tandem quadrupole product ion spectra provide nearly complete structural information for characterization of the compounds, the IT multiple-stage tandem mass spectra and the accurate mass measurements confirm the fragmentation mechanisms, leading to unambiguous structural assignment.
As shown in Figure 1c, the product ion spectrum of the [M − H]− ion at m/z 427 is dominated by the ion at m/z 97, corresponding to an HSO4− anion. The composition of the ion is confirmed by high-resolution mass measurement (Table 1), which gives a mass of 96.9596 (calculated mass, 96.9596). The presence of OSO3H− is further confirmed by observation of the ion at m/z 99, corresponding to a H34SO4− anion, seen in the product ion spectrum of the ion at m/z 429 (Figure 1d), an analogous 34S-labeled isotopologue. The presence of the OSO3H group in the molecule is also in agreement with the finding that the tandem mass spectra arising from a precursor ion scan at m/z 97 on the samples that were not subjected to enzymatic digestion with sulfatase contain the ion at m/z 427, while this ion is absent in the spectra arising from the samples that were subjected to sulfatase treatment (data not shown).
Table 1.
High-Resolution Mass Measurements of Major Fragment Ions
| nominal mass (m/z) |
measured mass (Da) |
calculated mass (Da) |
elementary composition |
|---|---|---|---|
| 427 | 427.1789 | 427.1790 | C21H31O732S |
| 429 | 429.1746 | 429.1748 | C21H31O734S |
| 412 | 412.1556 | 412.1556 | C20H28O732S |
| 411 | 411.1478 | 411.1477 | C20H27O732S |
| 409 | 409.1686 | 409.1685 | C21H29O532S |
| 397 | 397.1324 | 397.1322 | C19H25O732S |
| 384 | 384.1604 | 384.1606 | C19H28O632S |
| 381 | 381.1375 | 381.1372 | C19H25O632S |
| 367 | 367.1217 | 367.1215 | C18H23O632S |
| 303 | 303.0903 | 303.0902 | C13H19O632S |
| 221 | 221.0484 | 221.0483 | C8H13O532S |
| 139 | 138.9705 | 138.9701 | C2H3O532S |
| 97 | 96.9596 | 96.9596 | H32SO4 |
The spectrum also contains an abundant ion at m/z 221 (C8H13O5S; measured mass, 221.0484; calculated mass, 221.0483), arising from cleavage of the C12–C13 and C8–C14 bonds (Scheme 1). The ion at m/z 139 (C2H3O5S; calculated mass, 138.9701; measured mass, 138.9705) may represent an O=CHCH2–OSO3− ion formed via a 1,4-H2 elimination that cleaves the C17–C20 bond (10). The product ion spectrum of the ion at m/z 429 from an analogous 34S-labeled isotopologue (Figure 1d) contains the ion at m/z 141, corresponding to an O=CHCH2–O34SO3− ion. This result further supports the fragmentation process. Further dissociation of the ion at m/z 139 using an ion trap instrument or a tandem quadrupole with application of skimmer CAD gives rise to the HSO4− ion at m/z 97 (data not shown), consistent with the suggestion that the m/z 139 ion indeed represents an O=CHCH2–OSO3− residue. These results indicate that the sulfate residue is located at C21 (Scheme 1).
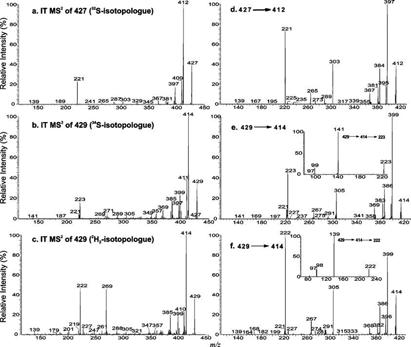
By contrast, the IT MS2 spectrum of the ion at m/z 427 (Figure 2a) is dominated by the ion at m/z 412 (C20H28O7S; calculated mass, 412.1556; measured mass, 412.1556), arising from the loss of a CH3 moiety, probably at C19. The ion at m/z 409 (C21H29O5S; calculated mass, 409.1685; measured mass, 409.1686) may result from the loss of H2O (Scheme 1). These fragmentation processes are consistent with the observation of the mass shifts in the MS2 product ion spectra arising from the 34S-labeled analogue (Figure 2b) or from the 2H2-labeled isotopologue (Figure 2c) generated by H–D exchange (Scheme 1).
Figure 2.
IT MS2 spectra of the [M − H]− ions at m/z 427 (a) and m/z 429 (b) from a 34S-labeled isotopologue and the ion at m/z 429 (c) from a 2H2-labeled isotopologue and IT MS3 spectra of the ions at m/z 412 (427 → 412) (d) and m/z 414 (429 → 414) from a 34S-labeled isotopologue (e) and m/z 414 (429 → 414) from a 2H2-labeled isotopologue (f). The insets in panels e and f show the IT MS4 spectra of the ions at m/z 223 (429 → 414 → 223) and m/z 222 (429 → 414 → 222), respectively.
The consecutive losses of CH3 and CO moieties from the ion at m/z 412 give rise to the ions at m/z 397 (C19H25O7S; calculated mass, 397.1322; measured mass, 397.1324) and m/z 384 (C19H28O6S; calculated mass, 384.1606; measured mass, 384.1604), respectively (Scheme 1). These fragmentation processes are further supported by the MS3 spectrum of the ion at m/z 412 (427 → 412) (Figure 2d), which contains ions at m/z 397 and 384. The results are also consistent with the mass shifts of the analogous ions seen in the IT MS3 spectra of the ion at m/z 414 (429 → 414) (Figure 2e) from a 34S-labeled isotopologue and of the ion at m/z 414 (429 → 414) (Figure 2f) from a 2H2-labeled isotopologue. The IT MS4 spectrum of the ion at m/z 223 (429 → 414 → 223) (Figure 2e, inset) that originated from a 34S-labeled isotopologue contains an abundant ion at m/z 141, while the MS4 spectrum of the ion at m/z 222 [429 → 414 → 222 (Figure 2f, inset)] that originated from a 2H2-labeled isotopologue is dominated by the ion at m/z 139. These results again are in agreement with the proposed fragmentation mechanism shown in Scheme 1.
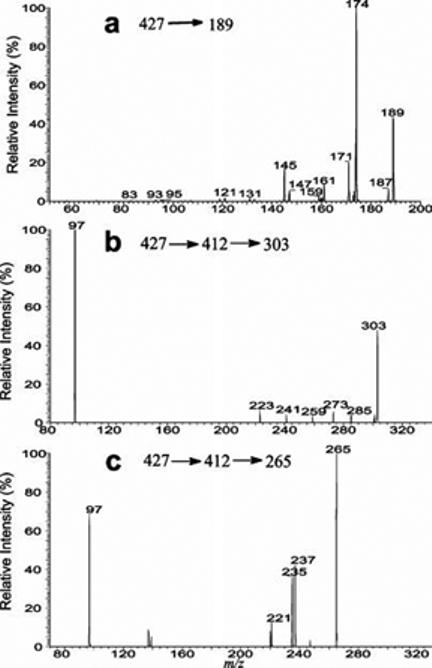
The weak ion seen at m/z 189 may arise from cleavage of the C11–C12 and C8–C14 bonds (Scheme 1). The observation of this ion indicates the presence of a hydroxyl group, probably at C11. This notion is based on the finding that an m/z 189 ion is also seen in the product ion spectra of the [M − H]− ions of the 4-pregnene-11β,21-diol-3,20-dione 21-sulfate standard seen at m/z 425 (Figure 4b) and of the 4-pregnene-20-keto,11α,21-diol-3-one standard seen at m/z 345 (not shown), which possess a hydroxyl group at C11. The MS3 spectra of the ion at m/z 189 that originated from SS427 (427 → 189), 4-pregnene-20-keto,11α,21-diol-3-one (345 → 189), and SS425 (425 → 189) (Figure 3a) are identical but are readily distinguishable from that arising from a 6-hydroxy isomer of the 4-pregnene-20-keto,6,21-diol-3-one standard (345 → 189) (data not shown), suggesting the presence of a hydroxyl group at C11 for SS427, while the other hydroxyl groups is located at C21 as described earlier. The MS3 spectrum of the ion at m/z 189 (427 → 189) (Figure 3a) contains the prominent ion at m/z 174 arising from loss of a CH3 radical and the ion at m/z 173 (174 – 1) arising from further loss of a H atom. The spectrum also contains the ions at m/z 171 and 161, arising from losses of a H2O and a CO residue, respectively, along with the ion at m/z 145, arising from the ion at m/z 173 by loss of a CO residue. These results support the structure proposed for the ion at m/z 189, which arises from cleavage of the C11–C12 and C8–C14 bonds and possesses the hydroxyl group at C11. The assignment of the position of hydroxyl groups for SS427 is further confirmed by NMR spectroscopy (see the NMR results).The presence of the hydroxyl group at C11 is also in agreement with the observation of the ions at m/z 303 (C13H19O6S; calculated mass, 303.0902; measured mass, 303.0903) probably arising from cleavages of the C6–C7 and C9–C10 bonds and at m/z 265 arising from cleavages of the C9–C11 and C8–C14 bonds seen in panels a and d of Figure 2. The MS4 spectra of the ions at m/z 303 (427 → 412 → 303) (Figure 3b) and 265 (427 → 412 → 265) (Figure 3c) all contained the ions at m/z 97, indicating that these fragment ions bear the OSO3H moiety, consistent with the deduced structure of SS427. The proposed fragmentation processes (Scheme 1) are also in accord with the observed mass shifts of the analogous ions at m/z 305 (from 303) and m/z 267 (from 265) seen in panels e and f Figure 2 and the mass shifts of the analogous ions at m/z 307 (from 303) and m/z 269 (from 265) seen in the MS3 spectrum of the ion at m/z 416 (431→ 416) from a 2H2- and 34S-labeled isotopologue of SS427 (data not shown).
Figure 4.
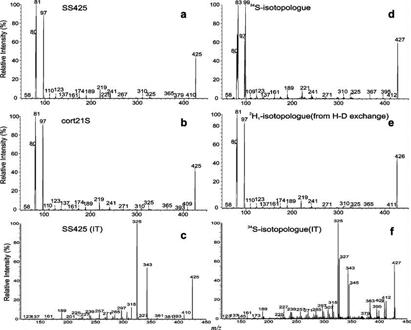
Tandem quadrupole product ion spectra of the [M − H]− ions at m/z 425 arising from SS425 (a) and the cort21S standard (b). The two spectra are identical, indicating that the ion seen at m/z 425 from endogenous sample is cort21S. The IT MS2 spectrum of the [M − H]− ions at m/z 425 from SS425 (c) is also identical to that arising from the synthetic standard (not shown). The mass shifts of the analogous ions seen in the tandem quadrupole product ion spectra of the [M − H]− ions at m/z 427 from a 34S-containing isomer (d) and at m/z 426 from a 2H-containing isomer (e) and the IT MS2 spectrum of the ion at m/z 427 from a 34S-containing isomer (f) are in accordance with the proposed fragmentation processes that are depicted in Scheme 2.
Figure 3.
IT MS3 spectrum of the ion at m/z 189 (427 → 189) (a) and IT MS4 spectra of the ions at m/z 303 (427 → 412 → 303) (b) and m/z 265 (427 → 412 → 265) (c). The observation of the ion at m/z 97 in the latter two spectra demonstrated that both the m/z 303 and 265 ions contain an OSO3− group.
Structural Characterization of SS425
When subjected to ESI in negative ion mode with an ion trap or a tandem quadrupole mass spectrometer, another major steroid sulfate in the female mouse urine was seen at m/z 425, which represents an [M − H]− ion of corticosterone 21-sulfate (cort21S). This structural assignment is based on the findings that the tandem quadrupole product ion spectrum of the ion at m/z 425 (Figure 4a) is identical to that arising from the synthetic standard of compound II (Figure 4b). The LIT MS2 spectrum of the ion at m/z 425 from the endogenous sample (Figure 4c) is also identical to that arising from standard I. These results indicate that the ion at m/z 425 isolated from mouse urine is compound II. The structural assignment is further confirmed by the HPLC retention time and the TLC Rx value of the endogenous compound, which are identical to those of the compound II standard (data not shown). The ESI/MS spectra of both SS425 and the corticosterone 21-sulfate standard obtained after H–D exchange contained an ion at m/z 426 (data not shown), consistent with the notion that the [M − H]− ion of corticosterone 21-sulfate contains one exchangeable hydrogen atom. The identification of the structure of compound II and the understanding of the fragmentation processes of the compound upon CAD in a mass spectrometer provided valuable information leading to the structural assignment of the compound of SS427. The tandem mass spectrometric approaches to the elucidation of the fragmentation processes of the [M − H]− ion of corticosterone 21-sulfate and SS425 are described below.
As shown in Figure 4a, the tandem quadrupole product ion spectrum of the ion at m/z 425 is dominated by the ions at m/z 97, 81, and 80, representing HSO4−, HSO3−, and SO3− anions, respectively. The ion at m/z 80 arises from the ion at m/z 97, probably via loss of an OH radical. This fragmentation process is evidenced by the product ion spectrum of the ion at m/z 97 generated by skimmer CAD (data not shown). The ion at m/z 81 may result from the 1,3-shift of the α-hydrogen at C21 to the SO3− group by elimination of a 4-pregnene-11β-ol-3,20,21-trione-21 residue leading to a HSO3− ion at m/z 81. This unique ion is also abundantly seen in the mass spectra of, for example, 4-pregnene-11β,21-diol-3,20,dione 21-sulfate, 4-pregnene-17,21-diol-3,11,20,trione 21-sulfate, and 4-pregnene-11β,17,21-triol-3,20,dione 21-sulfate standards (data not shown), which possess a carbonyl group at C20 (i.e., possessing a CO-CH2OSO3H residue). By contrast, the ion at m/z 81 is not seen in the product ion spectrum of SS427 (Figure 2a), consistent with the assignment of the compound I structure for SS427, which possesses a hydroxyl rather than a carbonyl group at C20.
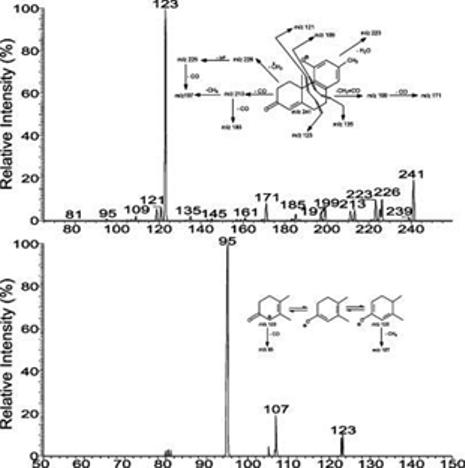
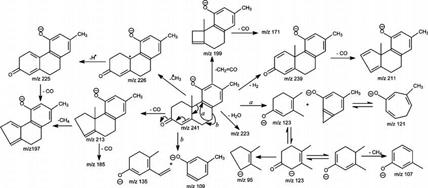
The spectrum (Figure 4a) also contains an ion at m/z 219 that arises from cleavage of the C12–C13 and C8–C14 bonds (Scheme 2), analogous to the ion at m/z 221 observed for compound I (Scheme 1). The ions at m/z 241, 189, and 123 may derive from the bond cleavages as shown in Scheme 2 and are also seen in Figure 1c. The proposed structures of the ions at m/z 241 and 123 and the fragmentation processes leading to these ions are deduced from the IT MS3 spectra of the ions at m/z 241 (425 → 241) (Figure 5a) and m/z 123 (425 → 241 → 123) (Figure 5b). The former spectrum (Figure 5a) contains the prominent ion at m/z 123, along with the ion at m/z 121, probably arising from cleavage of C6–C7 and C9–C10 bonds (Scheme 3, route a), as well as the ions at m/z 109 and 135 arising from cleavage of C7–C8 and C9–C10 bonds (Figure 5a, inset). The ions at m/z 239, 226, 223, 213, and 199 may arise from losses of a H2, methyl radical, H2O, CO, and a CH2=C=O, respectively, while ions at m/z 225 (226 – H), 211 (239 – CO), 185 (213 – CO), and 171 (199 – CO) may arise from further loss of a H atom or a CO residue from m/z 226, 239, 213, and 199 (Scheme 3). The IT MS3 spectrum of the ion at m/z 123 (Figure 5b) contains the prominent ion at m/z 95, arising from further loss of a CO, together with the ion at m/z 107, arising from loss of a CH4 residue (Scheme 3). The results are in agreement with the structures proposed for the ions at m/z 241 and 123. The fragmentation processes (Scheme 2) are also consistent with the observation of the mass shift(s) of the analogous ions seen in the tandem quadrupole product ion spectra of the 34S-labeled isotopologue of m/z 427 (Figure 4d) and of the 2H1-labeled isotopologue of m/z 426 (Figure 4e) produced by H–D exchange, as well as in the IT MS2 spectrum of the ion at m/z 427 from a 34S-labeled isotopologue (Figure 4f). The similarity in the fragmentation processes between compounds of SS427 (Scheme 1) and the cort21s standard (Scheme 2) further supports the notion that the SS427 is compound I as assigned earlier.
Figure 5.
IT MS3 spectrum of the ion at m/z 241 (425 → 241) and MS4 spectrum of the ion at m/z 123 (425 → 241 → 123) that originated from the [M − H]− ion at m/z 425 from cort21S.
Scheme 3.
Structure and Fragmentation Processes Proposed for the Ion at m/z 241, Arising from the [M − H]− Ions of 4-Pregnene-11β,21-diol-3,20-one 21-Sulfate and SS427, Revealing the Common Structure Shared by the Two Compounds
Structural Assignment by NMR Spectroscopy
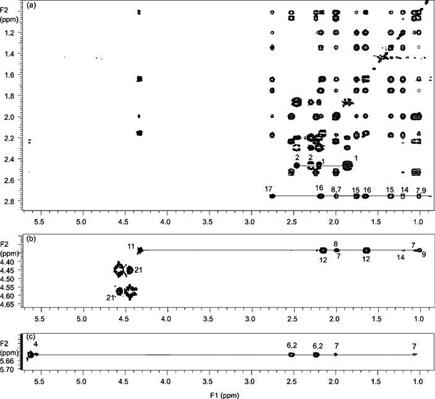
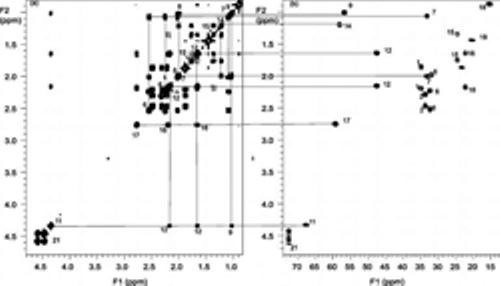
Proton and carbon chemical shifts of the cort21S standard and compound I (Table 2) were assigned by analysis of TOCSY, COSY, and HMQC spectra. H17, H11, and H4 were identified first by the spin resonance in the TOCSY spectra (Figure 6). Correlated proton resonances from 2.78 ppm (panel a) and 4.36 ppm (panel b) were unambiguously assigned to the spin propagation of H17–H7 and H11–H6 fragments, respectively. Cross-peaks in Figure 6c indicate the long-range coupling of H4 to H2, H6, and H7. Proton connectivity was obtained by using the vicinal J coupling of the COSY spectra. For example, the H11 identified in TOCSY (Figure 6b) can be traced to confirm the vicinal connectivity to H9 and H12 in the COSY experiment (Figure 7a). Correlation from H9 at 1.05 ppm can further lead to the connection of H8 and H7. Complete assignments of cort21S were obtained by tracing the HMQC cross-peaks to the same proton chemical shift in the COSY spectra. Connections in Figure 7 revealed not only that all the proton–proton and carbon–proton connections were observed but also that all seven methylene carbons (C1, C2, C6, C7, C12, C15, and C16) and protons can be assigned unambiguously.
Table 2.
Proton and Carbon Chemical Shift of Cort21S and SS427 in CD3OD at 25 °C
| cort21S |
SS427 |
|||
|---|---|---|---|---|
| δH (ppm) | δC (ppm) | δH (ppm) | δC (ppm) | |
| 1 | 1.89, 2.23 | 35.3 | 1.87, 2.20 | 35.5 |
| 2 | 2.32, 2.49 | 34 | 2.31, 2.49 | 34.2 |
| 4 | 5.66 | 122.1 | 5.65 | 122.1 |
| 6 | 2.27, 2.56 | 32.7 | 2.24, 2.53 | 33.1 |
| 7 | 1.10, 2.03 | 33.6 | 1.07, 2.21 | 33.9 |
| 8 | 2.03 | 32.4 | 2.00 | 32.4 |
| 9 | 1.05 | 57.1 | 1.04 | 58.0 |
| 11 | 4.36 | 67.9 | 4.27 | 68.5 |
| 12 | 1.68, 2.19 | 47.8 | 1.37, 2.34 | 49.4 |
| 14 | 1.24 | 58.4 | 1.00 | 57.5 |
| 15 | 1.38, 1.79 | 24.9 | 1.29, 1.70 | 25.2 |
| 16 | 1.68, 2.21 | 22.3 | 1.30, 1.69 | 25.1 |
| 17 | 2.78 | 59.7 | 1.49 | 53.4 |
| 18 | 0.91 | 15.9 | 1.04 | 14.9 |
| 19 | 1.48 | 20.8 | 1.49 | 21.2 |
| 20 | 3.72 | 73.5 | ||
| 21 | 4.47, 4.60 | 72.9 | 3.79, 4.03 | 72.8 |
Figure 6.
Expansion of (a) H17, (b) H11 and H21, and (c) H4 regions of the 600 MHz TOCSY spectra of cort21S in CD3OD. Cross-peaks of continuous spin propagation are indicated.
Figure 7.
Expansion of the aliphatic region of the 600 MHz (a) COSY and (b) HMQC spectra of cort21S in CD3OD.
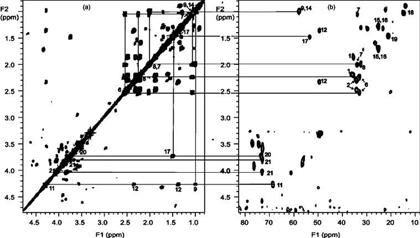
The COSY spectrum of compound I (Figure 8a) indicates H21 (at 4.03 and 3.79 ppm) was shifted upfield by 0.6 ppm when compared to that of cort21S (Figure 7a). H20 exhibited vicinal J coupling not only to H21 but also to H17, which is shifted upfield to 1.49 ppm (Figure 8a) from 2.78 ppm (Figure 7a) of cort21S. Meanwhile, tracing the proton resonance by HMQC indicated that the two H16 methylene protons are shifted to 1.30 and 1.69 ppm (Figure 8b), while they appear as two separate protons at 1.68 and 2.21 ppm in the cort21S standard (Figure 7b). These observations indicated that the hydroxylation of SS427 occurs at the carbonyl of C20, leading to the upfield shifting of the protons in the vicinity due to the disappearance of the carbonyl shielding effect. Observed cross-peaks in Figure 8 suggest the central part, from C13 to C5, of compound I is unaltered from that of cort21S; in particular, the resonances of the C12–C11–C9–C8–C7–C6 fragment are very similar to those from the corresponding cort21S standard, suggesting the hydroxyl group at the C11 position in cort21S is preserved in the same location for compound I.
Figure 8.
Expansion of the aliphatic region of the 600 MHz (a) COSY and (b) HMQC spectra of SS427 in CD3OD.
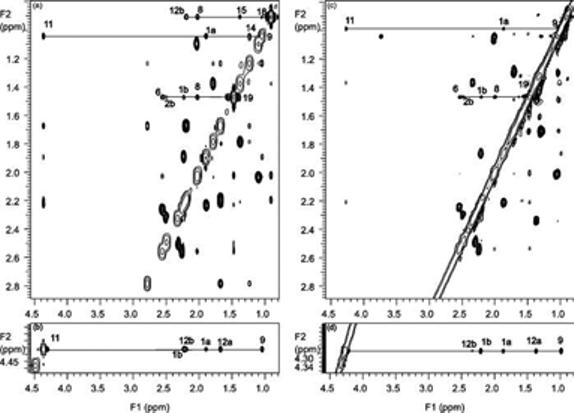
The β-OH orientations of cort21S and compound I were confirmed by NOESY spectra. As shown in panels a and b of Figure 9, H9 has strong NOE cross-peaks to H11, H14, and H1a. In the mean time, the presence of H8–H19 and H8–H18 NOE cross-peaks in Figure 9a revealed that H8, C18, and the C19 methyl group were in the β-orientation of the six-membered ring. The absences of H19–H11, –H9, or –H1a cross-peaks in addition to the observed H19–H1b NOE suggest the C11 hydroxyl group possesses a β-orientation as a C19 methyl. Similar NOE cross-peaks observed from H11, H9, and H19 resonances in panels c and d of Figure 9 indicated that the C11 OH group still kept a β-orientation in compound I.
Figure 9.
Expansion of NOESY spectra of cort21S (a and b) and SS427 (c and d) in CD3OD.
The combined results from mass spectrometry and NMR spectroscopy unambiguously determine that the compounds of SS427 and SS425 isolated from mouse urine are 4-pregnene-11β,20,21-triol-3-one 21-sulfate (I) and 4-pregnene-11β,21-diol-3,20-one 21-sulfate (II), respectively.
CONCLUSION
The structural elucidation of these ligands for VSNs as sulfated steroids has significant implications for the function of the vomeronasal olfactory system. Steroids control multiple aspects of metabolism and physiology, and sulfation is a major mechanism for their clearance from the body (11). We previously demonstrated that the urine concentration of SS427 and SS425 rises approximately 3-fold in mice that had previously been subjected to brief restraint stress (1). This is consistent with the role of glucocorticoids in mediating stress responses (12). The olfactory detection of steroids therefore potentially provides a mechanism for “spying” on the internal physiological state of other members of the species (13).
ACKNOWLEDGMENT
We thank Drs. Michael L. Gross and Henry Rohrs of Washington University Center for Biomedical and Bioorganic Mass Spectrometry for giving us access to the LTQ-FT instrument. We also thank the reviewers of this article for their valuable comments.
Footnotes
Supported by U.S. Public Health Service Grants R01-DC005964 (T.E.H.), P41-RR00954 (J.T.), P60-DK20579 (J.T.), P30-DK56341 (J.T.), and R37-DK34388 (J.T.) and the Pew Scholars Program (T.E.H.).
Abbreviations: CAD, collisionally activated dissociation; ESI, electrospray ionization; MS, mass spectrometry; TSQ, triple-stage quadrupole; MSn, multiple-stage tandem mass spectrometry; LIT, linear ion trap; FT, Fourier transform; NMR, nuclear magnetic resonance; COSY, correction spectroscopy; TOCSY, total correlation spectroscopy; HMQC, heteronuclear multiple-quantum coherence; VSNs, vomeronasal sensory neurons; RP-HPLC, reverse-phase high-performance liquid chromatography.
REFERENCES
- 1.Nodari F, Hsu FF, Fu X, Holekamp TF, Kao LF, Turk J, Holy TE. Sulfated steroids as natural ligands of mouse pheromone-sensing neurons. J. Neurosci. 2008;28:6407–6418. doi: 10.1523/JNEUROSCI.1425-08.2008. [DOI] [PMC free article] [PubMed] [Google Scholar]
- 2.Shi P, Zhang J. Comparative genomic analysis identifies an evolutionary shift of vomeronasal receptor gene repertoires in the vertebrate transition from water to land. Genome Res. 2007;17:166–174. doi: 10.1101/gr.6040007. [DOI] [PMC free article] [PubMed] [Google Scholar]
- 3.Leinders-Zufall T, Lane AP, Puche AC, Ma W, Novotny MV, Shipley MT, Zufall F. Ultrasensitive pheromone detection by mammalian vomeronasal neurons. Nature. 2000;405:792–796. doi: 10.1038/35015572. [DOI] [PubMed] [Google Scholar]
- 4.Sam M, Vora S, Malnic B, Ma W, Novotny MV, Buck LB. Neuropharmacology. Odorants may arouse instinctive behaviours. Nature. 2001;412:142. doi: 10.1038/35084137. [DOI] [PubMed] [Google Scholar]
- 5.Leinders-Zufall T, Brennan P, Widmayer P,S, Chandramani Prashanth, Maul-Pavicic A, Jager M, Li XH, Breer H, Zufall F, Boehm T. MHC class I peptides as chemosensory signals in the vomeronasal organ. Science. 2004;306:1033–1037. doi: 10.1126/science.1102818. [DOI] [PubMed] [Google Scholar]
- 6.Kimoto H, Haga S, Sato K, Touhara K. Sex-specific peptides from exocrine glands stimulate mouse vomeronasal sensory neurons. Nature. 2005;437:898–901. doi: 10.1038/nature04033. [DOI] [PubMed] [Google Scholar]
- 7.Chamero P, Marton TF, Logan DW, Flanagan K, Cruz JR, Saghatelian A, Cravatt BF, Stowers L. Identification of protein pheromones that promote aggressive behaviour. Nature. 2007;450:899–902. doi: 10.1038/nature05997. [DOI] [PubMed] [Google Scholar]
- 8.Lewis DA. Androgen sulphate formation in male and female mice. Biochem. J. 1969;115:489–493. doi: 10.1042/bj1150489. [DOI] [PMC free article] [PubMed] [Google Scholar]
- 9.Alnouti Y, Klaassen CD. Tissue distribution and ontogeny of sulfotransferase enzymes in mice. Toxicol. Sci. 2006;93:242–255. doi: 10.1093/toxsci/kfl050. [DOI] [PubMed] [Google Scholar]
- 10.Tomer KB, Gross ML. Fast atom bombardment and tandem mass spectrometry for structural determination: Remote site fragmentation of steroid conjugates and bile salts. Biomed. Environ. Mass Spectrom. 1988;15:89–98. doi: 10.1002/bms.1200150206. [DOI] [PubMed] [Google Scholar]
- 11.Larsen PR, Williams RH. Williams Textbook of Endocrinology. Saunders; Philadelphia: 2003. [Google Scholar]
- 12.Boyle MP, Kolber BJ, Vogt SK, Wozniak DF, Muglia LJ. Forebrain glucocorticoid receptors modulate anxiety-associated locomotor activation and adrenal responsiveness. J. Neurosci. 2006;26:1971–1978. doi: 10.1523/JNEUROSCI.2173-05.2006. [DOI] [PMC free article] [PubMed] [Google Scholar]
- 13.Sorensen PW, Scott AP. The evolution of hormonal sex pheromones in teleost fish: Poor correlation between the pattern of steroid release by goldfish and olfactory sensitivity suggests that these cues evolved as a result of chemical spying rather than signal specialization. Acta Physiol. Scand. 1994;152:191–205. doi: 10.1111/j.1748-1716.1994.tb09799.x. [DOI] [PubMed] [Google Scholar]


